Annals of Bone Marrow Research
The probably use of MR-spectroscopy and diffusion weighted-MRI of bone marrow for treatment monitoring in patients with chronic lymphatic leukemia
Vicente Martínez-Vega1, Mar Jiménez-Peña*, Javier Carrascoso-Arranz1, Margarita Rubio-Alonso2, Juan Bachiller-Egea1, Carmen Martínez-Chamorro3 and Manuel Recio-Rodríguez1
2Faculty of Biomedical and Health Sciences, Universidad Europea de Madrid, Spain
3Department of Haematology, University Hospital Quironsalud Madrid, Spain
Cite this as
Martínez-Vega V, Jiménez-Peña M, Carrascoso-Arranz J, Rubio-Alonso M, Bachiller-Egea J, et al. (2021) The probably use of MR-spectroscopy and diffusion weighted-MRI of bone marrow for treatment monitoring in patients with chronic lymphatic leukemia. Ann Bone Marrow Res 6(1): 001-006. DOI: 10.17352/abmr.000007Objectives: To assess the usefulness of proton MR-spectroscopy (1H-MRS) and diffusion-weighted MRI (DW-MRI) sequences in the follow-up of CLL-patients with chemotherapy treatment. The monitoring of CLL-patients susceptible to chemotherapy treatment is complicated due to the difficulty in assessing the response to treatment. Chemotherapy leads to changes in bone marrow composition and these changes can be evaluated by functional MR-sequences.
Methods: 23 patients diagnosed with CLL by our hospital’s Hematology Service underwent a lumbar MR prior and post-chemotherapy applying 1H-MRS and DW-MRI. The concentrations of water and lipids were quantified applying the quantification program LCModel. The Apparent Diffusion Coefficient (ADC) values were calculated with the Functool program (GE). The Wilcoxon sign test was used to compare pre and post treatment results, considering statistically significant P values lower than 0.05.
Results: Responder patients decreased the ratio H2O/lipids concentration measured with 1H-MRS and increased the ADC value on DW-MRI in post-treatment studies (P<0.05). Patients without response increased the ratio and decreased the ADC values or did not modify the data.
Conclusion: 1H-MRS and DW-MRI of spinal bone marrow are non-invasive and repeatable techniques that might help in follow-up monitoring of patients with CLL.
Introduction
In recent years it has become a useful practice in certain oncohematological pathologies, such as multiple myeloma, applying dedicated techniques as diffusion weighted MRI (DW-MRI) to diagnose and monitor patients [1-3] However, this technique and especially, proton spectroscopy-MR (1H-MRS) are not commonly used in the monitoring of patients with CLL, with scarce reports in the literature [4-6].
The disease has a very heterogeneous clinical course, with patients living decades without treatment and others with rapidly fatal evolution. The follow-up of patients under treatment sometimes raises doubts about the response, since clinical and analytical data are very variable, requiring a very close and long-term follow-up to define a conclusive response. Bone marrow biopsy is only used for diagnosis, not for follow-up, except in patients included in clinical trials.
The treatment causes changes in the cellularity of the bone marrow and, therefore, changes in the metabolic composition, affecting the proportion of H2O and lipids, which can be evaluated and quantified with either DW-MRI and 1H-MRS, which are safe and can be repeated when necessary.
In normal adult bone marrow, the main component is fat, with poor metabolic representation of H2O with a ratio in favor of lipid concentration [7]; when there is leukemic infiltration, adipocytes are replaced by leukemic cells, rich in aqueous content, switching the ratio. On the other hand, a decrease value of the Apparent Diffusion Coefficient (ADC) is generally noted in an infiltrated tumoral tissue [8,9]. The infiltrated bone marrow will show changes in diffusion, as the tumor cell volume increases.
The objective of the study is to analyze whether an increased fat-water ratio in spectra and increased ADC in DW-MRI could be associated with response to chemotherapy treatment in patients with CLL, aiding haematologist in the patient monitoring in the daily clinical practice.
Material and methods
Patients
Twenty-three patients diagnosed with CLL by our hospital’s Hematology Service were included in the study. All patients required chemotherapy based on the criteria established by the International Workshop On CLL (IwCLL2008): progressive medullary insufficiency defined by anemia or thrombocytopenia, progressive splenomegaly, growth of large adenopathic conglomerates, lymphocyte duplication time of 6 months or less, or lymphocytosis increase of more than 50% in 2 months, anemia and/or autoimmune thrombocytopenia that do not respond to immunosuppressive treatment and general symptoms.
The exclusion criteria were bone, hematological or concomitant pulmonary diseases, oncological treatments other than those inherent to their basal pathology, or patients who could not undergo an MRI study (pacemaker, pelvic or lumbar surgical material).
All patients signed informed consent and the study was approved by the hospital ethics committee.
The treatment used was chemo-immunotherapy FCR (Fludarabine-Cyclophosphamide-Rituximab), BR (bendamustine-rituximab) or CHOP-R (cyclophosphamide-adriamycin-vincristine-methylprednisolone-rituximab) and new treatments such as ibrutinib and lenalidomide.
After two months of chemotherapy treatment, the degree of response was measured in all patients. The patients were classified as responders or non-responders in the hematological department based on peripheral blood tests normalization (hemoglobin values, platelets and lymphocytes), morphological response of thoracic and abdominopelvic CT (lymphadenopathies, splenomegaly or soft tissue masses). Indeed, direct measurement with post-treatment bone marrow aspiration/ biopsy was also performed in these patients.
Three patients did not complete the study and one patient died during the treatment; therefore, complete data were finally obtained from 19 patients.
Image studies
All patients underwent a lumbar MRI study prior to chemotherapy treatment focused on the L3 vertebra with a routine T1-weighted morphological sequences to which a 1H-MRS and a DW-MRI study was added. The study does not require intravenous contrast and has a duration of 30 minutes.
A multichannel column coil was used, with spectral acquisitions in 3T magnet (Signa HDx, GEHealthcare, Milwaukee, WI, USA). The basal morphological image is a sagittal T1 (TE:min;TR:500ms, bandwidth 62.2 kHz; FOV 22 cm; thickness 5 mm; spacing 1 mm).
The DW-MRI was acquired in axial plane, with parallel imaging (ASSET) with the following parameters: factor b of 0 and 900 mm2/s, fat suppression, matrix of 128 x 128 and 8 NEX; FOV 20, TR >8000 ms; TE minimum 75-90 ms; cutting thickness: 5 mm; gap 1mm. Acquisition time was 3’30’’.
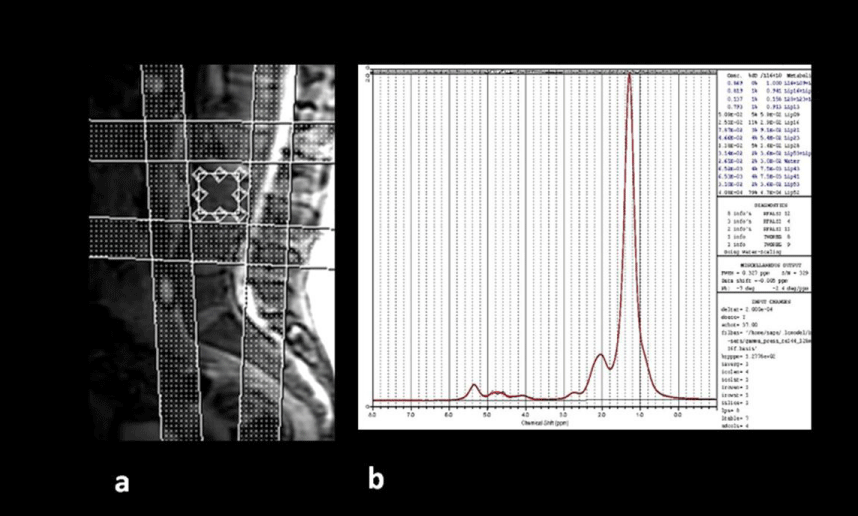
The spectral technique used is the PRESS technique (Point Resolved Spectroscopy) and the parameters used are TE 37 ms, TR 3000 ms, 64 averages without H2O suppression, sweep width=5000 Hz, autoshimming. The voxel used has dimensions of 15×15×20mm and is located in the center of the lumbar vertebra L3. Four to six saturation bands are used to increase homogeneity and avoid elements of confusion (Figure 1). The steam sequence (STEAM) shows advantages compared to PRESS sequence for fat quantification [10,11], but the acquisition is more complex for a daily routine practice.
The radiological data we collected from each patient pre- and two months post-treatment were: signal intensity on T1-weighted sequences (IT1), mean value of apparent diffusion coefficient (ADCm in mm2 /seg) and the ratio of the concentration (CC) of H2O / lipid metabolites (H20/Lip CC).
The lipids are located at 1.6-0.8 ppm in the spectral curve and are mainly from the methyl (CH3) and methylene (CH2) groups. The H2O peak is located between 4.7-4.8ppm. Concentrations derived from the raw data obtained from the spectral curves in the MR were processed by the quantification program LCModel (S. Provencher), analyzing the spectra as a linear combination, based on a group of complete models of spectroscopies of metabolites in “in vitro” solution.
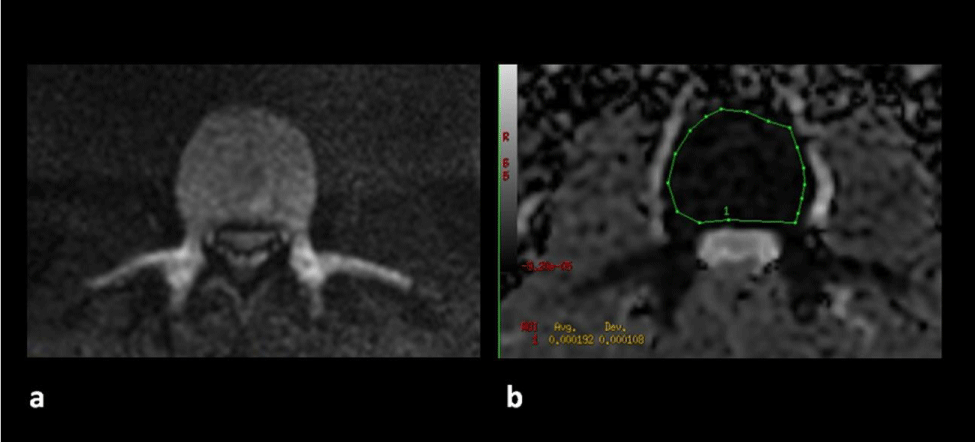
The ADCm value is calculated in an independent console, with the Functool program (GE), by means of an ROI that covers the entire area of the vertebral body L3 (Figure 2).
Statistical analysis
The frequencies of the categorical variables were expressed as absolute number and percentage. The Kolmogorov-Smirnov test was used to check whether the continuous variables followed a normal distribution. The median and the Interquartile Range (IQR) were used to describe the quantitative variables. The Wilcoxon sign test was used to compare pre and post treatment results, considering statistically significant P values lower than 0.05. The statistical package SPSS version 21.0 (IBM, Armonk, New York, USA) was used for data analysis.
Results
A total of 13 males and six females between the ages of 55 and 76 were studied. The clinical and analytical data collected from the patients are provided in the supplementary Table 1.
Of the 19 patients, 15 were responders and four patients were non-responders (had no analytical or morphological response in CT, or the bone marrow biopsy was positive).
Quantitative metabolite data obtained from spectra and mean ADC values of recruited patients pre- and post-treatment are provided as supplementary data (supplementary Tables 2,3).
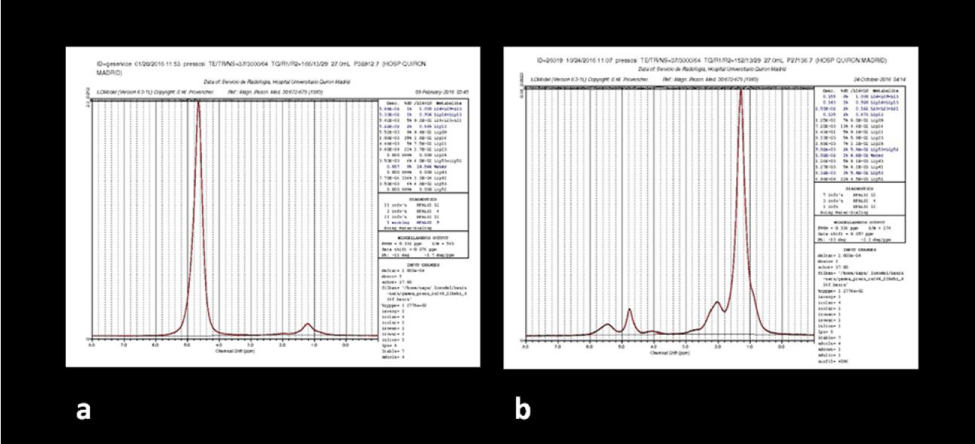
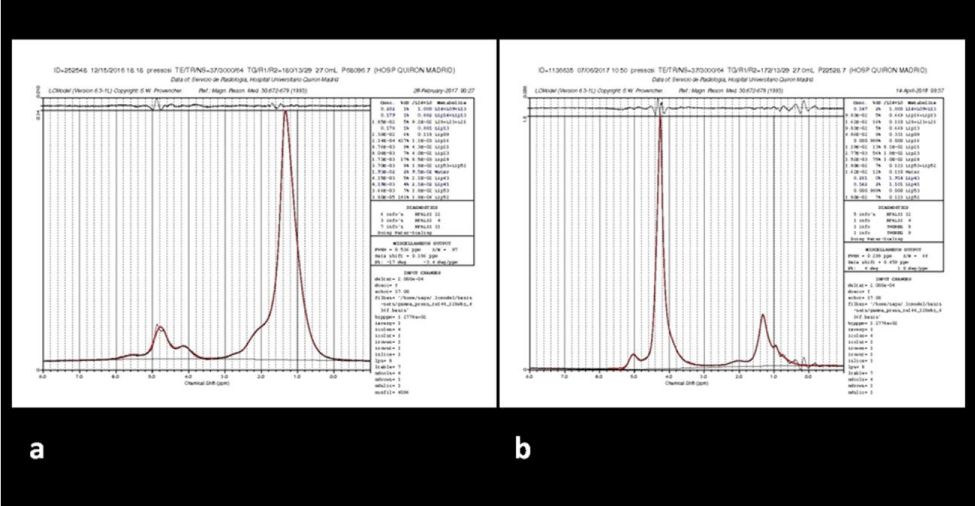
Pre- and post-treatment results were analyzed in both the non-responder group (Table 1) and the responder group (Table 2). Patients with response, increased the signal intensity in bone marrow signal on T1-weighted sequences and the corresponding IT1 values (P<0.009). The post-treatment spectra in responder patients evidence significant reduced values in the H20 /lipid CC (P <0.002) (Figure 3); patients without response either increased the value or did not modify it (Figure 4). Responders patients increased ADCm values (P <0.006).
Discussion
The follow-up of patients with CLL susceptible to chemotherapy treatment (those with active disease and adverse prognostic factors) is complicated due to the difficulty in assessing the response to treatment, the frequent absence of clinical symptomatology, and the fact that conventional imaging studies used for follow-up such as CT take longer to show changes than would be desirable. The need, on occasions, to confirm the response with the histological medullary study may delay treatments and involves invasive tests for the patient, hence the initiative to conduct this study with the aim of improving the monitoring of these patients with safe and repeatable techniques.
1H-MRS and DW-MRI sequences may identify treatment changes in the bone marrow, prior to morphological changes, even after a few weeks of chemotherapy treatment, allowing safe early monitoring of the treatment and avoiding unnecessary biopsies.
Although this is a pilot study and the sample size is limited, the found differences could indicate that 1H-MRS and DW-MRI of spinal bone marrow are non-invasive and repeatable techniques that might help in follow-up monitoring of patients with CLL.
1H-MRS adds metabolic tissue information, complementary to the structural information from the conventional MR studies. This technique provides a noninvasive means of assessing in vivo bone marrow metabolites that can shed light on cellular concentrations and therapeutic response. 1H-MRS easily can be added to routine lumbar MR with little time and cost penalty, with patients screened simultaneously.
In normal adult bone marrow, the main component is fat, with hyper-signal in the vertebral bodies on T1-weighted sequences. When there is leukemic infiltration, the aqueous content of the bone marrow is higher, decreasing the T1 signal intensity of the bone marrow [12-17], so conventional MRI sequences can sometimes be helpful.
The results of this study show significant differences in signal intensity on T1-weighted sequences, ADCm and H20/Lip CC obtained before and after treatment in patients who responded to chemotherapy, while no significant differences were found in non-responders.
In our pilot study, a significant increase in signal on T1-weighted sequences was observed, (P=0.009), in patients who respond positively to chemotherapy treatment complementing the hematology service’s evaluation of the response.
The limitation occurs when there is a lower than expected conversion of fat marrow after treatment, and therefore the signal strength value is not modified excessively. This occurs in patients with “packed” infiltration pattern where the fibrosis component predominates over fat replacement and therefore the hyper-signal in T1 sequences is lower. Indeed, a seroconversion phenomenon may also occur with an increase in healthy hematopoiesis, with a higher proportion of H2O, which will also not increase the T1 signal.
In the adult axial skeleton, when it is spectrally evaluated, two major spectral peaks can be found: that of lipids and that of H2O [18-23], with a ratio in favor of lipid concentration. In this regard, a leukemic infiltration would cause changes in the spectral curve, with an increase in the concentration of the H2O peak.
In our pilot study, it is possible to analyze the individual variation of concentrations of pre and post-treatment spectral metabolites, especially the variation of the post-treatment H2O/lipid CC. A priori, the data obtained from these analyses would confirm our working hypothesis and are in concordance with previous studies [5,6,23,24].
The most statistically significant results are the clear decrease in the H2O/lipid CC in all the responder patients.
In patients with positive response to treatment, the H2O /lipid ratio decreased (p<0.002), indirectly indicating a reduction in leukemia cells rich in H2O and an increase in the bone marrow adipocytes. In one patient with a partial (not complete) response to treatment, no significant reduction in the H2O /lipid ratio was observed, and there was even a slight increase in the H2O/Lip CC. Perhaps this fact can be explained by a phenomenon of hypercellular haematopoietic bone marrow reconversion (see below in the “study limitations” section), with an H2O content exceeding that of fat bone marrow; in this patient the partial positive response (based on the peripheral blood data) was achieved by the increase of the absolute lipid concentration and of the IT1 value.
In the four patients without response to chemotherapy treatment, absolute lipid concentrations remained low and the H2O/lipid CC did not vary statistically significant.
Changes in ADC values are widely described in the literature on musculoskeletal oncology pathology [7,8,25-30]. DW studies reveal a decrease value of the ADC in the infiltrated tumoral tissue, changing as the tumor cell volume increases.
Regarding the data obtained from the pre and post-treatment diffusion maps in our study, a statistically significant increase in the ADC value (P <0.006) was observed in all responder patients.
Diffusion as a direct marker of cellularity was clearly diminished in bone marrow with greater cellular infiltration; the drop of the ADC values was higher in the leukemic infiltrations forms called “packed patterns” of medullary biopsies, with a great level of fibrosis that does not allow the diffusion of H2O protons in the extracellular space.
In the four patients with no response, the ADC values did not show significant changes Finally, it should be noted that both techniques are harmless for the patient, with a total duration of less than 30 minutes. Both techniques are reproducible and validated in the literature, and in view of the results they could be very useful in monitoring treatment.
Study limitations
One of the limitations of the study was the acquisition of overall spectral image. It is well known that STEAM spectral sequences are better than PRESS for fat quantification in bone marrow, but we did not take into consideration absolute water or lipid values. Indeed, the comparison between the pre and post chemotherapy treatment H2O /lipid ratio was made patient by patient. Other major advantages for PRESS acquisition are that technicians are more comfortable in their daily practice with this technique.
In three of the patients evaluated, who presented a massive interstitial-packed leukemic infiltration (>90%) in the bone marrow biopsy and large fibrosis component, the suppression of H2O in the spectral acquisition was practically impossible, being this fact necessary for field homogeneity and for avoiding long acquisition times. Furthermore, it is known that resonance fibrosis presents low signal intensity on T1 weighted sequences, causing a low signal-to-noise ratio in MRI, especially in 3T magnets, where the studies were performed. Therefore, we decided to conduct the studies with a 1.5 Tesla magnet, less influenced by magnetic susceptibility and requiring less field homogeneity for spectral acquisition, thus allowing us to obtain the data.
Another limitation of the study is the phenomenon of medullary hyperplasia, which makes it difficult to interpret the results after chemotherapy treatment. It is a well-known phenomenon in oncological studies of lymphoma treatment monitoring with PET-FDG, where diffuse medullary hypermetabolism with marked glucose uptake is reflected, and in evaluation studies with spectroscopy of granulocytic colony stimulation factors in oncological or deposit diseases [31-35]. There is an increase in cellularity, generally from a cellular series, the myeloid, which metabolically translates into an increase in the H2O component of the cells, which may be a factor of confusion in the spectral curve. Fortunately, it is not usually correlated with the analytical response; nor is it accompanied by a significant decrease in lipid concentration or a decrease in pre-treatment ADC values.
Conclusion
Although a larger sample of patients will be required for validation, our results show that these radiological tools could make it easier for hematologists to monitor treatment and perhaps in the future use the data as complementary predictive factors of therapy response.
We wish to thank Peter Bonney for his support in proofreading this article.
Novelty statements
1. The combined use of the bone marrow MR-spectroscopy and diffusion in the evaluation of treatment of CLL patients.
2. The early decrease of the ratio H2O/ lipids and the increase of the apparent diffusion coefficient, in patients with good response to treatment.
3. The probably use in daily practice of these functional techniques in the follow up of CLL patients.
- Dutoit JC, Vanderkerken MA, Anthonissen J, Dochy F, Verstraete KL (2014) The diagnostic value of SE MRI and DWI of the spine in patients with monoclonal gammapathy of undetermined significance, smouldering myeloma and multiple myeloma. Eur Radiol 24: 2754– 2765. Link: https://bit.ly/2YhICvh
- Giles SL, Messiou C, Collins DJ, Morgan VA, Simpkin CJ, et al. (2014) Whole-body diffusion weighted MR imaging for assessment of treatment response in myeloma. Radiology 271: 785-794. Link: https://bit.ly/3t2ixP5
- Horger M, Weisel K, Horger W, Mroue A, Fenchel M, et al. (2011) Whole-body diffusion-weighted MRI with apparent diffusion coefficient mapping for early response monitoring in multiple myeloma: preliminary results. AJR Am J Roentgenol 196: W790- W 795. Link: https://bit.ly/2KXpK1G
- Griffith JF, Yeung DK, Chow SK, Leung JC, Leung PC (2009) Reproducibility of MR perfusion and (1) H spectroscopy of bone marrow. J Magn Reson Imaging 29: 1438-1442. Link: https://bit.ly/36cTgrl
- Schick F, Einsele H, Lutz O, Claussen CD (1996) Lipid selective MR imaging and localized 1H spectroscopy of bone marrow during therapy of leukemia. Anticancer Res 16: 1545-1552. Link: https://bit.ly/2Yf58F8
- Machann J, Stefan N, Schick F (2008) (1)H MR spectroscopy of skeletal muscle, liver and bone marrow. Eur J Radiol 67: 275-284. 139. Link: https://bit.ly/3cgt03s
- Liney GP, Bernard CP, Manton DJ, Turnbull LW, Langton CM, et al. (2007) Age, gender, and skeletal variation in bone marrow composition: a preliminary study at 3.0 Tesla. J Magn Reson Imaging 26: 787-793. Link: https://bit.ly/36fRLZs
- Costa FM, Ferreira EC, Vianna EM (2011) Diffusion weighted magnetic resonance imaging for the evaluation of musculoskeletal tumors. Magn Reson Imaging Clin N Am 19: 159-180. Link: https://bit.ly/3on374m
- Steinbach LS (2007) MRI in the Detection of Malignant Infiltration of Bone Marrow. AJR Am J Roentgenol 188: 1443-1445. Link: https://bit.ly/2M5swCk
- Karampinos D, Ruschke S, Dieckmeyer M, Diefenbach M, Franz D, et al. (2018) Quantitative MRI and Spectroscopy of Bone Marrow. J Magn Reson Imaging 47: 332–353. Link: https://bit.ly/3pmzEJ5
- Lundbom J, Bierwagen A, Bodis K, Apostolopoulou M, Szendroedi J, et al. (2019) 1H‑MRS of femoral red and yellow bone marrow fat composition and water content in healthy young men and women at 3 T. MAGMA 32: 591–597. Link: https://bit.ly/36io6yZ
- McKinstry CS, Steiner RE, Young AT, Jones L, Swirsky D, et al. (1987) Bone marrow in leukemia and aplastic anemia: MR imaging before, during, and after treatment. Radiology 162: 701–707. Link: https://bit.ly/3iO4kAz
- Kaplan PA, Asleson RJ, Klassen LW, Duggan MJ (1987) Bone marrow patterns in aplastic anemia: observations with 1.5-T MR imaging. Radiology 164: 441–444. Link: https://bit.ly/3iR3dzX
- Nöbauer I, Uffmann M (2005) Differential diagnosis of focal and diffuse neoplastic diseases of bone marrow in MRI. Eur J Radiol 55: 2-32. Link: https://bit.ly/3poutrZ
- Tall MA, Thompson AK, Vertinsky T, Palka PS (2007) MR imaging of the spinal bone marrow. Magn Reson Imaging Clin N Am 15: 175-198. Link: https://bit.ly/36iok9j
- Alyas F, Saifuddin A, Connell D (2007) MR imaging evaluation of the bone marrow and marrow infiltrative disorders of the lumbar spine. Magn Reson Imaging Clin N Am 15: 199-219. Link: https://bit.ly/3cejmhv
- Schellinger D, Lin CS, Fertikh D, Lee JS, Lauerman WC, et al. (2000) Normal lumbar vertebrae: anatomic, age, and sex variance in subjects at proton MR spectroscopy, initial experience. Radiology 215: 910-916. Link: https://bit.ly/36e5z6M
- Kugel H, Jung C, Schulte O, Heindel W (2001) Age- and sex-specific differences in the 1H-spectrum of vertebral bone marrow. J Magn Reson Imaging 13: 263-268. Link: https://bit.ly/2Ykyqlz
- Mac Ewan IJ, Glembotski NE, D’Lima D, Bae W, Masuda K, et al. (2014) Proton density water fraction as a biomarker of bone marrow cellularity: validation in ex vivo spine specimens. Magn Reson Imaging 32: 1097-1101. Link: https://bit.ly/2LZI6Qc
- Schick F, Bongers H, Jung WI, Skalej M, Lutz O, et al. (1992) Volume selective H-MRS in vertebral bodies. Magn Reson Med 26: 207-217. Link: https://bit.ly/2MwuF9W
- Singhal V, Miller KK, Torriani M, Bredella MA (2016) Short-and long-term reproducibility of marrow adipose tissue quantification by 1H-MR spectroscopy. Skeletal Radiol 45: 221-225. Link: https://bit.ly/2Ylr4hC
- Pansini V, Monnet A, Salleron J, Hardouin P, Cortet B, et al. (2014) 3 Tesla H-MR spectroscopy of hip bone marrow in a healthy population, assessment of normal fat content values and influence of age and sex. J Magn Reson Imaging 39: 369-376. Link: https://bit.ly/3oo6S9s
- Jeromel M, Podobnik J (2014) Magnetic resonance spectroscopy (MRS) of vertebral column: an additional tool for evaluation of aggressiveness of vertebral haemangioma like lesion. Radiol Oncol 48: 137-141. Link: https://bit.ly/3phurlL
- Frassica FJ, Khanna JA, McCarthy EF (2000) The role of MR imaging in soft tissue tumor evaluation: perspective of the orthopedic oncologist and musculoskeletal pathologist. Magn Reson Imaging Clin N Am 8: 915-927. Link: https://bit.ly/2YlrdSc
- Padhani AR, Koh DM, Collins DJ (2011) Whole-body diffusion-weighted MR imaging in cancer: current status and research directions. Radiology 261: 700-718. Link: https://bit.ly/39mZGGu
- Herneth AM, Friedrich K, Weidekamm C, Schibany N, Krestan C, et al. (2005) Diffusion-weighted imaging of bone marrow pathologies. Eur J Radiol 55: 74-83. Link: https://bit.ly/3a5iqJK
- Nonomura Y, Yasumoto M, Yoshimura R, Haraguchi K, Ito S, et al. (2001) Relationship between bone marrow cellularity and apparent diffusion coefficient. J Magn Reson Imaging 13: 757-760. Link: https://bit.ly/2KS5fmZ
- Padhani AR, van Ree K, Collins DJ, D’Sa S, Makris A (2013) Assessing the relation between bone marrow signal intensity and apparent diffusion coefficient in diffusion-weighted MRI. AJR Am J Roentgenol 200: 163-170. Link: https://bit.ly/3olY4B9
- Oka K, Yakushiji T, Sato H, Hirai T, Yamashita Y, et al. (2010) The value of diffusion-weighted imaging for monitoring the chemotherapeutic response of osteosarcoma: a comparison between average apparent diffusion coefficient and minimum apparent diffusion coefficient. Skeletal Radiol 39: 141-146. Link: https://bit.ly/36bvz2T
- MacKenzie JD, Gonzalez L, Hernandez A, Ruppert K, Jaramillo D (2007) Diffusion weighted and diffusion tensor imaging for pediatric musculoskeletal disorders. Pediatr Radiol 37: 781-788. Link: https://bit.ly/36gskqM
- Holinger EF, Alibzoglu H, Ali A, Green A, Lamonica G (1998) Hematopoietic cytokine mediated FDG uptake stimulates the appearance of diffuse metastatic disease on whole body PET imaging. Clin Nucl MED 23: 93-98. Link: https://bit.ly/39lUbrJ
- Scherer A, Wittsack HJ, Engelbrecht V, Schwarz S, May P, et al. (2001) Proton MR- Spectroscopy of the Lumbar Spine in Patients With Glycogen Storage Disease Type Ib. J Magn Reson Imaging 14: 757-762. Link: https://bit.ly/3sZmST4
- Altehoefer C, Bertz H, Ghanem NA, Langer M (2001) Extent and time course of morphological changes of bone marrow induced by granulocyte-colony stimulating factor as assessed by MRI of healthy blood stem cell donors. J Magn Reson Imaging 14: 141-145. Link: https://bit.ly/2M1aSjo
- Ciray I, Lindman H, Astrom GK, Wanders A, Bergh J, et al. (2003) Effect of granulocytic colony stimulating factor supported chemotherapy on MRI of normal red bone marrow in breast cancer patients with focal bone metastases. Acta Radiol 44: 472-484. Link: https://bit.ly/36foHl3
- Elmstrom RL, Tsai DE, Vergilio JA, Downs LH, Alavi A, et al. (2004) Enhanced marrow 18 FDG glucose uptake related to myeloid hyperplasia in Hodgkin`s lymphoma can simulate lymphoma involvement in marrow. Clin Lymphoma 5: 62-64. Link: https://bit.ly/3iReRuK
Article Alerts
Subscribe to our articles alerts and stay tuned.
 This work is licensed under a Creative Commons Attribution 4.0 International License.

 Save to Mendeley
