Open Journal of Environmental Biology
The Moving Trajectory Fitting Based on Three-Dimensional Digital Model of Barchan Dunes in Taklimakan Desert
Aimin Lia1* and Zhiwen Han2
2Key Laboratory of Desert and Desertification, Northwest Institute of Eco-Environment and Resources, Chinese Academy of Sciences, Lanzhou 730000, China
Cite this as
Lia A, Han Z (2021) The Moving Trajectory Fitting Based on Three-Dimensional Digital Model of Barchan Dunes in Taklimakan Desert. Open J Environ Biol 6(1): 015-025. DOI: 10.17352/ojeb.000022In the hinterlands of the Taklimakan Desert, we monitored Barchan dune evolution with the Huace X90 GNSS in RTK working mode to obtain 3D coordinates of a dune with millimeter precision. Using these coordinates, a 3D digital model of the dune was built and superimposed with CASS 9.0 and ArcGIS 10.0. Auto CAD 2010 was used to draw an arc with the three elements of starting point, end point and included angle and to fit the corresponding characteristic point trajectory curve of the eight selected typical dunes. Results of the fitting showed that the dunes rotated counterclockwise with ranges of 33°∼38°and 25.5°∼30° in the monitoring intervals between stages one and two and stages three and four, respectively. The moving trajectories were curves pointing from NE to SW and convex to NW, with long lengths. Between stages two and three, the dunes rotated clockwise with a range of 31°∼37°, and the trajectories was curves pointing from NE to SW and convex to SE or SW, with varying direction and a short length. When the northward or southward angle between effective sand-driving wind and the axial direction was larger than 30°, the dune rotated clockwise or counterclockwise, respectively. This indicates that the moving trajectory should be a curve rather than a straight line, which would result in a better fit with the actual movement of the dune. Accurately fitting the moving trajectory of Barchan dunes can assist in learning how to fit the movement of other mobile dunes as well as how to correct raw dune evolution data, such as moving distance and speed. It can also lay a foundation for the improvement of a formula for moving speed, which is important because many fields of research concern the moving speed and direction of mobile dunes.
Introduction
Barchan dunes are generally formed in areas with unidirectional or opposite winds, and are named for their planar shape resembling a crescent [1-4]. They are widely distributed in deserts all over the world, thus making their formation, development and evolution frequent study subjects for researchers of aeolian sand landforms and blown sand physics [5-8]. As mobile entities, Barchan dunes often indicate the material transportation direction on earth’s surface with the direction of its own movement [3,9]. Further, a dune’s moving velocity can also be used to estimate the quantity of sand sediment. The metrics of Barchan dunes have become important reference indices in wind and sand fixation engineering [10-12]. Although significant progress has been made in the research of dune development modes and conditions, morphological evolution, the surface air flow and eroded sedimentation, wind-sand flow structure and sediment transport rate, sedimentary structure and moving laws of sand dunes and morphological evolution [13-15], there is still no consensus on the processes of morphological evolution, moving speed, moving direction and the influential factors of Barchan dunes.
The existing literature on the moving distance and direction of sand dunes assumes that the moving trajectory is a straight line, but the actual moving trajectory of sand dunes has not been researched or analyzed enough [6,16-18]. With the formulas currently used to calculate the moving velocity of sand dunes, calculated values deviate greatly from measured values. This indicates that the formulas require additional adjustment. Fitting the Barchan dune moving trajectory accurately may provide a basis for better defining and capturing sand dune movement. It may also lay a foundation for further improvement of the formula for computing moving speeds of sand dunes.
Here, the evolution of Barchan dunes was monitored in the hinterlands of the Taklimakan Desert. We used a Huace X90 GNSS receiver in its RTK working mode to obtain 3D coordinates of the dune surface with a high temporal resolution at millimeter precision. Using geological mapping software CASS 9.0 and geographic data analysis software ArcGIS 10.0, the 3D coordinate data was processed and analyzed. The 3D digital model of dunes in the survey area was established and overlaid on a DEM, and Auto CAD 2010 was used to draw arcs with the three elements of starting point, end point and included angle, as well as to fit the corresponding characteristic point moving trajectory of the dunes. Accurately fitting the moving trajectory of Barchan dunes can provide an example for the fitting of other mobile dunes' moving trajectory, as well as clarify what raw data is necessary to calculate moving distances and velocities. It can also lay a foundation for the improvement of a formula for moving speed, which is important because many fields of research consider the moving speed and direction of mobile sand dunes.
Study area and data acquisition
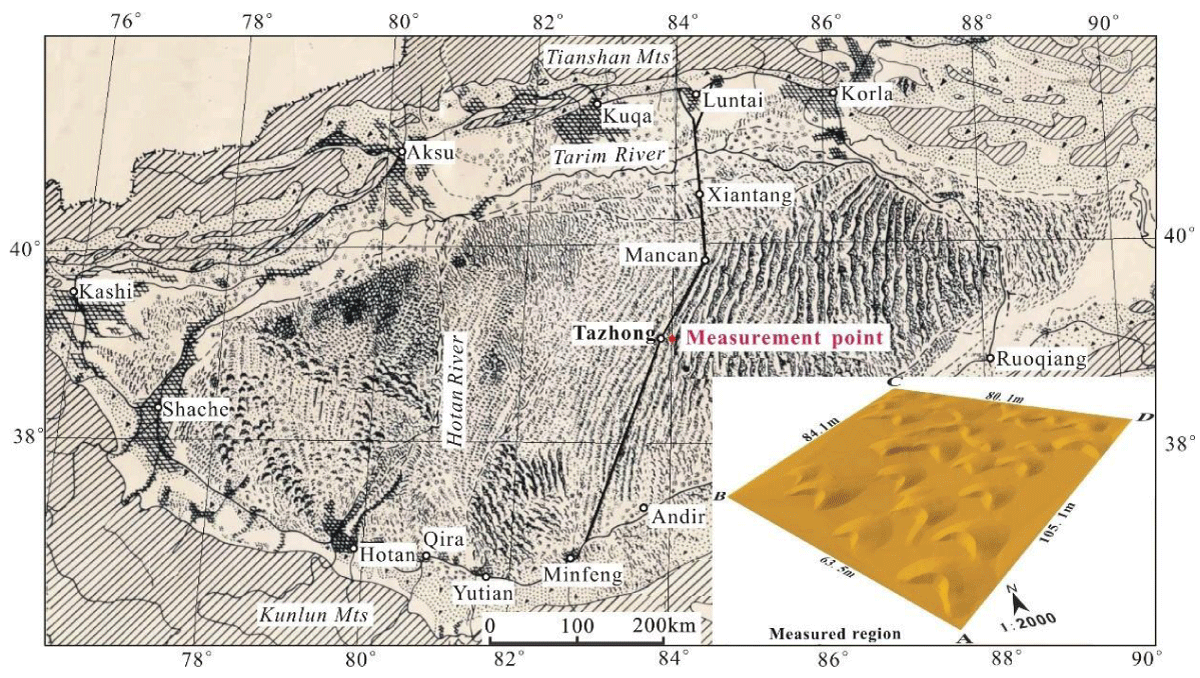
Study area: A Barchan dune evolution survey zone located among the complex longitudinal dunes to the east of Tazhong Union Station in the Taklimakan desert hinterland area (39°15′N, 83°42′E) was delineated by the quadrilateral ABCD in Figure 1 and monitored. The length of boundary lines are AB=63.5 m, BC=84.1 m, CD=80.1 m, DA=105.1 m, with an area of about 6700 m2.
Taklimakan desert has a typical temperate continental arid climate, with annual precipitation in the hinterland less than 50 mm and annual evaporation over 3000 mm. The site may be windy for up to seven months each year, with a dominant north-easterly wind and a maximum wind speed of 30 ms-1 [19-21]. In the area, tall composite longitudinal dunes and inter-dune lower lands are distributed at intervals. The longitudinal dune direction is N56°E-N50°E with a height of 60-80m, and the main dune stretches abnormally with an asymmetrical transect [22-24]. The NW slope is a sand falling slope with a gradient of about 32° and an altitude of 30∼60 m. It is comprised of overlaying secondary sand falling slopes [25]. The SE slope is gentle, with Barchan dunes overlaid on the upper part. The lower part is mainly comprised of secondary longitudinal dunes or sparse Barchan dune arrays, with a direction consistent with that of the longitudinal dunes [26,27]. The Barchan dunes or dune chains stand at 1∼3m in the 1∼2 km wide stretch of low land between the sand ridges. They have a windward slope gradient of about 11°, a sand falling slope gradient of about 32°, a trend direction of about S70°W and typical morphological development [28,29].
The survey area is located in the inter-dune area along the petroleum highway of the Taklimakan Desert. The spatial scale of Barchan dunes is relatively small, with two wings pointing downwind from the main NE wind, and the cross sections having an asymmetrical slope [14,30,31]. The mean values of the main morphological parameters of 36 Barchan dunes in the survey area were 15.289 m, 1.238 m, 7°23″ and 27°31″ for average width, height, windward slope angle and leeward slope angle, respectively. The width tends to be about 10 times the height and the dune shape is typical.
Data acquisition: In the second half of April 2015, the middle of October 2015, the first half of March 2016 and the mid-to-late period of October 2016, four monitoring sessions were carried out in the evolution monitoring zone. The 3D coordinate measurements were acquired with the Huace X90 GNSS receiver, which consists of a base station, a mobile station, a data chain and control software (Figure 2). The base station sends the differential correction data through links via a radio station to the mobile station, where data is resolved immediately to acquire high-precision spatial data regarding the position of the mobile station [26,32,33].
The RTK (real-time kinematic) working mode of the X90 GNSS receiver was chosen for the measurement of 3D coordinates. RTK is a real-time dynamic positioning technology based on carrier phase observation values, it can provide real-time 3D coordinates of the station in an appointed coordinate system at millimeter precision. In sum, it offers the advantages of high precision, easy operation and freedom from sighting limitations[34-36].
Mobile station coordinates were based on the Beijing 54 Coordinate System. The GNSS receiver was used to measure the surface coordinates of the sand dunes, and the measured coordinates were calculated based on the base station [37-39]. To ensure consistency of the starting coordinates of the base station, base station translation was necessary after it migrated or was restarted at unknown spots. In this way, the coordinates of the moving dunes measured during the monitoring period had uniform starting coordinates [29,40,41]. For coordinate measurement, the X90 GNSS receiver was first installed and set up. Then the four boundary points of the monitoring area, A, B, C and D, were determined. Point A was selected as the reference point and point B was selected as the detection point for accuracy of base station translation (Figure 1). Based on the geometric principle that a plane can be determined with three noncollinear points, the position of the survey area could be accurately identified with the base station starting point, reference point A and detection point B. The surface of the sand dunes was measured in a path along the contour line (Figure 2). The measuring points were spaced approximately 50 cm apart with the density of measurements increasing as terrain steepened.
Due to the weight of digital field books and the measurement rod, the depth at which the measurement rod penetrated the sand face could hardly be controlled during measurement. At the same time, the natural surface of the sand dune could also be slightly altered by the measurer’s trampling. All of these influences led to errors between measured and actual coordinates of each measurement point, and influenced the overall accuracy of the measurements. To reduce this measurement error as much as possible, a round rubber pad with a diameter of approximately 5 cm and a thickness of 0.5 cm was fixed to the lower end of the measurement rod to prevent it from falling into the sand’s surface. However, it was impossible to completely prevent measurement error.
Fitting the moving trajectory based on 3D digital model of Barchan dunes
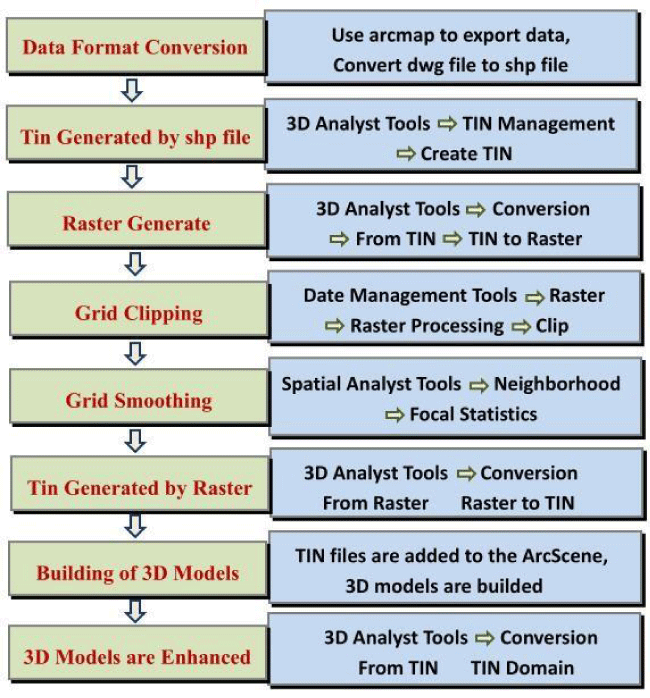
Establishment of 3D digital model of barchans dunes: The 3D coordinate data collected in the field was exported in DAT format, and CASS 9.0 was used to plot the elevation points and draw the boundary lines to create a digital elevation model (DEM). DEM, contour lines with intervals of 0.005 m throughout the entire survey area and contour intervals of 0.001 m for each single sand dune was drawn [42-44]. Then, ArcMap 10 was used to project the dune contour using the 28th projection zone in Gauss-Kruger 3° in the Beijing 54 Coordinate System [45-48]. The 3D digital model of each individual sand dune was established with specific steps, as shown in Figure 3. The establishment of the 3D digital model for the entire survey area was similar to that of the individual sand dune, but it did not require grid clipping [49-52].
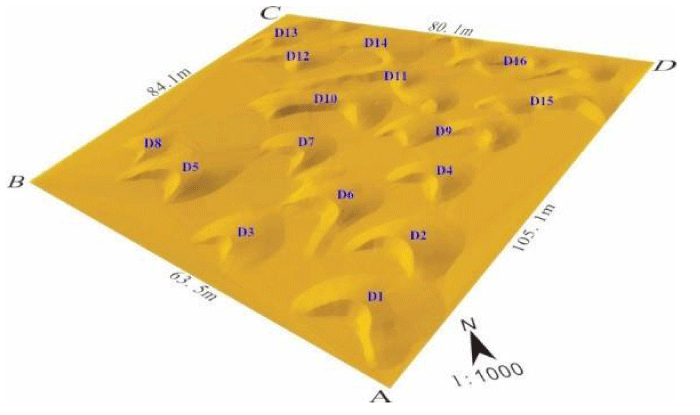
After defining the projection, the contour line in the DWG format was exported to SHP format, and a Triangular Irregular Network (TIN) was established. To further simplify the data algorithm and to prepare it for the clipping and smoothing of data, data in TIN format was converted to raster form, which can show details of elevation change and is better formatted for the analysis and processing algorithms and have simple topological relations[53-56]. The required raster data was extracted by using the existing vector data, and the focus statistics tool was used to smooth data and eliminate "noise" pixels from raster images [57-59]. After clipping and smoothing, the data was converted to TIN format and added to ArcScene10 to establish a 3D digital model of both the survey area and the individual dunes (Figure 4).
Fitting the moving trajectory of Barchan dunes
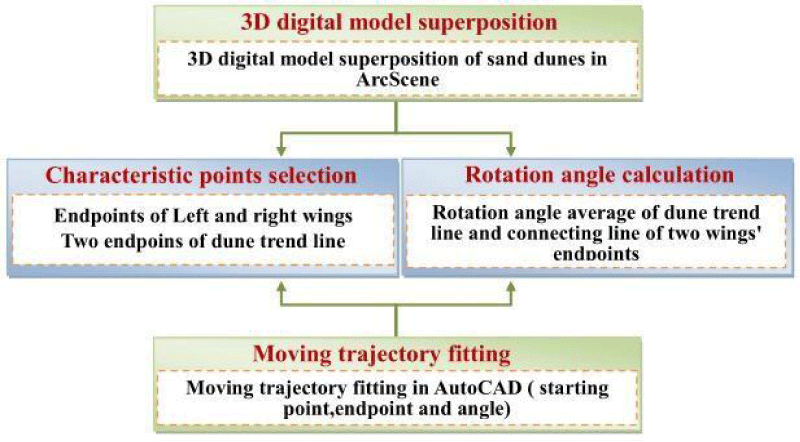
As a mobile sand dune, a Barchan dune keeps moving under the joint influences of many factors, such as wind power. In this paper, taking the typical dune D3 as an example, the fitting process of the moving trajectory was described based on the simulation and superposition analysis of 3D digital models during different measurement stages. The specific fitted technical route was shown in Figure 5.
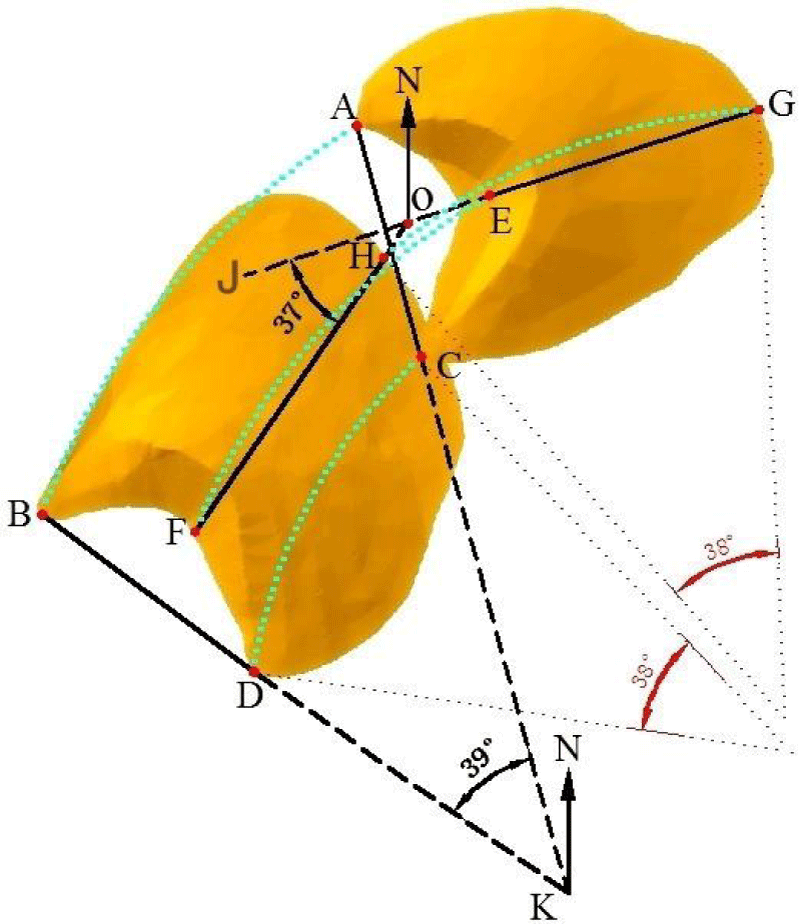
Fitting the moving trajectory between the first and second monitoring periods: Overlay analysis was conducted on 3D digital models representing typical sand dune D3 during the first and second monitoring periods. Four characteristic points, including A (front end point of left-wing), C (front end point of right-wing), G (end point of windward slope of sand dune trend line) and E (end point of leeward slope of sand dune trend line), were selected in the first digital model, and four corresponding feature points, B, D, H and F, were selected in the second digital model. Between the first and second monitoring periods, A moved to B, C moved to D, E moved to F, and G moved to H (Figure 6).
Between the monitoring periods, the trend line of Barchan dune D3 changed from GE to HF. The azimuth angle of the trend line changed from∠NOJ to∠NOF, and the counterclockwise rotation decreased by about 37°. The line between the front end points of the two wings changed from AC to BD, the azimuth angle changed from∠NKA to∠NKB, and the counterclockwise rotation decreased by about 39°. Dune D3 moved from NE to SW while it rotated counter-clockwise. Hence, any points on the dune also rotated counter-clockwise while moving forward. To unify the rotation angles of any corresponding points of D3 during the monitoring period, the mean values of 38°, 37° and 39° were selected as the rotation angles of any corresponding points. Two random corresponding points from the first and second monitoring periods of dune D3 were selected as starting and end points, and the rotation angle of corresponding points was the included angle. Taking the three elements of starting point, end point and included angle, the moving trajectory of corresponding characteristic points of the sand dune was fitted using the Auto CAD 2010 software.
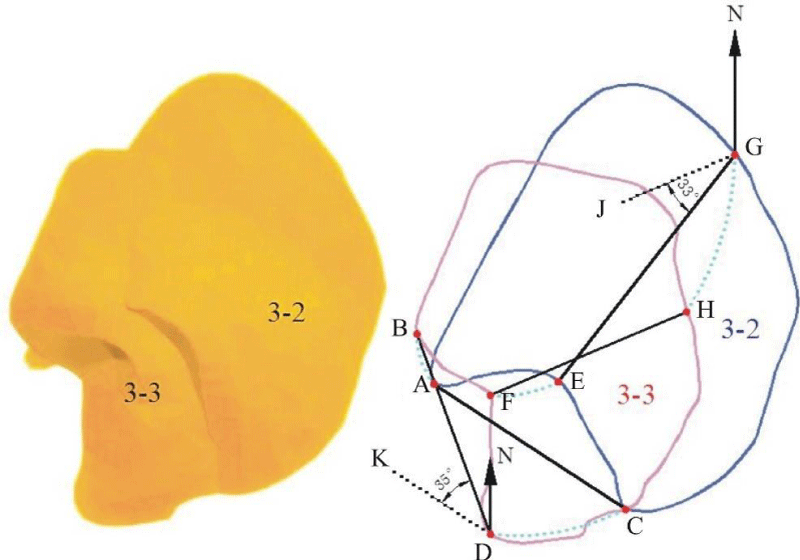
Fitting the moving trajectory between the second and third monitoring periods: Overlay results of the 3D digital model of typical sand dune D3 from the second to third monitoring periods indicated that characteristic point A moved to B, C moved to D, E moved to F and G moved to H (Figure 7). The dune trend line changed from GE to HF, the azimuth changed from∠NGE to∠NGJ (GJ//HF), and the clockwise rotation increased by about 33°. The line between the front points of the two wings changed from AC to BD, the azimuth changed from∠NDK to∠NDB, and the clockwise rotation increased by about 35° (DK//AC). To unify the rotation angles of any corresponding points of D3 between the monitoring stages, the mean values of 33° and 35° were selected as the rotation angles of any corresponding points. The corresponding point moving trajectory of D3 from the second to the third monitoring period was fitted using the above-mentioned fitting method from the first to the second period.
Fitting the moving trajectory between the third and fourth monitoring periods: Between the third and fourth monitoring periods, the superposition results of the 3D digital models of typical dune D3 showed that the characteristic point G moved to H, E to F, A to B and C to D (Figure 8). The trend line of the sand dune changed from GE to HF, the azimuth angle changed from∠NGE to∠NGJ (GJ//HF), and the counterclockwise rotation decreased by about 26°. The line between the two end points of the two wings changed from AC to BD. The azimuth angle changed from∠NDK to∠NDB (DK//AC), and the counter-clockwise rotation decreased by about 27°. To unify the rotation angles of random corresponding points on D3, the mean values of 26.5°, 26° and 27° were selected as the rotation angles of the random corresponding points. The movement trajectory of the corresponding characteristic points on D3 from the third to the fourth monitoring period was fitted according to the above-mentioned fitting methods, with the three elements of starting point, end point and included angle.
Fitting the moving trajectory of the other typical Barchan dunes: Using the method and technical route of fitting the moving trajectory of the typical Barchan dunes D3, the moving trajectory of the other seven typical Barchan dunes numbered D1, D2 and D4∼D8 in the survey area were fitted. Based on the 3D digital model of dunes which were built and superimposed with CASS 9.0 and ArcGIS 10.0, the corresponding characteristic point trajectory curves of the other seven selected typical dunes were fitted with three elements of starting point, end point and included angle in Auto CAD 2010. The characteristics of the typical sand dunes fitting moving trajectories are shown in Table 1.
Analysis of results of fitting the moving trajectory and influential factors
Analysis of results of fitting the moving trajectory: Between the first and second monitoring periods, the results of fitting the movement trajectories of corresponding characteristic points of the eight selected typical sand dunes (Figure 6, Table 1) show that the movement of corresponding characteristic points, namely, are nearly parallel. The long curves point from NE to SW, are convex to the NW, and the sand dunes move faster. The characteristic points of the Barchan dunes rotated counterclockwise while moving, with rotation angles ranged from 33° to 38°. If the sand dunes moved along straight trajectories only, they would not rotate counterclockwise and would only change positions along the straight-lines. Therefore, they can be inferred that the moving trajectories of sand dunes between the first and second monitoring periods should be curves rather than straight lines. Fitting the results along curved lines should therefore better coincide with the actual moving trajectories of the sand dunes in the survey area.
From the second to third monitoring period, the results of the fitted moving trajectory of typical dunes show that the dunes moved slowly from NE to SW during this period. The fitting curves of the four corresponding characteristic points on the surface of dunes, , were chaotic. They curved convex to SE or SW with different directions and short lengths, and the corresponding points rotated clockwise with rotation angles ranged from 31° to 37° (Figure 7, Table 1). The movement of the dunes during this period may be understood as a clockwise rotation centered at the front end of the left wing. Therefore, between the second and third monitoring period, the moving speeds of the different points on dunes varied greatly. For example, the moving speed of the right wing end point was much faster than that of the left wing end point, whose trajectory length was also shorter. Contrary to the rotation direction between the first and second monitoring periods, dunes rotated clockwise in this period. The appearance of the rotation angle of dunes indicates that the actual movement path of the Barchan dunes between the second and third monitoring periods were curves rather than straight lines.
According to the results of fitting the moving trajectory of the selected eight typical dunes between the third and fourth monitoring periods (Figure 8, Table 1), it can be inferred that the fitted curves of were almost parallel. The curves pointed from NE to SW and were convex to NW with a long length and quick moving speed. Corresponding points of the sand dunes rotated counterclockwise and decreased by about 25.5°∼30° while moving forward. At this stage, dunes rotated counterclockwise, which are the same as what happened between the first and second monitoring periods and the opposite of what occurred from the second to the third monitoring period. The occurrence of the rotation angle of the sand dunes indicates that the actual moving trajectories from the third to the fourth monitoring period should be curves rather than straight lines. Overall, fitting to curves would better coincide with the actual moving trajectories than fitting to straight lines.
Analysis of influential factors on the moving trajectory
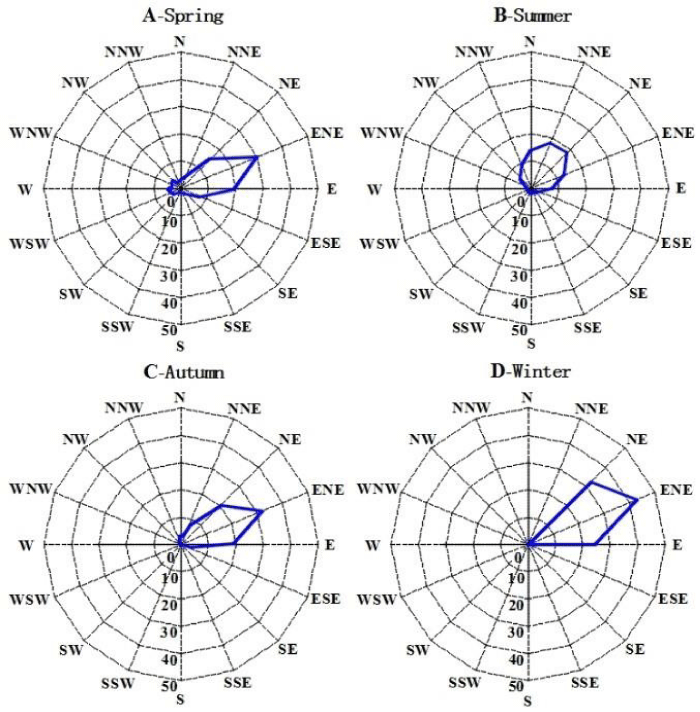
Wind regime is one dynamic factor causing the motion of Barchan dunes. The sand dune here kept rotating clockwise or counterclockwise while moving from NE to SW, which might be the main reason why the sand dune moved along a curve rather than a straight line. The total progress of the dune movement was consistent with the downwind direction of the main local sand-moving winds, which blow ENE, NE and E during all four seasons in the survey area Figure 9) [60,61].
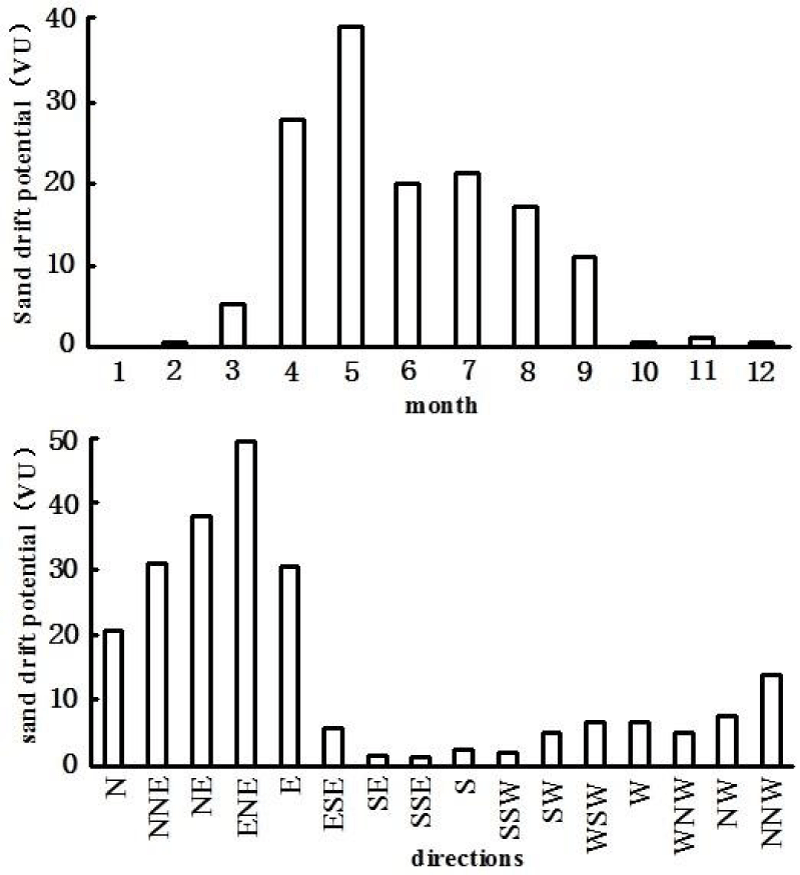
The monitoring took place from May to September (first and second) and from April to September (third and fourth) in subsequent years. The survey area was subjected to sand-moving winds from the ENE, NE and E in the spring and autumn, and from the NNE, N and NNW in the summer. The total annual average sand drift potential of effective sand-moving wind in directions NNW-E was about 189 VU, accounting for over 80% of the amount for the entire year. The annual average resultant sand-transporting potential of effective sand-moving wind was mainly centralized in the spring and summer. It was about 124VU in the spring (March to May) and 82VU in the summer (June to August). The annual average resultant sand-transporting potential from May to September and from April to September accounted for about 80% and 92% of the year totals, respectively [61,62] (Figure 10). Therefore, during the two monitoring intervals, the efficiency of effective sand-moving wind and the wind speeds were at yearly highs. The sediment-transporting capacity was strong, the wind-sand activity was frequent, and the sand dunes moved forward rapidly from NE to SW. In summer, when the declination between the effective sand-moving wind in directions NNE, N and NNW and the axial direction of the dunes was larger than 30°, the NE side of the sand dune’s windward slope became a windward front slope, and the sand strongly eroded. In this situation, the SW side of the Barchan dune became a windward back slope, and it continuously accumulated sand transported from the windward front slope. The erosion and accumulation pattern on the sand dune surface changed the lateral wing of the sand falling slope, and the sand dune rotated counterclockwise. Therefore, during the two periods, the dunes moved forward along the trajectory curve directed from NE to SW and was convex to the NW.
The interval between the second and third monitoring periods lasted from November to February. During this period, the survey area was dominated by winter monsoons. The effective sand-moving wind mainly blew in the ENE, NE and E directions. As a result, the sand-transporting potential from November to February accounted for less than 1% of the whole year (Figure 10). When the declination between the effective sand-moving wind blowing to the E and ENE and the axial direction of dune was larger than 30°, the SE side of the dune’s windward slope became a windward front slope, and the sand was greatly eroded. The NW side of the dune’s windward slope became a windward back slope and continuously accumulated sand transported from the windward front slope, so the sand dune rotated clockwise. Therefore, during this monitoring period, the sand dune moved forward slowly along a curve directed from NE to SW that was convex to SE or SW. For the sand dune moving slowly from NE to SW, it may be understood that it rotated clockwise with the front end of the dune’s left wing as the center, so the moving speed of the end point of the right wing was much greater than that of the end point of the left wing.
Discussion
Barchan dunes are mobile dunes. Their movement often indicates the material transportation direction on earth’s surface [63,64]. Additionally, a dune’s moving velocity can be used to estimate the quantity of sand sediment transported. These are important reference indicators of wind prevention and sand fixation engineering, and they are closely associated with the movement trajectory of all sand dunes [65-69]. So far, there has been little research on fitting the moving trajectories of Barchan dunes. Many past observational studies have assumed that the dunes move forward along straight lines, of which the length is measured as the moving distance [8,70,71]. However, the actual movement path of sand dunes varies in track length, moving direction and moving speed.
Based on the raw data acquired in the studies of the straight-line moving trajectory of sand dunes, the formula for the moving speed of Barchan dunes shows that the moving speed is inversely proportional to dune height and is proportional to the sand transport amount of wind-sand flow [72-75]. Using mathematical statistics, Yang Gensheng, et al. [76] also obtained a negative linear correlation between the sand dune moving speed and height. His functional expression was y=14.03-0.64h (y-moving speed (m/a), h-dune height (m)). However, if computations are made with the functional correlation obtained in previous studies, the computed values of sand dune moving speed greatly deviate from measured values. This indicates that the existing formulas for dune moving speed still require further improvement. Fitting the Barchan dune moving trajectory accurately may provide a basis for better defining and capturing sand dune movement. It may also lay a foundation for further improvement of the formula for computing moving speeds of sand dunes [77,78].
The moving direction of Barchan dunes can indicate the transport direction of surface sand material. Fitting the moving trajectory of sand dunes can provide further confirmation of the direction in which dunes move. Existing studies show that sand dunes move in a straight line from the starting (front) to ending (rear) points of the sand dune in relation to the downwind direction of synthesis wind, and that the moving direction of different points at different positions is the same along the straight-line moving trajectory. However, the results of this study indicate that the moving trajectory of Barchan dunes is a curve, rather than a straight line, due to its continuous rotation throughout the moving process. Therefore, the moving direction of a point on the dune should be the tangential direction of the point on the trajectory curve and directed in the downwind direction of the synthetic wind. The moving directions of the same point should differ at different positions along the trajectory curve.
Fitting the moving trajectories of Barchan dunes can provide an example for how to fit the moving trajectories of other mobile sand dunes. It can assist also in gathering more accurate data, such as moving distance and moving speed of mobile sand dunes. Lastly, it lays a foundation for improving the formula for moving speeds of mobile sand dunes and for future studies on other research topics concerning moving speeds and directions of mobile sand dunes.
Conclusion
In the research, an evolution survey area was established for Barchan dunes in the Taklimakan desert hinterland, and the RTK working mode of the Huace X90 GNSS receiver was used to obtain 3D coordinates of the dunes at a high temporal-spatial resolution with millimeter precision. CASS 9.0 and ArcGIS 10.0 were used to establish and superimpose 3D digital models of sand dunes in the survey area. Finally, the three elements of starting point, end point and included angle were used to fit a moving trajectory curve of corresponding characteristic points on a sand dune with the Auto CAD 2010 software. The results of fitting showed that the sand dunes in the survey area moved along curves rather than straight lines, and they also displayed evidence of significant seasonal features.
Wind regime is a dynamic factor causing the motion of Barchan dunes. Barchan dunes move along curves rather than straight lines mainly because the dunes continuously rotate either clockwise or counterclockwise while moving forward from NE to SW.
Wind-sand activities were frequent during the intervals between the first and second monitoring periods, as well as between the third and fourth monitoring periods. The effective sand-moving wind was mainly determined by winds in NNW-E directions with strong sand transport capacity, and sand dunes moved forward rapidly from NE to SW. The declination was larger than 30° between the effective sand-moving wind in directions NNE, N and NNW and the axial line of the sand dune, which led to the counterclockwise rotation of the dune. This is the main reason why the moving path of the sand dune was a curve directed from NE to SW and convex to NW, rather than a straight line.
During the interval between the second and third monitoring periods, the wind frequency of the effective sand-driving wind in directions ENE, NE and E was small, and the sand transport capacity was weak. The declination between the effective sand-moving wind in directions E and ENE and the axial line of the sand dune was larger than 30°, which led to the clockwise rotation of the dune. This was the main reason why the moving path of the sand dune was a curve directed from NE to SW and convex to either the SE or SW, rather than a straight line. Because the sand dune moved slowly from NE to SW, it could be understood that it rotated clockwise, with the front end point of the left wing as the center, so that the moving speed of the end point of the right wing of the sand dune moved much faster than the end point of the left wing.
Fitting the Barchan dune moving trajectory accurately may provide a basis for better defining and capturing sand dune movement. It may also lay a foundation for further improvement of the formula for computing moving speeds of sand dunes, as well as for other future research concerning mobile sand dunes.
CRediT authorship contribution statement
Aimin Li: Data curation, Formal analysis, Funding acquisition,Investigation, Methodology, Software, Validation, Visualization,Writing - original draft, Writing - review & editing. Zhiwen Han: Conceptualization, Formal analysis, Funding acquisition, Investigation, Methodology, Project administration, Resources,Supervision, Validation, Visualization, Writing - original draft, Writing - review & editing.
This work was financially supported by the National Natural Science Foundation of China (41371025), Doctor Foundation of Heze University (XY19BS04) and Teaching Reform Project of Heze University (2018233).
The authors also would like to express their sincere thanks to Rui Wang and Mengchen Chen, who was admitted to the University of Chinese Academy of Sciences in 2014. Both have participated in the surveying work of sand dune topography in the hinterlands of the Taklimakan Desert.
- Boxel JHV, Arens SM, Dijk PM (1999) Aeolian processes across transverse dunes. I: modeling the airflow. Earth Surface Processes and Landforms 24: 255-270. Link: https://bit.ly/3ziSZ2C
- Hersen P (2004) On the crescentic shape of barchan Dunes. European Physical Journal B 37: 507-514. Link: https://bit.ly/3muVKuh
- Daniell JJ, Hughes M (2007) The morphology of barchan-shaped sand banks from western Torres Strait, northern Australia. Sedimentary Geology 202: 638-652. Link: https://bit.ly/3khNmeW
- Bourke MC (2010) Barchan dune asymmetry: Observations from Mars and Earth. Icarus 205: 183-197. Link: https://bit.ly/3Da0ATL
- Li HP, Chen GT (1999) Retrograde evolution of barchan on interdune corridor of complex ridges in central Taklimakan Desert. Journal of Desert Research 19: 134-138. Link: https://bit.ly/3khNqLI
- Faria R, Ferreira AD, Sismeiro JL, Mendes JCF, Sousa ACM (2011) Wind tunnel and computational study of the stoss slope effect on the Aeolian erosion of transverse sand dunes. Aeolian Research 3: 303-314. Link: https://bit.ly/2UNBBnS
- Dansie AP, Wiggs GFS, Thomas DSG, et al. (2017) Measurements of windblown dust characteristics and ocean fertilization potential: The ephemeral river valleys of Namibia. Aeolian Research 29: 30-41. Link: https://bit.ly/3zgWWoG
- Belrhiti HE, Douady S (2011) Equilibrium versus disequilibrium of barchan dunes. Geomorphology 125: 558-568. Link: https://bit.ly/3jdqq0V
- Belrhiti HE, Douady S (2011) Equilibrium versus disequilibrium of barchan dunes. Geomorphology 125: 558-568. Link: https://bit.ly/3jdqq0V
- Gay SP (1999) Observation regarding the movement of barchan sand dunes in the Nazca to Tanaca area of southern Peru. Geomorphology 27: 279-293. Link: https://bit.ly/2XWFp7t
- Dong ZB, Qian GQ, Lu P, Luo W, Wang H (2009) Turbulence fields in the lee of two-dimensional transverse dunes simulated in a wind tunnel. Earth Surface Processes and Landforms 34: 204-216. Link: https://bit.ly/38cpMuw
- Parteli EJR, Durán O, Bourke MC, Tsoar H, Pöschel T, et al. (2014) Origins of barchan dune asymmetry: Insights from numerical simulations. Aeolian Research 12: 121-133. Link: https://bit.ly/2UJRCuT
- Frank A, Kocurek G (1996) Airflow up the stoss slop of sand dune: limitation of current understanding. Geomorphology 17: 47-56. Link: https://bit.ly/3DcYulY
- Elbelrhiti H, Claudin P, Andreotti B (2005) Fielde vidence for surface-wave-induced instability of sand dunes. Nature 437:720-723. Link: https://bit.ly/3B4YuT2
- Smith AB, Jackson DWT, Cooper JAG (2017) Three-dimensional airflow and sediment transport patterns over barchan dunes. Geomorphology 278: 28-42. Link: https://bit.ly/3msiLOB
- Howard AD, Morton JB, Gad EHM (1978) Sand transport model of barchan dune equilibrium. Sedimentology 25: 307-338.
- Junaidi Aoki S (2009) Wind-Blown sand and topographic changes of the coastal dune at the eroded beach. Journal of Coastal Research, SS56 (part1): 322-326. Link: https://bit.ly/3Dg2Vww
- Wang JP, Liu LY, Shen LL (2013) Research of the barchan dunes movement in the Mu Us sandy land on Google Earth Software. Remote Sensing Technology and Application 28: 1094-1100.
- Wang ZT, Zhang JW, Zhang QH, Qiang M, Chen F, et al. (2008) Barchans of Minqin: sediment transport. Geomorphology 96: 233-238. Link: https://bit.ly/3kpPotl
- Dong YX, Huang DQ (2014) Typical research on the movement and topographic change of coastal crescent dune. Scientia Geographica Sinica 34: 863-869. Link: https://bit.ly/3gs1BMX
- Li AM, Han ZW, Zhong S, Caiyun G (2018) Attributive parameter extraction of the barchan dune based on CASS and ArcGIS. Journal of Desert Research 38: 484-491. Link: https://bit.ly/3mtAc1d
- Dong ZB, Wang XM, Chen GT (2000) Monitoring sand dune advance in the Taklimakan Desert. Geomorphology 35: 219-231. https://bit.ly/3Bc6thc
- Bo TL, Zheng XJ (2011) The formation and evolution of aeolian dune fields under unidirectional wind. Geomorphology 134: 408-416. Link: https://bit.ly/2WeZm9b
- Han ZW, Du HQ, Gou QQ, Sun JH (2012) The piecewise fitting of sand flux vertical distribution of wind-sand flow winthin 100-cm height above the barchan dune surface. Scientia Geographica Sinica 32: 892-897. Link: https://bit.ly/3ziTk5o
- Wu X, Zou X, Zheng Z C, Zhang CL (2011) Field measurement and scaled-down wind-tunnel model measurement of airflow field over a barchan dune. Journal of Arid Environments 75: 438-445. Link: https://bit.ly/3jdCC1K
- Zhu Z D, Chen Z P, Wu Z (1981) The Study on aeolian geomorphology in Taklimakan. Beijing: Science Press. (in Chinese)
- Wiggs GFS (2001) Desert dune processes and dynamics. Progress in Physical Geography 25: 53-59. Link: https://bit.ly/3kk8YYd
- Wu Z (1987) Aeolian geomorphology. Beijing: Science Press, 101–110. (in Chinese)
- Li AM, Han ZW (2020) Relationship between moving speed and morphological parameters of barchan dunes. Journal of Desert Research 40: 29-40. Link: https://bit.ly/3sIzePy
- Sauermann G, Rognon P, Poliakov A, Herrmann HJ (2000) The shape of the barchan dunes of Southern Morocco. Geomorphology 36: 47-62. Link: https://bit.ly/3gytraq
- Weaver CM, Wiggs GFS (2011) Field measurements of mean and turbulent airflow over a barchan sand dune. Geomorphology 128: 32-41. Link: https://bit.ly/38bX7Wq
- Xiao F, Zhang B P, Ling F, Luo J, Wang N (2008) DEM based auto-extraction of geomorphic units. Geographical Research 27: 459-466. Link: https://go.nature.com/3yfTZTS
- Yang N, Su L L, Wan L, Jie Y, Shi-yi C, et al. (2016) A method for building 3D models of barchan dunes. Geomorphology 253: 181-188. Link: https://bit.ly/3Baj0BX
- Huang DQ, Dong YX, Hasi, Ma J (2007) The Application of multi-station RTKGPS in the measurement of coastal Dune. Acta entiarum Naturalium Universitatis 46: 121-124. Link: https://bit.ly/2WgsBrH
- Pelletier JD (2008) Quantitative modeling of earth surface processes. Cambridge Town: Camridgee University Press. Link: https://bit.ly/3jfQXed
- Tang GA, Yang X (2012) ArcGIS geographic information system spatial analysis experiment course. Beijing: Science Press.
- Du HQ, Han ZW, Deng XH (2011) A sand flux model for the surface of barchan dunes using GIS-based spatial analysis. Journal of Desert Research 31: 815-823.
- Jackson D, Cruz A N, Smyth T, Hernández-Calvento L (2013) 3D airflow modelling and dune migration patterns in an arid coastal dune field. Journal of Coastal Research SI 65: 1301-1306. Link: https://bit.ly/3B8PrAH
- Cong DG, Pang HL, Fang M (2014) Dunes distribution study on north of Tengery Desert based on remote sensing and DEM. China Mining Magazine 23: 153-159.
- Han ZZ, Han RD, Mao SJ (2007) Research and application on integration modeling of 3D bodies coal mine with blended data model based on TIN and ARTP. Journal of Coal Science & Engineering 13: 276-280.
- Chen YH, Tong X (2010) Modeling screening efficiency with vibrational parameters based on DEM 3D simulation. Mining Science & Technology 20: 615-620. Link: https://bit.ly/3kqj1La
- Song XM, Zhang JY, Zhan CS, Jiufu L (2013) Advances in digital watershed features extracting based on DEM. Progress Geography 32: 31-40. Link: https://bit.ly/3zbiHpT
- Wang C, Li H, Yang J S (2015) Study on generation technique of high quality contour lines based on grid DEM. Journal of Geo-Information Science 17: 160-165.
- Hu ZH, Peng JW, Hou YL, Shan J (2017) Evaluation of recently released open global digital elevation models of Hubei, China. Remote Sensing 9: 262. Link: https://bit.ly/2Wnsiv4
- Yan L, Yang LH (2009) Based on delaunay triangulation DEM of terrain model. Computer and Information Science 2: 137. Link: https://bit.ly/2Wkcp8P
- Puente I, González JH, Martínez SJ, Arias P (2013) Review of mobile mapping and surveying technologies. Measurement 46: 2127-2145. Link: https://bit.ly/3gwoJdo
- Qi R, Qi M, Li K (2014) The research on the method of 3D terrain generation based on the digital terrain map. Electronic Design Engineering 22: 191-193.
- Silva JSN, Chamone FC, Ferreira RC, Nascimento ER (2018) A 3D modeling methodology based on a concavity-aware geometric test to create 3D textured coarse models from concept art and orthographic projections. Computers & Graphics 76: 73-83. Link: https://bit.ly/3B8Po7Z
- Katsuki A, Nishimori H, Endo N, Taniguchi K (2004) Collision dynamics of two barchan dunes simulated by a simple model. Journal of the Physical Society of Japan 74: 538-541. Link: https://bit.ly/3zizo2C
- Zhang Y, Jin BS, Zhong WQ, Ren B, Xiao R (2009) DEM simulation of particle mixing in flat-bottom spout-fluid bed. Chemical Engineering Research & Design 88: 751-771. Link: https://bit.ly/3zgXnzk
- Díaz VL, Lagüela S, Armesto J, Arias P (2014) Indoor daylight simulation performed on automatically generated as-built 3D models. Energy and Buildings 68: 54-62. Link: https://bit.ly/3Dj9Kgu
- Queteschiner D, Lichtenegger T, Pirker S, Schneiderbauer S (2018) Multi-level coarse-grain model of the DEM. Powder Technology 338: 614-624. Link: https://bit.ly/3jbViPE
- Endo N, Taniguchi K, Katsuki A (2004) Observation of the whole process of interaction between barchans by flume experiments. Geophysical Research Letters 31: 5321-5329. Link: https://bit.ly/2WkcsBx
- Yuan ZL, Zhang JX, Zhang ZP (2006) Research and application of DEM technology in land use visualization. Science of Surveying and Mapping 31: 119-120.
- Delgado FI, Davidson AR, Ollerhead J (2009) Application of a remote sensing technique to the study of coastal dunes. Journal of Coastal Research 25: 1160-1167. Link: https://bit.ly/3gxNw0F
- Samavati F, Runions A (2016) Interactive 3D content modeling for digital earth. Visual Computer 32: 1293-1309. Link: https://bit.ly/3zkgdWf
- Lu GN, Qian YD, Chen ZG (1998) Automated Extration of The Characteristics of topography from grid digital elevation data. Acta Geographica Sinica 53: 562-569.
- Ruiz AJA, Tovar PJ, Pozo VD, Alsamamra H (2009) A Comparative analysis of DEM-based models to estimate the solar radiation in Mountainous Terrain. International Journal of Geographical Information Science 23: 1049-1076. Link: https://bit.ly/2UJkAuS
- Tang GA, Li FY, Liu XJ (2010) Digital elevation mode course. Science Press: Beijing. (in Chinese)
- Tsoar H, Parteli EJR (2016) Bidirectional winds, barchan dune asymmetry and formation of seif dunes from Barchans: A discussion. Environmental Earth Sciences 75: 1237. Link: https://bit.ly/3sKLuz0
- Zhou CL, Zhong XJ, Zhang SM (2017) The comparison of precipitation and wind-blown sand environment over the hinterland of Taklamakan desert with its surrounding regions. Journal of Arid Land Resources and Environment 31: 117-122.
- Rubin DM (1984) Factors determining desert dune type. Nature 309: 91-92.
- Käln HW, Adelaide CRT (1988) Formation and age of desert dunes in the Lake Eyre depocentres in Central Australia. Geologische Rundschau 77: 815-834. Link: https://bit.ly/3jh9rv0
- Baddock MC, Livingstone I, Wiggs GFS (2007) The geomorphological significance of airflowpatterns in transverse dune interdunes. Geomorphology 87: 322-336. Link: https://bit.ly/3mxvGia
- Gómez OD, Martín CT, Rodríguez I, Sánchez MJ, Montoya I (2009) The internal structure of modern barchan dunes of the Ebro River Delta (Spain) from ground penetrating radar. Journal of Applied Geophysics 68: 159-170. Link: https://bit.ly/3yhePCz
- Li ZZ (1994) A Comprehensive review on progress in study of barchan dune. Arid Land Geography 17: 81-87.
- Durán Q, Schwämmle V, Lind PG (2009) The dune size distribution and scaling relations of barchan dune fields. Granular Matter 11: 7-11. Link: https://bit.ly/3ye2tuP
- Dinieg S, Glasner K, Byrne S (2010) Long-time evolution of models of aeolian sand dune fields: Influence of dune formation and collision. Geomorphology 121: 55-68. Link: https://bit.ly/3gvNnLn
- Elbelrhiti H (2012) Initiation and early development of barchan dunes: A case study of the moroccan atlantic sahara desert. Geomorphology 138: 181-188. Link: https://bit.ly/3ziTFVI
- Borowka RK (1980) Present day dune processes and dune morphology on the Leba Barrier, Polish coast of the Baltic. Geografiska Annaler Series A Physical Geography 62: 75-82. Link: https://bit.ly/3kquKcy
- Barchyn TE, Hugenholtz CH (2012) A process-based hypothesis for the barchan–parabolic transformation and implications for dune activity modelling. Earth Surface Processes and Landforms 37: 1456-1462. Link: https://bit.ly/2WrwTwJ
- Lancaster N, Nickling WG, McKenna NCK, Wyatt VE (1996) Sediment flux and airflow on the stoss slope of a barchans dune. Geomorphology 17: 55-62. Link: https://bit.ly/2WnnJS2
- Kocurek G, Ewing RC (2005) Aeolian dune field self-organization-implications for the formation of simple versus complex dune-field patterns. Geomorphology 72: 94-105. Link: https://bit.ly/3gwo1wO
- Yao ZY, Wang T, Han ZW, Zhang W, Zhao AG (2007) Migration of sand dunes on the northern alxa plateau, inner mongolia, China. Journal of Arid Environments 70: 80-93. Link: https://bit.ly/3zg1lbj
- Yang YY, Liu LY, Qu ZQ, Zhang GM (2014) A review of barchan dunes. Scientia Geographica Sinica 34: 76-83. Link: https://bit.ly/3mw3gFh
- Yang GS, Ta WQ (1996) The theoretial equation for rate of sand drift on active dune surface. Journal of Arid Land Resources and Environment 10: 50-54.
- Sauermann G, Andrade JS, Maia LP, Costa UMS, Araújo AD (2003) Wind velocity and sand transport on a barchan dune. Geomorphology 54: 245-255. Link: https://bit.ly/38giNk0
- Yao ZY, Wang T, Han ZW, Zhang W, Zhao AG (2007) Migration of sand dunes on the northern alxa plateau, inner mongolia, China. Journal of Arid Environments 70: 80-93. Link: https://bit.ly/3zg1lbj

Article Alerts
Subscribe to our articles alerts and stay tuned.
 This work is licensed under a Creative Commons Attribution 4.0 International License.


 Save to Mendeley
