Annals of Systems Biology
The effect of age and material on the deterioration of chlorine separation in the water supply network using the qualitative-hydraulic model EPANET (II)
Maryam Siamaki1, Omid Zabihi1, Reza Aghlmand2 and Mohammad Gheibi2*
2Department of Civil Engineering, Ferdowsi University of Mashhad, Mashhad, Iran
Cite this as
Siamaki M, Zabihi O, Aghlmand R, Gheibi M (2021) The effect of age and material on the deterioration of chlorine separation in the water supply network using the qualitative-hydraulic model EPANET (II). Ann Syst Biol 4(1): 031-035. DOI: 10.17352/asb.000015Copyright
© 2021 Siamaki M, et al. This is an open-access article distributed under the terms of the Creative Commons Attribution License, which permits unrestricted use, distribution, and reproduction in any medium, provided the original author and source are credited.According to international and domestic standards, the concentration of free chlorine remaining in each node must be between certain values. In this way, the health of the water is guaranteed. Water sources are chlorinated after treatment and enter the water distribution network. Injected chlorine is reduced in this path by reacting with materials in the water (mass deterioration) and the distribution network pipe wall (wall decay). Meanwhile, wall deterioration is a function of the age and material of the pipe. This study evaluated the pipe material parameter among the group of PVC and cast iron pipes. Also, to investigate the effect of age, the amount of residual free chlorine distribution in cast iron pipes with ages of zero, 10, 20, and 30 years was qualitatively hydraulically simulated. A comparison study showed that the maximum difference in free chlorine concentration in different genera is 17.82% and at different ages is 34.71%.
Introduction
The free chlorine remaining in the water supply networks guarantees the quality and health standards of drinking water. However, it should be noted that this factor does not exist in equal parts in all parts of the network and has fluctuations. In some parts of the network, the amount of chlorine is too much and produces taste and smell, and in other parts of the network, the amount is less than the allowable limit, leading to an increased risk of epidemics of microbial diseases. The phenomenon of free chlorine reduction in water supply networks is referred to as chlorine decay. Several factors and reactions such as the presence of soluble and suspended organic matter, iron, manganese, and ammonia mineral compounds, as well as various microorganisms and algae compounds, lead to changes and reduction of free chlorine concentration in the water supply network. Chlorine degradation in two general cases, mass degradation, and wall degradation lead to a decrease in free chlorine concentration along with the water supply network. Mass decay is a function of the temperature and matrix of materials in the fluid, while the deterioration of the wall depends on the age and material of the pipe. Qualls and Johnson [1] and Dominguez, et al. [2] investigated the reaction between chlorine and organic compounds in water. In this study, fluoric acid was used for the experimental simulation of organic matter in water and groundwater, respectively. The results of the study by Qualls and Johnson [1] showed that the reaction lasts only five minutes, which reacts quickly and then slowly in the first minute. Hence, for the first time, the rates of rapid and slow decay for the chlorine reaction were separated. Haas and Karra [3] considered water as a complex matrix and analyzed, studied, and evaluated the traditional behavior of chlorine with all materials in this matrix. The study is considered as one of the pioneers in this field, because it led to the creation of five practical models in the field of chlorine mass degradation. The accuracy of the models obtained in this basic research was confirmed by other researchers in the following years. Gravman, et al. [4] also researched chlorine mass degradation. The results of these experiments showed that chlorine, in reaction with organic matter in water, usually follows first-degree reactions. Wable, et al. [5] compared the rate of chlorine decay in tubes and glass. The results of their research showed that the rate of chlorine decay in the tube is several times the same in the glass. In another study, Hunt, et al. [6] and McGrath, et al. [7] studied the rate of chlorine degradation in the water supply network. In addition, the research of Clark, et al. [8] showed that the amount of chlorine remaining during the day varies and in different places of the water supply network depends on the flow path and retention time of water in the network. Rossman, et al. [9] studied chlorine decay with a mass transfer approach across the network. The researchers in this study stated that the rate of chlorine deterioration in the mass and wall of the pipes follows the first degree. Cordoba [10] used four-year quality information and data to predict the quality parameters of the water distribution system in Czech Republic. He used the multiple regression method and EPANET qualitative model to predict. Georgescu and Georgescu [11] calculated chlorine degradation in an urban distribution network with a population of 50,000. In this study, it was found that the reaction of chlorine in the fluid mass and the wall of the pipes follow the first degree. The results of this study showed that the rate of chlorine degradation in the network is proportional to the flow rate and consumption in the network. This research also intends to evaluate and investigate the effect of age and pipe material on chlorine wall decay in the water supply network using qualitative-hydraulic simulations.
Materials and methods
The network understudy
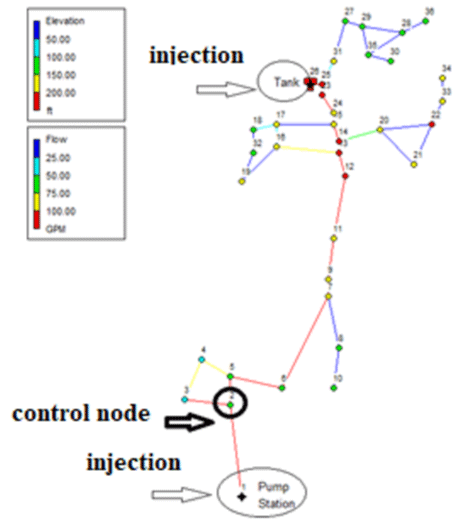
The network required for the study in this study, the Brains-Polynes network with 36 nodes, a mixture, and a pumping station is described in Figure 1. It is worth mentioning that the maximum height code in this network is related to the mixture with a height of 70.5 meters and the minimum height is related to node number (1) with 15.01 meters.
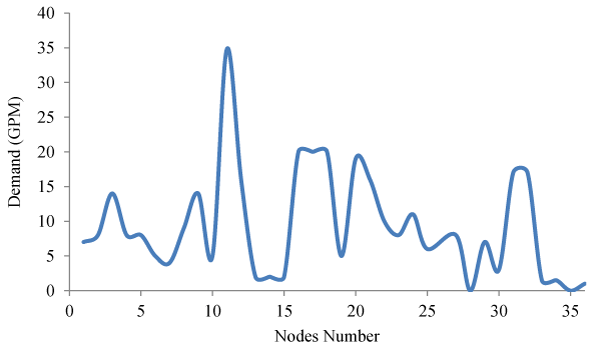
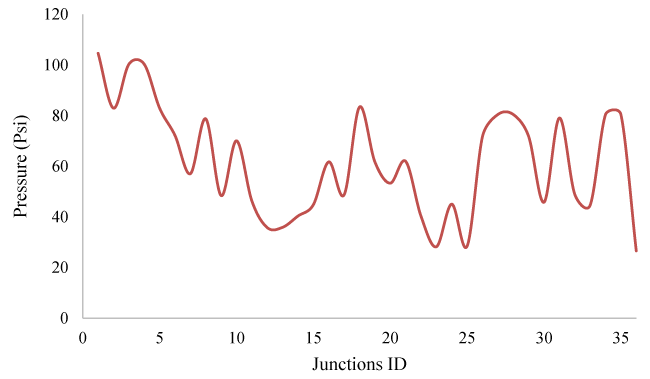
In this part of the study, for each node, Demand Assignment operations have been performed according to Figure 2. The studied network has pressure fluctuations overtime during the consumption pattern, which is shown in Figure 3.
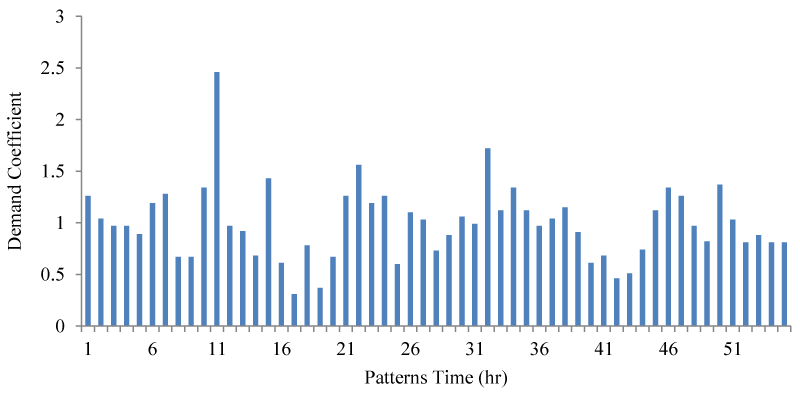
Finally, it should be noted that in the process of qualitative-hydraulic simulation of this network, the value of mass degradation coefficients is constant and is considered equal to zero, respectively. The consumption pattern of the mentioned network is also shown in Figure 4.
Qualitative-hydraulic simulation
The reaction between chlorine and the pipe wall of the distribution and water transmission network, which leads to a decrease in chlorine concentration, refers to wall decay. As can be seen in relation to number (1), there is a direct relationship between application level (surface to volume ratio), mass transfer coefficient (KW), and chlorine wall decay rate.
Many researchers [12,13] have emphasized that the degree of wall decay reaction is primary.
In relation to number (2), the parameters kw, kf and R represent the wall reaction coefficient (dependent on the pipe material), the mass transfer coefficient, and the pipe radius, respectively. The mass transfer coefficient (kf) is a function of the ratio of the diffusion coefficient of chlorine particles ( ) to the diameter of the tube (d) and the dimensionless number of Sherwood (Sh); The Sherwood number is also calculated for slow flow ( ) according to Equation (3).
It is worth mentioning that the mentioned qualitative-hydraulic simulations will be performed in the environment of the EPANET (II) model. To observe the changes in the concentration of free chlorine remaining in the time series, node (2) was selected as the control node. Also, the qualitative behavior of all nodes at peak consumption was examined.
It is worth mentioning that the mentioned qualitative-hydraulic simulations will be performed in the environment of the EPANET (II) model. To observe the changes in the concentration of free chlorine remaining in the time series, node (2) was selected as the control node. Also, the qualitative behavior of all nodes at peak consumption was examined.
Age and material of pipes
In this part of the study, the effect of age and material of distribution network pipes on chlorine wall decay will be evaluated. In the first step, the analysis of the network with PVC and cast iron materials will be evaluated, the characteristics of their wall degradation coefficient are stated in Table 1.
In this section, the effect of different ages of cast iron pipes in the water supply network will be examined; The details of their coefficients are presented in Table 2.
Results and discussion
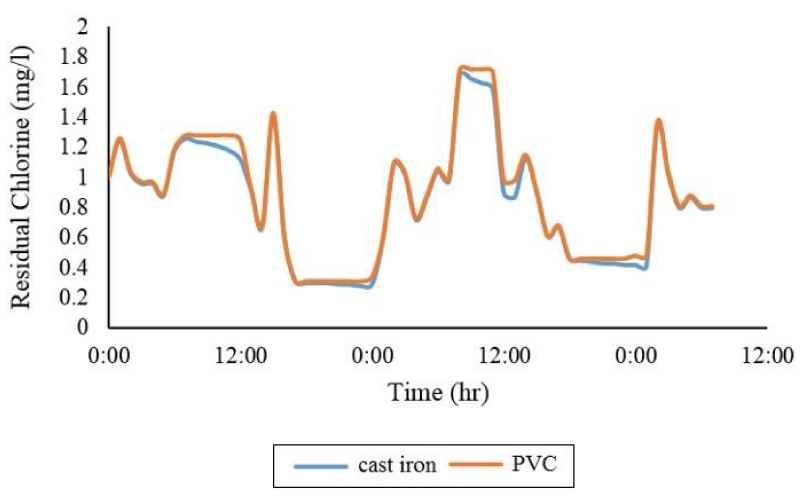
As shown in Figure 5, PVC pipes have less deficiency than cast iron pipes. Statistical analysis shows that in the time series, you can have the maximum consumption pattern of this difference between cast iron and PVC in the control node (node number (2)) equal to 14.7%.
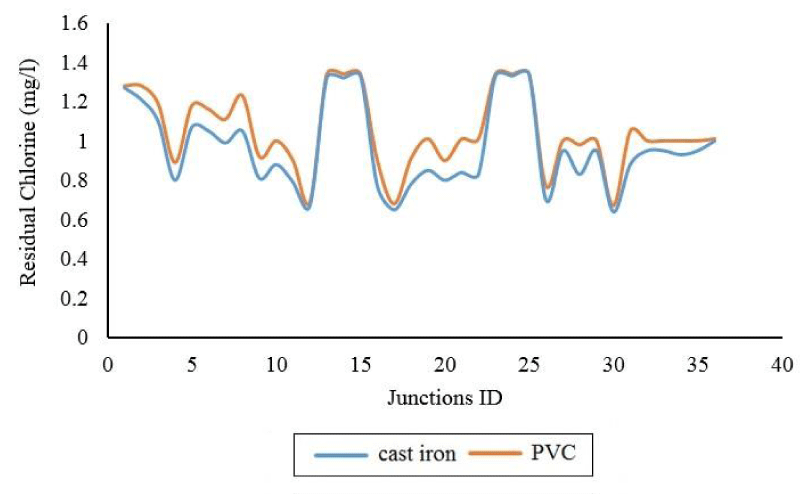
The values of the difference in the concentration of free chlorine remaining in the various nodes of the Brains-Polynes network (at peak consumption) are shown in Figure 6. The maximum difference values between cast iron and PVC are related to node number (22) with a value of 17.82%.
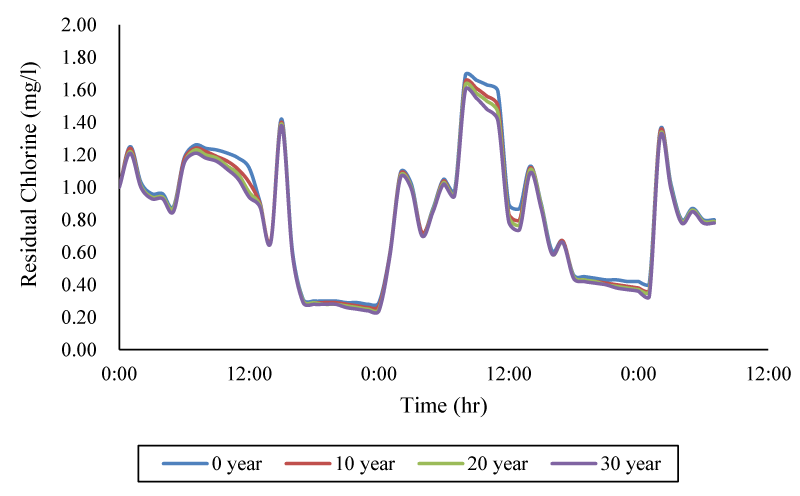
Then, the effect of age of cast iron pipes on the decay of chlorine wall was evaluated, which is described in Figure 7. Examination of the time series of consumption pattern in the control node showed that the maximum difference in free chlorine concentration between the newest and oldest cast iron pipe is 19.5%.
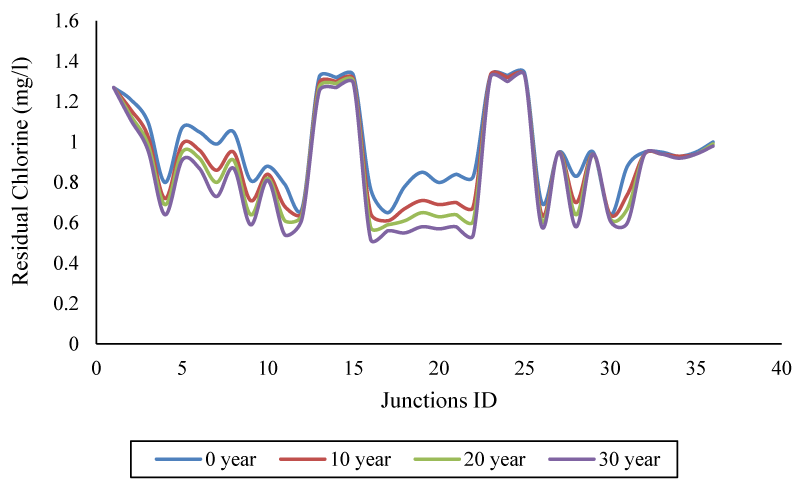
Also, the results showed the difference in the concentration of free chlorine remaining in different nodes (at peak consumption); In the case of maximum node number (22), there is a 34.71% distance between the newest and the oldest pipe. All these differences are presented as the concentration gap under the influence of tube age in Figure 8.
Comparison of the percentage difference between the age and material of the pipe shows that the age of the pipe has a greater effect on the decay of chlorine wall than its material. Some studies have recommended a specific type of pipe material. For example, in Learbuch, et al. [14] research, PVC has shown better performance than other pipe materials in the water distribution network. These studies have also been performed about other materials of pipes; for example, copper and composite plastic in a pilot-scale water distribution network has been examined, and chlorine has decreased the microbial numbers successfully in the water of composite plastic pipes [15,16]. When comparing to previous studies, the influence of pipe material has been tested on the occurrence and persistence of the target microorganisms that comparing iron, cement, and PVC pipe materials in different ages were fed either chlorinated water, and the influence of pipe material and age of pipes have become apparent to low disinfectant residual [5,17,18-25].
All statistical evaluations are done by descriptive models.
Conclusion
The free chlorine remaining in the water supply networks ensures the microbial and to some extent chemical quality of the water. Therefore, predicting and investigating the factors affecting chlorine degradation is of special importance. Chlorine mass decay occurs within the water matrix and is a function of temperature and constituents in the water. This is while the deterioration of the wall is a function of the age and material of the pipe. In the first step, this study investigated and evaluated the effect of cast iron and PVC pipes on chlorine wall deterioration and showed; In the conditions of maximum difference of chlorine concentration between these genera reaches 17.82%. Next, we simulated the effect of pipe age in the cast iron sample. The results of this section also showed a maximum difference of 34.71% of the remaining chlorine concentration between the newest (zero years) and the oldest (30 years) age of the tube. Finally, the simultaneous study and comparison of the effects of age and material indicate the greater importance of pipe age in chlorine wall decay.
- Qualls RG, Johnson JD (1983) Bioassay and dose measurement in UV disinfection. Appl Environ Microbiol 45: 872-877. Link: https://bit.ly/3BMhx51
- Dominguez CM, Romero A, Lorenzo D, Santos A (2020) Thermally activated persulfate for the chemical oxidation of chlorinated organic compounds in groundwater. Journal Environmental Management 261: 110240. Link: https://bit.ly/3jP89Yr
- Haas CN, Karra SB (1984) Kinetics of wastewater chlorine demand exertion. Journal Water Pollution Control Federation 56: 170-173. Link: https://bit.ly/3tiISc9
- Grayman WM, Clark RM (1993) Using computer models to determine the effect of storage on water quality. Journal‐American Water Works Association 85: 67-77. Link: https://bit.ly/3h5OL7K
- Wable O, Dumoutier N, Duguet JP, Jarrige PA, Gelas G, et al. (1991) Modeling chlorine concentrations in a network and applications to Paris distribution network. Proc. Water Quality Modeling in Distribution Systems. AWWA Research Foundation, US EPA, Cincinnati, OH.
- Hunt WA, Kroon JR (1991) Model calibration for chlorine residuals in distribution systems. In Proc., Water Quality Modeling in Distribution Systems Conf.
- McGrath J, Maleki M, Bouchard C, Pelletier G, Rodriguez MJ (2021) Bulk and pipe wall chlorine degradation kinetics in three water distribution systems. Urban Water Journal 18: 512-521. Link: https://bit.ly/3l38l5s
- Clark RM, Grayman WM, Males RM, Hess AF (1993) Modeling contaminant propagation in drinking-water distribution systems. Journal of Environmental Engineering 119: 349-364. Link: https://bit.ly/3tiOgMc
- Rossman LA, Clark RM, Grayman WM (1994) Modeling chlorine residuals in drinking-water distribution systems. Journal of Environmental Engineering 120: 803-820. Link: https://bit.ly/3h8E7wM
- Cuesta Cordoba IGA (2011) Using of artificial neural network for evaluation and prediction of some drinking water quality parameters within a water distribution system. Water Management and Water Structures 3: 1-11.
- Georgescu AM, Georgescu SC (2012) Chlorine concentration decay in the water distribution system of a town with 50000 inhabitants. University" Politehnica" Of Bucharest Scientific Bulletin, Series D: Mechanical Engineering 74: 103-114. Link: https://bit.ly/3kYz3fM
- Hallam NB, West JR, Forster CF, Powell JC, Spencer I (2002) The decay of chlorine associated with the pipe wall in water distribution systems. Water Res 36: 3479-3488. Link: https://bit.ly/3yQipnh
- Mutoti G, Dietz JD, Arevalo J, Taylor JS (2007) Combined chlorine dissipation: Pipe material, water quality, and hydraulic effects. Journal‐American Water Works Association 99: 96-106 . Link: https://bit.ly/2YCDrcV
- Learbuch KLG, Smidt H, van der Wielen PWJJ (2021) Influence of pipe materials on the microbial community in unchlorinated drinking water and biofilm. Water Research 194: 116922. Link: https://bit.ly/3jOTNXX
- Trinh QT, Bal Krishna KC, Salih A, Listowski A, Sathasivan A (2020) Biofilm growth on PVC and HDPE pipes impacts chlorine stability in the recycled water. Journal of Environmental Chemical Engineering 8: 104476. Link: https://bit.ly/3tlN62G
- Lehtola MJ, Miettinen IT, Lampola T, Hirvonen A, Vartiainen T, Martikainen PJ (2005) Pipeline materials modify the effectiveness of disinfectants in drinking water distribution systems. Water Research 39: 1962-1971. Link: https://bit.ly/3zPAzag
- Wang H (2013) “Critical Factors Controlling Regrowth of Opportunistic Pathogens in premise plumbing” , ph.D. Thesis, Virginia Polytechnic Institute and State University, Virginia Tech Blacksburg, US. Link: https://bit.ly/3BQ8iky
- Li M, Liu Z, Chen Y, Hai Y (2016) Characteristics of iron corrosion scales and water quality variations in drinking water distribution systems of different pipe materials. Water Research 106: 593-603. Link: https://bit.ly/3h56hZC
- Al-Jasser AO (2007) Chlorine decay in drinking-water transmission and distribution systems: Pipe service age effect. Water Res 41: 387-396. Link: https://bit.ly/38MC5hq
- AWWA Water Quality Division Disinfection Systems Committee (2000) Committee Report: Disinfection at small systems. Journal‐American Water Works Association 92: 24-31.
- Coulson JM, Richardson JF (1964) Chemical Engineering, second edition, Pergamon Press, Oxford 3. Link: https://bit.ly/38Je7U3
- Kurek W, Ostfeld A (2013) Multi-objective optimization of water quality, pumps operation, and storage sizing of water distribution systems. J Environ Manage 115: 189–197. Link: https://bit.ly/3n6LsAX
- Ostfeld A, Salomons E (2014) Optimal disinfection of water distribution networks following a contamination event. Procedia Engineering 89: 168-172. Link: https://bit.ly/2WYJW8J
- Sarbatly RH, Krishnaiah D (2007) Free chlorine residual content within the drinking water distribution system. International Journal of Physical Sciences 2: 196-201 . Link: https://bit.ly/3zUeZS2
- US EPA (2006) A water security handbook: Planning for and responding to drinking water contamination threats and incidents, Washington, D.C. Link: https://bit.ly/3n6Lnx9
Article Alerts
Subscribe to our articles alerts and stay tuned.
 This work is licensed under a Creative Commons Attribution 4.0 International License.

 Save to Mendeley
