Annals of Environmental Science and Toxicology
Smartening the movement path of municipal garbage trucks using genetic algorithm with emphasis on economic-environmental indicators
Nasim Ghadami1, Bita Deravian2, Hossein Pouresmaeil3, Reza Aghlmand4 and Mohammad Gheibi4*
2Department of Civil, Water and Environmental Engineering, Shahid Beheshti University, Tehran, Iran
3Department of Environmental Engineering, University of Tehran, Iran
4Department of Civil Engineering, Ferdowsi University of Mashhad, Iran
Cite this as
Ghadami N, Deravian B, Pouresmaeil H, Aghlmand R, Gheibi M (2021) Smartening the movement path of municipal garbage trucks using genetic algorithm with emphasis on economic-environmental indicators. Ann Environ Sci Toxicol 5(1): 080-085. DOI: 10.17352/aest.000041The collection is one of the most important steps in waste management, accounting for 60% of total costs. Therefore, a little improvement in collection operations can have a significant impact on total cost savings. On the other hand, the traffic of heavy vehicles collecting waste causes the air pollution spread and the passages pavement damage in case of excessive loading. Therefore, the issue of vehicle route determining to achieve this goal is very important. This study simulated the routing process of garbage trucks using random routing problems and genetic algorithms. The simulation results showed that the genetic algorithm converges to the optimal response in the 2069th generation and according to the convergence graph, in the 1000th generation onwards, the slope of the graph decreases. On the other hand, the amount of cost function is reduced from 11775.4909 to 1589.6028 by optimizing mentioned model, and the performance result has led to the emergence of the shortest possible path. With the help of the algorithm, all the management parameters of sustainable development, including reducing air pollution, reducing street pavement destruction, and energy (fuel) consumption are achieved. Finally, by integrating ArcGIS software, the output of the algorithm was matched to the map.
Introduction
The need (demand) to change is the most important natural need of a man in history, promoted along with intellectual and cultural development and social and scientific promotion. This need to change also increased and world civilization owes a human need for change [1]. In fact, this natural human tendency to change and evolve is the source of social, cultural, and political changes. And this sense of perfectionism shows in public areas and topics such as issues related to municipal waste management [2]. The main steps of the waste management process include 6 steps: 1) waste generation, 2) handling, separation, storage, and processing at the source, 3) Collection, 4) separation, processing, the transformation of waste, 5) Transport, 6) Disposal [3]. According to the inevitability of waste generation or waste by humans, the attention to control and regulate (organizing) is a national duty.
In this regard, at the first place should have attention to how to collect large amounts of dust and at a later stage to consider the issue of recycling. Waste collection is actually an attempt to reduce entropy (disorder). The various components of municipal waste are scattered at great distances, and the role of the collector is to collect these materials in one place [4]. In Iran (like many other parts of the world) waste collection systems are person/truck systems. With very few exceptions, municipal solid waste collection is collected in all parts of the world by men traveling around the city by truck. The collected waste is transported to the landfill. This can be a final disposal site or a temporary station where waste is dumped into larger containers, trailers, ships, or railroad cars at closer distances and then transported to a landfill, compost site, or recycling plant [4].
A large part of the cost of municipal waste collection is related to the collection phase (about 60%). Therefore, efforts to optimize this process and improve it began many years ago [5]. Providing car routing solutions to improve the routes taken by waste collection and transportation vehicles can help reduce costs in managing municipal services. Correct planning for the proper use of resources can definitely avoid creating additional costs and ultimately increase the effectiveness and efficiency of waste management. So far, several great investigations and research projects had been carried out to determine and optimize the traffic route of waste collection machines (using different methods). Mahdavi and coworkers (2010) used a meta-heuristic algorithm based on a hybrid annealing simulation method to route vehicles and determined the number of machines needed to collect municipal waste in an area of Tehran [1].
Mehdi et al. (2011) also evaluated and optimized the process of collecting and transporting municipal waste using the Geographic Information System (GIS) [6]. Ghaffari, et al. (2012) solved the waste collection problem in Marvdasht city of Fars province by the time window method [7]. In another study, Babaei Mirkalaei investigated the arc routing problem by considering the service time window and the range of vehicles in the topic of municipal waste collection [8]. Gohari, et al. (2016), in addition, used the simulated annealing algorithm to solve the problem of routing waste collection vehicles with multiple unloading and loading [9].
Paying attention to the pavement type of transit path is another important criterion in examining and determining the garbage trucks' movement direction, which may cause serious damage to the pavement of roads by overloading. Much research has been done on the issue of heavy vehicle traffic and its effects on the pavement; Among them, we can mention the study of Jalali, et al. (2012) on the impacts of heavy vehicles on the breakdown of suburban roads [10]. In another study, Abtahi, et al. (2010) designed a mathematical model for estimating the pavement life of roads and bridges under different loads in different seasons of the year, as well as a penalty model for overloaded trucks. Ziari, et al. (2004) also investigated the effects of axis failure with different loads on three types of road pavement with strong, medium, and weak stress [11].
Salem (2008) investigated the garbage collection vehicles movements impacts on road pavement. Soares et al. (2008) designed a computational model to predict the effects of different loads on road pavements. The present study, considering the three criteria of fuel consumption, air pollution, and pavement damage, determines and optimizes the movement path of the garbage truck in a specific area of Mashhad with the help of a combination of genetic algorithms and ArcGIS software.
Material and methods
Determining the route of a garbage truck in its assigned area is called micro-routing and determining the route of the device for transporting garbage to the disposal site is called macro routing. The methods, limitations, and conditions of these two issues are different. The purpose of routing is to find the shortest path and in fact the path with zero repetition [4]. It can be said that all the proposed models are based on Euler’s Tour and the Chinese Postman Problem Qwan. Mathematical models such as time window and meta-heuristic processes, geographical models, and the use of various algorithms such as neural networks.
Of course, it should be noted that in order to adapt the output of the model to reality and increase its efficiency, in some cases, sensory routing (based on logic and human experience) is used or thus modifications are made to the path provided by the model.
However, the present study is considering the criteria of distance (which can be considered equivalent to fuel consumption and of course the volume of air pollution caused by it), type of device (affecting fuel consumption and pollution), and pavement of the surveyed areas, and is trying to find a route with minimal fuel consumption, air pollution production, and pavement damage while serving all parts of the zone. This study tries to use a genetic algorithm to hit this goal.
Genetic algorithm
Genetic algorithm is one of the random search algorithms whose idea is derived from nature and has many applications in solving optimization problems. In nature, better generations emerge from a combination of better chromosomes. In the meantime, sometimes there are mutations in the chromosomes that may improve the next generation. Genetic algorithms also use this idea to solve problems. In fact, two things happen to chromosomes at the same time. The first event is a Mutation; This means that some genes are randomly changed. Another thing that happens, and of course this happens much more often than "mutation", is that two chromosomes stick together in length and exchange some pieces between two chromosomes which is known as the Crossover. In fact, genetic algorithms use Darwin's principles of natural selection to find the optimal formula for predicting or matching patterns. Genetic algorithms are often a good choice for regression-based prediction techniques.
Modelling and algorithm definitions
Daily, a large number of heavy vehicle traffic (more than the permitted capacity of road pavement) in urban thoroughfares is related to garbage collection vehicles. These intra-urban displacements lead to effects on the urban environment. These effects each form one of the functions of the model and include the following:
1- Creating air pollution due to fuel consumption (function of distance) F1
2- Consuming energy resources and consequently loss of economic costs F2
3- Damaging caused by loading cars on the pavement of streets F3.
This research seeks to model the movement of garbage collection vehicles and determine the known movement paths (determination of movement path) based on the type of garbage truck (W1i truck weight) and the load collected (W2i) behind it to optimize the movement path. Defined functions in the algorithm are as follows: Cost function (1) which is a function of car weight and load (F1). In this function, the weight of the truck is displayed based on its type (attached in section 2-3 types of vehicles and their weights) with W1i and the amount of load on the back of garbage trucks W2i (Equation 1).
But we must note that each pavement has a certain amount of tolerable resistance, which WTi must be less than that. So according to Equation (2) we have:
The cost function (2) is the function of controlling the amount of air pollution (F2). The air pollutants studied are nitrogen dioxide, sulfur dioxide, and carbon monoxide suspended particles (NO2, SO2, CO, PM10, PM2.5). For car I, the amount of gas production (mg / m3) of nitrogen dioxide with A, sulfur dioxide with B, PM2.5 with C, PM10 with D, and carbon monoxide with E are displayed; And the distance traveled is also denoted by L (Equation 3).
Cost function (3) or gasoline consumption reduction function (F3) where Mi is the amount of gasoline consumed by the car i per km (Equation 4).
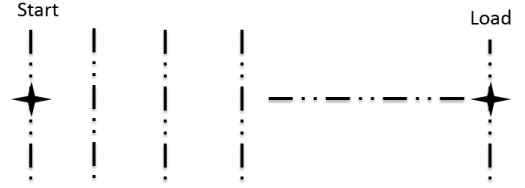
The route of trucks at specific distances according to the instructions in Figure 1 is shown in the diagrams.
The objective function, which is the final and general function for evaluating all the previously defined cost functions, determines the value of each path according to the same importance coefficients. Therefore, the coefficients of cost functions importance 1 to 3 are equal to the values of W1 = 33%, W2 = 33% and finally W3 = 33%.
Cost Function = W1F1+W2F2+W3F3
Wi: The weight of each function (5)
The form of the above function is to convert a multi-objective function to a single-objective function. But in this case, or paying attention to the available data as well as the alignment of the needs of the problem became a goal and we can say that ultimately the real goal function in this problem is a function of distance. (Real Cost Function = f (Distance)).
The genetic algorithm was also defined according to the instructions and based on the assumptions set out in this section. In the definition of the algorithm, the Crossover coefficient was equal to 0.7 (Cross-over Rate = 0.7) and the Mutation coefficient was considered equal to 0.001 (Mutation Rate = 0.001).
Pavement is a structure placed on the last compacted layer of existing or modified natural soil, embankments, earthen, or stony rock-cut, generally called sub-grade. Pavement usually consists of different layers such as Sub-base, base, and layers of asphalt or concrete or a combination of them, each of which is subject to technical specifications and has a certain thickness. Natural ground, bedrock prepared embankments, earthen or stony rock-cut, even in perfectly dense and well-grained conditions, do not have sufficient resistance to tolerate the car wheels loads in various weather conditions. Loading of such soils causes shear failure and over permanent deformation for them. The pavement prevents the occurrence of the above damages and provides easy, fast, safe, secure, and dust-free passage on a smooth surface [12].
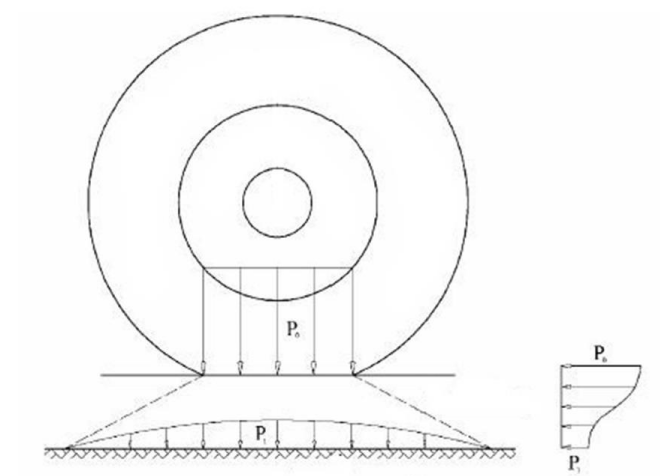
The general operation and load distribution of flexible pavements are shown in Figure 2. According to the figure, the vehicle load is applied to the pavement surface by the wheel at the almost circular contact surface. The thickness of pavement layers and their resistance quality are selected so that the wheel load is distributed and spread as much as possible, to reduce the maximum stress intensity on the sub-grade to a lower pressure than the bed soil can tolerate the allowable deformation [12].
Every year, a significant budget is spent on the construction and maintenance of road networks, and therefore it is necessary to be careful in the use and protection of expensive asphalt layers. These loads reduced pavement life and the road was destroyed before the end of expected service life. Early damage caused additional and unforeseen costs and inconsistencies with the planned schedule and budgets allocated for maintenance [11]. This creates many problems in macro-management issues. In examining the sensitivity of pavement to different types of loads in case of different loads, many regulations tables were examined. The most important ones in this study are Tables 1 to 5.
Results and discussion
According to the framework defined in Section 2, the view of the route and the mandatory points of the route are as shown in Figure 3. This figure shows the path of the truck from the starting point to the end and the final disposal point (landfill). Some points are also defined as mandatory points (service points). The values presented above and below the points are the values of the node weight in different surveys.
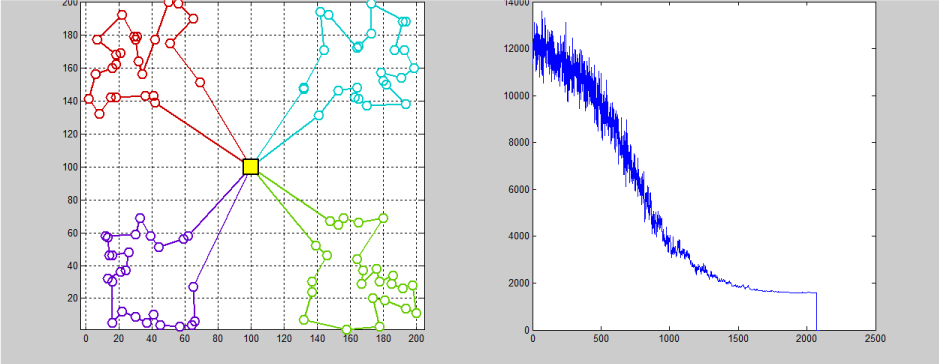
The result and operation of the GA algorithm, as can be seen in Figure 4, is to continue the process of the algorithm until the desired convergence is achieved. The corresponding genetic algorithm converges to the optimal solution in the 2069th generation (Figure 4). According to the convergence diagram, in the 1000th generation onwards, the slope of the diagram decreases; This means that the limits of the final answer in this generation are becoming more optimal.
The response evaluation index is one of the most important performance parameters of the algorithm which is based on experiments, and Equation (6) has been selected to evaluate the responses.
Termination
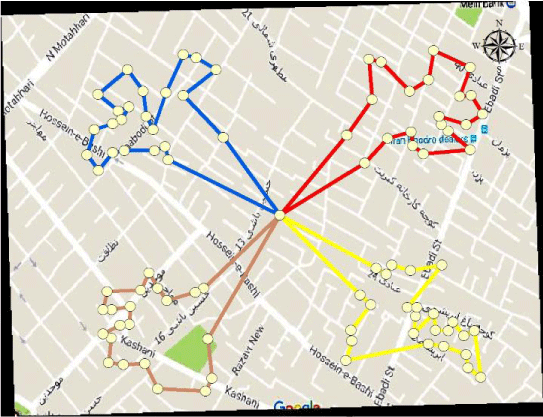
By optimizing the model, the value of the cost function was reduced from 11775.4909 to 1589.6028. The functional result of this model has led to the emergence of the shortest possible path. In fact, with the help of the created codes connected with the online GPS software, the desired routes can be identified and strategic. With the help of the algorithm, all the management parameters of sustainable development, including reducing air pollution, reducing pavement destruction of streets, and energy and fuel consumption are achieved. By combining the output of the algorithm and the GIS system, the selected points of the algorithm were matched on the map (Figure 5).
Applying the newly determined path and the obtained mandatory points can provide all the objectives of the research. Applying this method to optimize routes designated for municipal waste collection by reducing economic-environmental costs can be a direct factor in sustainable urban development.
Conclusion
The waste generation that inevitably occurs by all city dwellers; On the one hand, and the rapid development of population and urban areas, on the other hand, has made urban waste management one of the biggest concerns of city managers and municipalities. The first step in waste management, which is done directly by the management entity, is a collection. This stage of waste management, which accounts for 60% of the process costs, can make great changes in costs of this sector by correct management, and using new optimization methods. This study uses a combination of genetic algorithm and geographic information system (GIS) and considering the three criteria of fuel consumption, air pollution production, and pavement damage (which are the main negative effects of this stage) to determine and optimize the track of garbage trucks. The corresponding genetic algorithm converged to the optimal answer in the 2069th generation; And by optimizing the model, the value of the cost function was reduced from 11775.4909 to 1589.6028. The performance of the model led to the shortest possible path. In fact, with the help of the algorithm, all the management parameters of sustainable development, including reducing air pollution, reducing the destruction of street pavement, and energy and fuel consumption are achieved. Finally, by combining the output of the algorithm and the GIS system, the selected points of the algorithm were matched on the map.
- Kamarehie B, Jafari A, Ghaderpoori M, Azimi F, Faridan M, et al. (2020) Qualitative and quantitative analysis of municipal solid waste in Iran for implementation of best waste management practice: a systematic review and meta-analysis. Environmental Science and Pollution Research 1-13. Link: https://bit.ly/3wYAPlP
- Gholamheidar T, Masoud F, Ali A, Masoomeh V, Rouhollah N, et al. (2014) Review of hospital waste management in Iran. Int Res J Appl Basic Sci 8: 649-655. Link: https://bit.ly/3qrw5mc
- Moghadam MA, Mokhtarani N, Mokhtarani B (2009) Municipal solid waste management in Rasht City, Iran. Waste Manag 29: 485-489. Link: https://bit.ly/3qtXHHb
- Rupani PF, Delarestaghi RM, Abbaspour M, Rupani MM, El-Mesery HS, et al. (2019) Current status and future perspectives of solid waste management in Iran: a critical overview of Iranian metropolitan cities. Environ Sci Pollut Res Int 26: 32777-32789. Link: https://bit.ly/3jjnYGK
- Farzadkia M, Jorfi S, Akbari H, Ghasemi M (2012) Evaluation of dry solid waste recycling from municipal solid waste: case of Mashhad city, Iran. Waste Manag Res 30: 106-112. Link: https://bit.ly/2T7u3vk
- Saberifar R, Sadeghi Hesar H (2018) Investigating the Role of Social, Cultural and Physical Factors in the Establishment of Urban Waste Collection Stations (Case Study: Mashhad City). Journal of Urban Social Geography 5: 33-48. Link: https://bit.ly/3h54KlD
- Noori R, Abdoli MA, Ghasrodashti AA, Jalili Ghazizade M (2009) Prediction of municipal solid waste generation with combination of support vector machine and principal component analysis: a case study of Mashhad. Environmental Progress & Sustainable Energy: An Official Publication of the American Institute of Chemical Engineers 28: 249-258. Link: https://bit.ly/35XIWTy
- Beliën J, De Boeck L, Van Ackere J (2014) Municipal solid waste collection and management problems: a literature review. Transportation Science 48: 78-102. Link: https://bit.ly/2U2KaKT
- Han H, Ponce Cueto E (2015) Waste collection vehicle routing problem: literature review. PROMET-Traffic & Transportation 27: 345-358. Link: https://bit.ly/3jfz3bL
- Sulemana A, Donkor EA, Forkuo EK, Oduro-Kwarteng S (2018) Optimal routing of solid waste collection trucks: a review of methods. Journal of Engineering. Link: https://bit.ly/3y8J13d
- Beliën J, De Boeck L, Van Ackere J (2011) Municipal solid waste collection problems: a literature review. Link: https://bit.ly/35Sm9sn
- Mahar A, Malik RN, Qadir A, Ahmed T, Khan Z, et al. (2007) Review and analysis of current solid waste management situation in urban areas of Pakistan. In Proceedings of the international conference on sustainable solid waste management. Citeseer 8: 36. Link: https://bit.ly/35WKCgl
Article Alerts
Subscribe to our articles alerts and stay tuned.
 This work is licensed under a Creative Commons Attribution 4.0 International License.


 Save to Mendeley
