Open Journal of Bioinformatics and Biostatistics
Quantitative Structure-Activity Relationship (QSAR) study of a series of 2-thioarylalkyl benzimidazole derivatives by The Density Functional Theory (DFT)
Digré Ekozias Béké1, Mawa Koné1* and Fatogoma Diarrasouba2
2Laboratory of Thermodynamics and Physico-Chemistry of the Environment (LTPCM), UFR_SFA, University Nangui Abrogoua 02 BP 801 Abidjan 02, Côte d’Ivoire
Cite this as
Béké DE, Koné M, Diarrasouba F (2021) Quantitative Structure-Activity Relationship (QSAR) study of a series of 2-thioarylalkyl benzimidazole derivatives by The Density Functional Theory (DFT). Open J Bioinform Biostat 5(1): 001-007. DOI: 10.17352/ojbb.000009In this work, we used the quantum density theory (DFT), B3LYP / 6-311G (d, p) to establish a QSAR (Quantitative Structure Activity Relationships) model on a series of molecules derived from 2-thioarylalkyl-1H -Benzimidazole. This model is built with molecular descriptors and anthelmintic activities against the haemonchus contortus. The statistical indicators of this model are: the coefficient of determination R2, a standard deviation S, the Fisher coefficient F and the cross-validation coefficient Q2cv. The statistical parameters of the model are efficient.
The quantum descriptors responsible for the anthelmintic activity of 2-thioarylalkyl-1H-Benzimidazole derivatives are the dipole moment (μ), the energy of the highest occupied orbital (EHOMO), the smallest negative charge of the molecule (q-).
The acceptance criterion of Eriksson et al. used for the test series is verified. For the external validation, the values of the ratio of theoretical activity and experimental activity tends to unity.
Introduction
Livestock are an important source of income in developing countries and contribute to food security. In addition in Africa, it often intervenes in the gross domestic product to the tune of 10% to 20% [1]. Livestock farming in most of the African tropics is exposed to a number of factors which slow down its development, including animal diseases [2].
Among these diseases, gastrointestinal strongyliasis in cattle breeding is one of the main pathologies which causes enormous economic losses for the farmer [1].
The fight against infectious diseases remains a public health problem, which is explained by the high mortality and morbidity rate caused by these diseases [3].
Indeed there are three main families of anthelmintic available on the market. Unfortunately, the frequent use of its molecules has led to the appearance of resistance to its drugs. In this context, it is imperative to design and prepare new drugs with a reinforced anthelmintic aim.
Consequently, the pharmaceutical industry is moving towards new research methods, which consist in predicting the properties and activities of molecules before they are even synthesized. In recent years, the use of technologies allowing to synthesize a very large number of molecules simultaneously and to test their actions on therapeutic targets has given very attractive results. This is the main objective of QSAR (Quantitative Structure Activity Relationships) studies. These studies are based on the search for similarities between molecules in large databases of existing molecules whose activities are known. The discovery of such a relationship linking both activities and molecular descriptors makes it possible to predict the activities of new compounds, and therefore to guide the syntheses of new molecules.
Material and methods
Database
This QSAR study concerns a series of sixteen molecules derived from 2-thiarylalkyl-1H-Benzimidazole with twelve molecules (75% of database) used for the training set and four molecules
(25% of the database) for the test set. These compounds have been synthesized and tested for their nematocidal activities by Akpa, et al. [4] Table 1.
All of the sixteen molecules used in our study have larvicidal concentrations ranging from 0.005 to 424 μg / ml. This concentration range does not allow a quantitative relationship to be defined between anthelmintic activity and theoretical descriptors.
Biological activities are generally expressed as the opposite of the base 10 logarithm of the activity so as to obtain higher mathematical values when the molecule is biologically effective. The anthelmintic activity is then expressed by the anthelmintic potential pCL100 defined by the relationship:
(1)
Where M is the molecular mass (g/mol) and CL100 the larvicidal concentration, it is the concentration necessary to eliminate 100% of the larvae of haemonchus contortus.
Theory level
The relationship between the values of the biological activity of the molecules studied and the molecular structures was highlighted by calculations of theoretical chemistry using the software Gaussian 09[5]. The density functional theory DFT [6] was used for our calculations with its functional B3LYP with the base 6-311G (d,p) in order to determine the molecular descriptors.
Indeed, DFT is known to generate a variety of molecular properties in a QSAR study [7, 8]. This method makes it possible to reduce the calculation time, increases predictability, and involves a lower cost in the design of drugs [9,10]. The model is obtained using the multilinear regression (RML) method using the XLSTAT [11] and EXCEL [12] software.
Calculated quantum descriptors
For the development of the QSAR model, several theoretical descriptors derived from the conceptual DFT were determined. These descriptors are: the dipole moment (μ), the Energy of the Highest Occupied Molecular Orbital (EHOMO) and the smallest negative charge (q-) of the molecule. These descriptors all determined following the optimization of the geometry of the molecules followed by the frequency calculation.
The calculation of the partial correlation coefficient between the descriptor pairs (aij) must be less than 0.70 which shows that the descriptors are independent of each other [13].
Estimation of the predictive capacity of the QSAR model
The quality of a QSAR model is determined based on the analysis of certain statistical criteria including the coefficient of determination R2, the standard deviation S, the Fisher coefficient F and the cross-validation coefficient Q2cv.
The statistical parameters R2, F and S relate to the adjustment between the experimental values and the calculated values. The cross-validation coefficient measures the accuracy of the model’s prediction on the data from the training set [14].
The coefficient of determination R2 measures the share of experimental variance explained by the model in relation to the total variance. Its value is between 0 and 1. The closer its
value is to 1, the more observed and predicted values are not correlated [15,16].
(2)
Where
Experimental value of anthelmintic activity
Theoretical value of anthelmintic activity
The average of the experimental values of the anthelmintic activity
The variance [17] is determined by the following relation:
(3)
Where k is the number of independent variables (descriptors) of the equation of the model, n is the number of molecules in the test set and n-k-1 is the degree of freedom.
The standard deviation S [18,19] is another statistical parameter, it provides information on how the distribution of data is distributed around the average.
(4)
The Fisher coefficient F [19,20]. allows to test the global significance of the linear regression
(5)
The cross-validation coefficient [21] measures the accuracy of the prediction on the data from the training set. It is calculated using the following relation:
(6)
The performance of the model according to the Erickson et al. criterion [22,23]. is characterized by the value of Q2cv >0.5 for a satisfactory model and for an excellent model Q2cv must be close to 0.9. The training set of the model will be acceptable if the criterion R2- Q2cv<0.3 is respected.
However, the predictive power of the model can be obtained by the ratio for the test set. The model is acceptable when the ratio of the values of theoretical activity to experimental activity tends towards unity for the validation set. The model is acceptable when the ratio of the values of theoretical activity to experimental activity tends towards unity.
Results and discussion
Values of calculated molecular descriptors
In this QSAR work, three (03) pertinent molecular descriptors were calculated. These descriptors are: the dipole moment (μ), the Energy of the Highest Occupied Molecular Orbital (EHOMO) and the smallest negative charge (q-) of the molecule. The Table 2 reports the different values of these molecular descriptors.
The partial correlation coefficients aij between the descriptor pairs shows that they are less than 0.70, which demonstrates the independence of the descriptors used to develop the model.
Validation of the QSAR model
The positive or negative sign of the coefficients of the model descriptors reflects the effect of proportionality between the evolution of anthelmintic activity and the descriptors in the model equation. The best QSAR model obtained for anthelmintic activity against haemonchus contortus is as follows:
(7)
with a statistical indicators:
The negative sign of the dipole moment coefficient indicates that the anthelmintic activity is improved for low values of the dipole moment (μ). The energy of the highest occupied molecular orbital (EHOMO) and the smallest negative charge (q-) of the molecule are all negative. Under these conditions, low values of these two descriptors lead to an increase in anthelmintic activity. The coefficient of determination R2= 0.917 shows that 91.7% of the experimental variance of anthelmintic activity is explained by the descriptors of the established QSAR model. Regarding the Fischer coefficient, we note a quantity which is worth F= 29.354. This reflects our QSAR model is globally significant. As for the cross validation coefficient, its value is Q2cv = 0.916 and is greater than 0.90. Likewise, the difference R2-Q2cv less than 0.3. Which means our QSAR developed model is excellent in predicting anthelmintic activity.
The external validation of the model is obtained by the ratio is presented in Tables 3,4.
All the values of the ratio tend towards the unit. This indicates the good correlation between the experimental and theoretical values of the anthelmintic potential of 2-thioalkylaryl-1H-Benzimidazole derivatives. This model is therefore acceptable for predicting anthelmintic activity against haemonchus contortus in the series of 2-thioalkylaryl-1H-Benzimidazole derivatives.
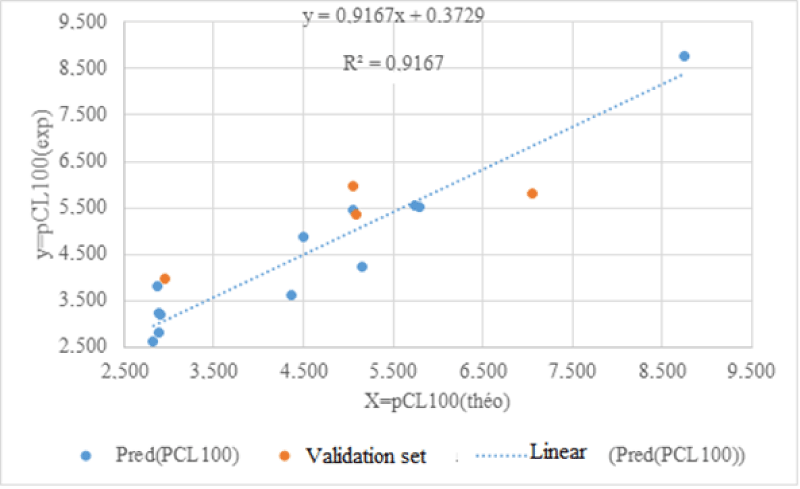
The line of regressions between the theoretical and experimental anthelmintic activities between the training set and the test set is illustrated in Figure 1.
Analysis of the contribution of descriptors in the model
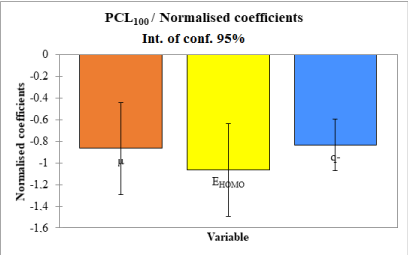
The relative contribution of the descriptors in predicting the anthelmintic activity of the compounds is presented in Figure 2.
The energy of the highest occupied molecular orbital has the largest contribution followed by the dipole moment and the smallest negative charge in the molecule.
Conclusion
In this work, Quantitative Structure-Activity Relationship (QSAR) methodology and theoretical chemistry methods were used to establish a predictive model of the anthelmintic activity of a series of 2-Thioalkyl Aryl Benzimidazole derivative coded TAB and TBZ against Haemonchus contortus. We determined molecular descriptors using theory level B3LYP/ 6-311G (d,p). The developed model depends on three (03) parameters (descriptors) namely the dipole moment (μ), the energy of the highest occupied molecular orbital (EHOMO) and the smallest negative charge (q-) of the molecule. This model displays very satisfactory statistical indicators. Indeed, R2= 0.917; Q2cv=0.916; S=0.606; F= 29.354. The Q2cv value greater than 0.90 indicates that the established QSAR model has excellent predictive power. For the Fischer coefficient, its high value shows that our established model is significant in predicting the anthelmintic activity of the series of studied molecules. The model contains at least one descriptor relevant to predicting the biological activity of this family of molecules. After studying the contribution of descriptors, it emerges that the energy of the highest occupied molecular orbital (EHOMO) is the descriptor that makes the strongest contribution in the prediction of anthelmintic activity of this series of molecules. It is therefore the priority descriptor in the prediction of anthelmintic activity.
This study will play a very important role in explaining anthelmintic activity and will also provide guidance for the design of new molecules with improved anthelmintic activity. From now on, for the design of new molecules with improved anthelmintic activity, we can simply play on the three descriptors of the QSAR developed model.
- Troncy PM, Chartier C (2000) Helminthoses et coccidioses du bétail et des oiseaux de la bassecour en Afrique tropicale. In : Chartier C, Itard J, Morel PC, Troncy PM, eds, précis de parasitologie vétérinaire tropicale. Paris, France, Tec&Doc 773.
- Zinsstag J (2000) Nématodes gastro-intestinaux du bétail bovin N’Dama en Gambie: Effets sur la productivité et option pourla lutte. Thèse PhD N°11, institut de medecine Tropicale Prince Leopold, Antwerpen, Belgique.
- Richard DS, Joanna C (2002) QSAR Study of a Serie of Benzimidazolylchalcone Derivatives by the Density Fonctional Theory (DFT) Method. World Health Organ 80: 126. Link: https://bit.ly/3iw1Bh7
- Sagne A (2013) Thèse de Doctorat, Synthèse de 2-Thiobenzyl (Thiomethylbenzimidazolyl) Benzimidazoles et analogues structuraux à visée anti-infectieuses.
- Frisch MJ, Trucks GW, Schlegel HB, Scuseria GE, et al. (2016) Gaussian 09, Revision A 02. Link: https://bit.ly/2TLqZox
- Robb MA, Cheeseman JR, Scalmani G, Barone V, Mennucci B, et al. (2009) Solvent Effects on the [3+2] Cycloaddition of 2-Furfural Oxime and Ethyl Propiolate: Unexpected Change in Regioselectivity. Gaussian, Inc., Wallingford CT. Link: https://bit.ly/3g24ZOT
- Hohenberg P, Kohn W (1964) Inhomogeneous electron gas. Phys Rev 136: B864. Link: https://bit.ly/3w2GqH7
- Chattaraj PK, Cedillo A, Parr RG (1991) Variational method for determining the Fukui function and chemical hardness of an electronic system. J Phys Chem 103:7645.
- De Proft F, Martin JML, Geerlings P (1996) QSAR Study of a Serie of Benzimidazolylchalcone Derivatives by the Density Fonctional Theory (DFT) Method. Chem Phys Let 256: 400. Link: https://bit.ly/2RwbbFo
- Hansch C, Sammes PG, Taylor JB (1990) Computers and the medicinal chemist; in: Comprehensive Medicinal Chemistry. 4, Eds. Pergamon Press, Oxford: 33-58.
- Franke R (1984) Theoretical Drug Design Methods, Elsevier, Amsterdam. Link: https://bit.ly/3w549Xd
- XLSTAT Version 19.5.47062 (64 bit) Copyright 1995-2018 (2018) XLSTAT and Addinsoftware Registered Trademarks of Addinsoft. Link:https: //www.xlstat.com.
- Microsoft ® Excel ® 2013 (15.0.4420.1017) MSO (15.0.4420.1017) 64 Bits (2013) Partie de Microsoft Office Professionnel Plus. Link:
- Vessereau A (1988) Méthodes statistiques en biologie et en agronomie. Lavoisier (Tec and Doc). Paris 538. Link: https://bit.ly/3x5kNX0
- Golbraikh A, Tropsha A (2002) Beware of q2!. J Mol Graph Model 20: 267-276. Link: https://bit.ly/3vbKUKB
- Lejeune M (2004) ‘’Statistiques :la théorie et ses applications’’, Springer Verlag. Link: https://bit.ly/3iqmD0r
- Diarrassouba F, Koné M, Bamba K, Traoré Y, Koné MGR, et al. (2019) Development of Predictive QSPR Model of the First Reduction Potential from a Series of Tetracyanoquinodimethane (TCNQ) Molecules by the DFT (Density Functional Theory) Method. Computational Chemistry 7: 121-142. Link: https://bit.ly/3x6QqPI
- Doh S, Lynda E, Mamadou GRK, Tchiroua E, Sopi TA, et al. (2018) Prédiction of the Inhibitory Concentration of Hydroxamic Acids by DFT-QSAR Models on Histone Deacetylase 1. International Research Journal of Pure & Applied Chemistry 16: 1-13. Link: https://bit.ly/2TOA00e
- Siegel AF (1997)’’Pratical Business Statistic’’, IRWIN, 3rd edition. Link: https://bit.ly/3v1WJD0
- Cook RD, Weisberg S (1994) ’An introduction to regression graphics. Wiley Series in Probability and Statistics. Link: https://bit.ly/2RBY6dU
- Fatogoma D, Kafoumba B, Mawa K, Ahissan DE, Koffi K, et al. (2020) Quantitative Structure-Property Relationship (QSPR) modeling of the second reduction potential of a family of Tetracyanoquinodimethane (TCNQ) molecules using descriptors of quantum chemistry 10: 01-16. Link: https://bit.ly/3x2DWss
- N’guessan KN, Guy-Richard Koné M, Bamba K, Patrice OW, et al. (2017) Quantitative Structure Anti-cancer Activity Relationship (QSAR) of a series of Ruthenium Complex Azopyridine by the method of Density Fonctional Theory (DFT). Computational Molecular Bioscience 7: 19-31. Link: https://bit.ly/3gffvRT
- Eriksson LJ, Jaworska A, Worth AP, Cronin MT, McDowell RM, et al. (2003) Gramatica, Methods for Reliability and Uncertainly Assessment and for Applicability Evaluations of Classification and Regression-Based QSARs. Environ Health Perspect 111: 1361-1375. Link: https://bit.ly/3crKUzh
- N’Dri J, Kone M, Kodjo C, Affi S, Kablan A, et al. (2017) Quantitative Structure Activity Relationship (QSAR) of a series of Azetidinones Derived from Dapsone by the method of Density Fonctional Theory (DFT). IRA International Journal of Applied Sciences 8: 55-62. Link: https://bit.ly/3z4Kskp
Article Alerts
Subscribe to our articles alerts and stay tuned.
 This work is licensed under a Creative Commons Attribution 4.0 International License.


 Save to Mendeley
