Annals of Environmental Science and Toxicology
Presenting a novel approach for designing chlorine contact reactors by combination of genetic algorithm with nonlinear condition functions, simulated annealing algorithm, pattern search algorithm and experimental efforts
Mohammad Gheibi1*, Hossein Pouresmaeil2, Mehran Akrami1, Zahra Kian3, Amir Takhtravan4 and Maryam Mohammadi5
2Department of Environmental Engineering, University of Tehran, Iran
3Department of Chemical Engineering, Amirkabir University of Technology, Tehran, Iran
4Department of Civil Engineering, Birjand University of Technology, Iran
5Department of Chemical and Polymer Engineering, Yazd University, Yazd, Iran
Cite this as
Gheibi M, Pouresmaeil H, Akrami M, Kian Z, Takhtravan A, et al. (2021) Presenting a novel approach for designing chlorine contact reactors by combination of genetic algorithm with nonlinear condition functions, simulated annealing algorithm, pattern search algorithm and experimental efforts. Ann Environ Sci Toxicol 5(1): 012-017. DOI: 10.17352/aest.000030Nowadays, water supplies face critical conditions in terms of quality and quantity. Furthermore, growth in population along with their needs require an increasing level of water-related resources. Consequently, the potential application of purified wastewater supplies can be considered in agriculture, industry, and irrigation of green spaces. Hence the necessity of disinfection and reduction of microbial load in the outlet sewage of water treatment plants are so clear for all designers and operators. Chlorine contact reactors are one of the major pillars of any wastewater treatment plant, whether urban or industrial. A new method is presented in this study based on the optimization of the dispersion amount in a Chlorine Contact Plug Flow Reactor (CCPFR) using single-objective Genetic Algorithm (GA) and nonlinear condition functions, Simulated Annealing Algorithm (SAA) and Pattern Search Algorithm (PSA). Then, it is attempted to assess the hydraulic behavior of the reactor and the microbial load removal performance using statistical, probabilistic and experimental practices. This research was done in a case study of Mashhad city’s wastewater treatment plant. The results of presented study illustrate that GA model has the best outcomes for designing CCPFR and the desired reactor with a depth of 2.45m, width of 1.23m, length of 24.8m, a number of 15 channels, and a retention time of 87 minutes is able to reduce a population of 300000 microorganisms (MPN/100 ml) at the entry to 274 (MPN/100 ml) at the exit. As per this method, investment cost of CCPFR is reduced around 30 percentages in comparison of traditional computation system.
Introduction
Since the beginning of the1900s until the early 1970s, wastewater treatment was majorly carried out with the purpose of separating colloidal particles and suspended floating matter, purifying biological decomposable material, and removing pathogenic microorganisms [1]. Following the approval of Federal Water Pollution Control Act of 1972 in the US, a set of general changes were introduced in wastewater treatment processes. When the act was passed, the US Environmental Protection Agency (EPA) necessitated the application of advanced secondary treatment with the purpose of adjusting pH parameters, the extent of Biological Oxygen Demand (BOD), total suspended solids, and fecal coliforms for wastewater treatment plants in 1973 [2]. The agency also enabled different states to edit and compile their own criteria including disinfection indices for wastewater treatment plans [1-4]. As a result, certain states in the US nowadays use standard ranges of 5000-2.2 (MPN (Most Probable Number)/ 100ml) and 10000-2.2 (MPN/ 100ml) for fecal and total coliforms, respectively. The most common standard for receiving water is up to 300 (MPN/ 100ml) for fecal coliforms [2-6]. Currently, the most common method in Iran involves using chlorine for disinfection due to its low cost and relatively suitable microbe removal power and survival rate. During the disinfection process, there are five general mechanisms that disable microorganisms and damage their cellular structure; these mechanisms include damaging cell walls, changing cell permeability, changing the colloidal properties of protoplasm, changing DNA or RNA, and preventing enzyme activities [7]. Oxidizing chemicals such as chlorine prevents enzyme activities in microorganisms. In other words, oxidizing substances destroy the geometrical structure of enzymes to prevent microorganisms from using food materials (substrates) through enzymes [8]. A key unit in designing wastewater treatment plants is chlorine contact tanks as a microbial control system. The purpose of designing this reactor is to offer sufficient contact time between chlorine and sewage mass in order to destroy microorganism structures. Subsequently, this Plug Flow Reactor (PFR) requires particularly detailed design and systematic calculations [9]. PFR systems are commonly used for chlorine contact tanks in order to provide longitudinal mixing and sufficient retention time for contact between chlorine and the fluid. In this system, the injected chlorine is dispersed across the sewage flow through three mechanisms including diffusion mass transfer, advection, and dispersion [10-14].
As per reviewed researches, designing and computing the optimum Chlorine Contact Plug Flow Reactor (CCPFR) is considered serious problem in planning the wastewater treatment plants. While, the classical systems cannot cover optimum conditions and application of evolutionary algorithms can be useful for satisfying economical purposes. This research gap can be fill by presenting a novel method for computing the dimensional aspects and microbial performance evaluation of CCPFR.
In this study, it is attempted to (i) present a method for designing a chlorine contact reactor using single-objective Genetic Algorithm (GA) and nonlinear condition function, Simulated Annealing Algorithm (SAA) and Pattern Search Algorithm (PSA), (ii) assess the behavior of the designed reactor using probability distribution functions and microbial load elimination and (iii) economic appraisal of GA, SAA and PSA algorithms performance for designing CCPFR.
Materials and Methods
Calculation relations for reactor design
First, the capacity of pump dosing systems should be indicated. To this end, the values recommended by the literature are used. Calculations related to this section are presented in Equation 1 [15-18].
Next, the design process takes place according to the flow dispersion model. The design stages in this part are presented in Equation 2. The ultimate purpose of this section is to indicate the extent of dispersion to assess the reactor’s functional system [19-21].
Application of genetic algorithm in reactor design
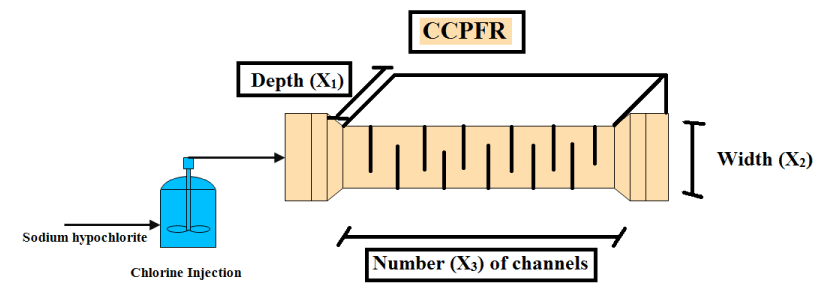
In this section, parameters including depth (X1), width (X2) and number (X3) of channels were defined as the variables for the optimization equation. However, the extent of standard dispersion according to design standards in CCPFR should be within a range of 0-0.015. Consequently, the optimization error function can be expressed based on the sum of squared errors as shown in Equation 3. Likewise, the specification of GA, PSA and SAA are depicted in Equation 4 until 6, correspondingly.
Next, the length of the reactor is defined as a nonlinear condition function of the three aforementioned variables (For GA and PSA), demonstrated in Equation 7. As per main design references [1], the suggested value of reactor’s length (Lemperical) should be more than Ltheory ( ). In the all equations, Qave, kmax and t are equal to mean flow of wastewater, maximum coefficient of wastewater regime and hydraulic retention time in each design, respectively.
In this study, the entire calculations were carried out using MATLAB® 2013b software and Optim Tool [22]. Furthermore, given the experiences gained from previous design attempts, minimum and maximum limits should be considered for X1, X2, X3, and Empirical variables. According to the literature, the hydraulic retention time (HRT=t) was selected in a range of 90-120 minutes at the beginning of the design process [23]; then, the accuracy of the choice is controlled using statistical functions and hydraulic examinations. Subsequently, the hydraulic retention time at the beginning of the design is considered as 120 minutes.
Examining the hydraulic behavior of the reactor
The designed tank should then be assessed in terms of hydraulics and performance conditions of the reactor. Prior to the examining this factor, it should be pointed out that a performance similar to that of CCPFR could be created by serializing a large number of CMR reactors. Péclet number was used to provide equivalence among reactors (Equation 8) [24]. Likewise, probability of passed flow in channel is computed by Equation 9.
Experimental efforts
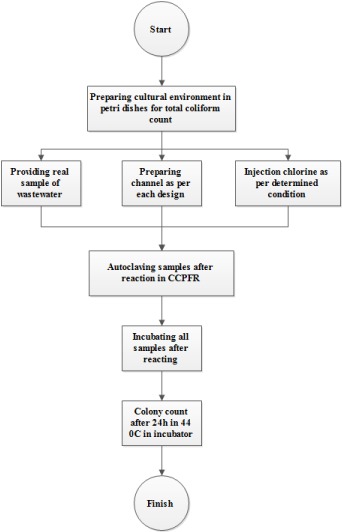
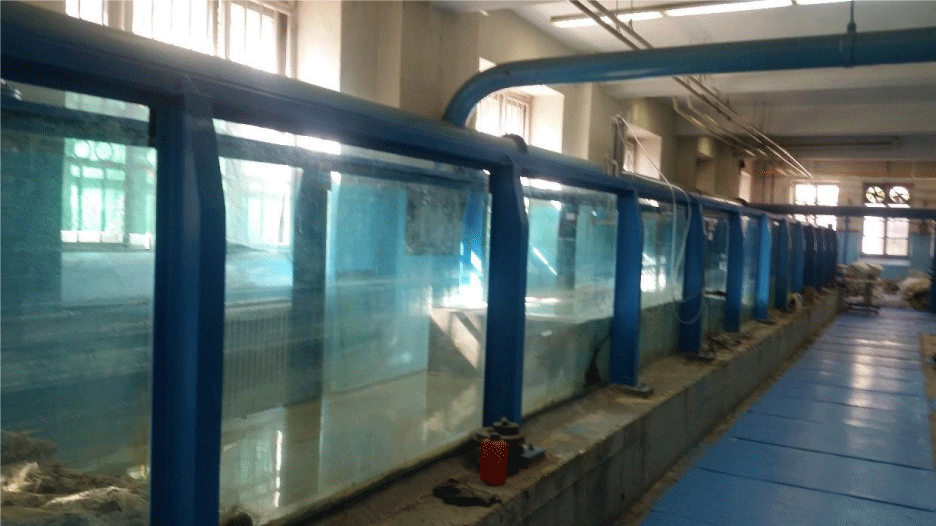
For evaluation of each designed system based on GA, PSA and SAA, some experiments for assessment of microbial load elimination are done in the Lab. In each run, Total Coliform removal is appraised and all experiments are performed as per standard method for the examination of water and wastewater [25]. The algorithm of experimental efforts is illustrated in Figure 1. Whereas, outcomes of each algorithm are assessed in adjustable water channel in the hydraulic (For implementation of patterns) and microbial (For microbial load elimination) Labs. The scheme of adjustable water channel and real picture of channel are demonstrated in Figures 2,3, respectively. Likewise, all hydraulic and microbial experiments are done in Ferdowsi university of Mashhad, Iran and Reyhan Azma, Mashhad, Iran, correspondingly. Hydraulic experiments are completed based on each algorithm (GA, SAA, PSA, classical model) with three repetitions (All hydraulic efforts were equal to twelve tests). Also, for evaluation of microbial load elimination, all microbial culturing has done in three repetitions in each run. In this investigation, all materials such as chlorine (Sodium Hypochlorite) and cultural environment (Mc Cankey agar) are purchased from Merck, Germany. All microbial experiments are calculated with .
Results and Discussions
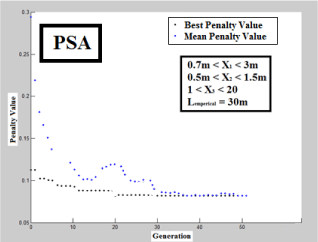
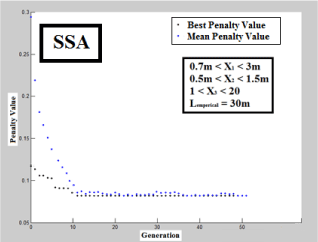
To carry out analyses beyond the presented scenario, an average discharge of 3000 m3/day and maximum coefficient of 2.75 were considered as per real condition of Mashhad city wastewater treatment plant. Accordingly, GA, PSA and SSA were performed using predetermined limits shown in Figure 4 until Figure 6, correspondingly. The outcomes of designed CCPFR by each algorithm and classical computation is summarized in Table 1. As per Figures 4-6, SSA is tended to optimum conditions faster than other algorithms (around 10 iteration). While GA and PSA tend to optimum situation around 20 and 40 iterations, but, it is not powerful reason for determination of performance of design for each computational method.
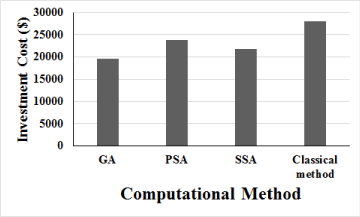
Based on outcomes of Table 1, the cost of each mathematical model for designing CCPFR is illustrated in Figure 7. According to Figure 7, GA, PSA and SSA can reduce the CCPFR investment cost equal to 30%, 15% and 22% respectively, in comparison of classical computation. It is worth noting that all economic computations are computed based on material and construction usages as per Iranian markets in 2021.
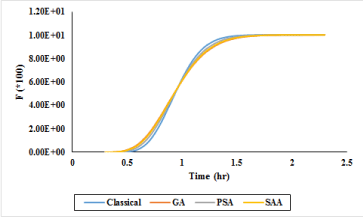
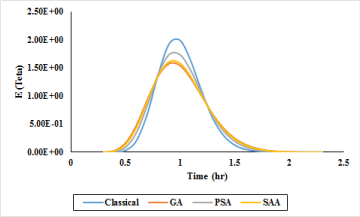
Calculations regarding the hydraulic behavior of chlorine contact reactor were carried out flow passing in each design. The extent of changes in probability function of E (Teta) which is based on the probability of a certain percentage of flow passing through the reactor for GA, PSA and SAA are demonstrated in Figure 8. In the following, values of cumulative passage percentage of the flow (F) from the reactor as per GA, PSA and SAA are expressed in Figure 9. Based on Figures 8,9 for scrutinizing the performance of flow passing, it is clear that GA is tend to maximum efficiency in the minimum time in comparison of other methods.
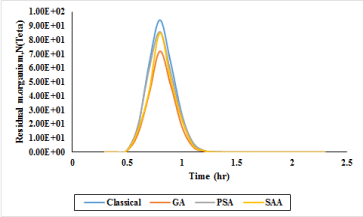
In the final part of designing the disinfection system using chlorine, the extent of residual microorganisms were assessed using the Segregated Flow Model (SFM) method and experimental efforts [26-28]. Plus, for evaluation of microbial load elimination, all measurements and residual microbial load detections were done in the last point of channel. The outputs of analyses as per GA, PSA, SAA and classical computations for CCPFR design are demonstrated in Figure 10. According to Figure 10, in 87 min after reaction time passing, all computation outcomes present the best performance, but, GA have shown minimum residual total coliform in the mentioned time. Therefore, GA has the best performance for designing CCPFR in comparison of PSA, SSA and classical calculations.
The results of calculations illustrate that the number of residual microorganisms during hydraulic retention time for GA (in high level of performance) was 274 (with initial number of 300000) per 100 ml of MPN, which is acceptable given common standard values as per Environmental Protection Agency standards [29]. Rauen, et al. (2012) have presented a novel method for designing CCPFR based on Computational Fluid Dynamics (CFD). The results showed that CFD can be useful for simulating E(Teta) and F values with high accuracy [30]. Also, Hart and Vogiatzis (1982) have expressed modified CCPFR with cross-baffles for enhancing the performance of microbial load elimination. The declared investigation illustrated that with application of baffles, urban standards can be satisfied [31].
Conclusion
Considering the second use of purified wastewater supplies for applications such as agriculture, industry, and irrigation, the disinfection of outlet sewage from wastewater treatment plants has been necessitated. A number of various calculation methods are used for hydraulic design and dimensions of CCPFR at wastewater treatment plants. The present study offers a new method for designing CCPFR using GA, PSA, SAA and classical computations. Then, the hydraulic and functional behavior of the designed reactor was assessed and examined using the statistical reactor assessments and experimental efforts. The results showed that GA can optimize the investment cost of CCPFR equal to 30% and it was the minimum value between all computation systems. The GA based reactor in question with a depth of 2.45m, width of 1.23m, and length of 24.8m with 15 channels and hydraulic retention time of 87 minutes is capable of reducing microorganism population from 300000 (MPN/ 100ml) at the entry to 274 (MPN/ 100ml) at the outlet. The mentioned outcomes were acceptable from point view of EPA standards. The outcomes have shown that all GA, SAA and PSA are acceptable based on EPA standard, but GA results can present the most optimum condition in comparison of other ones.
- Metcalf L, Eddy HP (1972) Wastewater Engineering: Collection. Treatment, Disposal. Link: https://bit.ly/31PYMOj
- Qasim SR (2017) Wastewater treatment plants: planning, design, and operation. Routledge. Link: https://bit.ly/3wyUrx3
- Rajkumar D, Kim JG (2006) Oxidation of various reactive dyes with in situ electro-generated active chlorine for textile dyeing industry wastewater treatment. J Hazard Mater 136: 203-212. Link: https://bit.ly/2Rf3Cm8
- Park JC, Song YI, Jung YM, Song SJ, Park D (2015) Assessment of the environmental, social and economic benefits of a water transfer tunnel in the Nakdong River, Korea. International Journal of Water Resources Development 31: 618-629. Link: https://bit.ly/3sYVSm2
- Zimmermann SG, Wittenwiler M, Hollender J, Krauss M, Ort C, et al. (2011) Kinetic assessment and modeling of an ozonation step for full-scale municipal wastewater treatment: micropollutant oxidation, by-product formation and disinfection. Water Res 45: 605-617. Link: https://bit.ly/2PzPofg
- Choi Y, He H, Dodd MC, Lee Y (2021) Degradation Kinetics of Antibiotic Resistance Gene mecA of Methicillin-Resistant Staphylococcus aureus (MRSA) during Water Disinfection with Chlorine, Ozone, and Ultraviolet Light. Environ Sci Technol 55: 2541-2552. Link: https://bit.ly/2OsK3Wv
- Qian Y, Chen Y, Hu Y, Hanigan D, Westerhoff P, et al. (2021) Formation and Control of C-and N-DBPs during Disinfection of Filter Backwash and Sedimentation Sludge Water in Drinking Water Treatment. Water Res 116964. Link: https://bit.ly/325WIC1
- Xue R, Shi H, Ma Y, Yang J, Hua B, et al. (2017) Evaluation of thirteen haloacetic acids and ten trihalomethanes formation by peracetic acid and chlorine drinking water disinfection. Chemosphere 189: 349-356. Link: https://bit.ly/3wvNZa2
- Li XF, Mitch WA (2018) Drinking water disinfection byproducts (DBPs) and human health effects: multidisciplinary challenges and opportunities. Environ Sci Technol 52: 1681-1689. Link: https://bit.ly/31Sn9Lc
- Mazhar MA, Khan NA, Ahmed S, Khan AH, Hussain A, et al. (2020) Chlorination disinfection by-products in Municipal drinking water–A review. Journal of Cleaner Production 273: 123159. Link: https://bit.ly/2R9EQ6N
- Galal-Gorchev H (1996) Chlorine in water disinfection. Pure and Applied chemistry 68: 1731-1735. Link: https://bit.ly/3t1NYsg
- Richardson SD, Thruston AD, Caughran TV, Chen PH, Collette TW, et al. (2000) Identification of new drinking water disinfection by-products from ozone, chlorine dioxide, chloramine, and chlorine. Water air and Soil Pollution 123: 95-102. Link: https://bit.ly/39NOKS1
- Richardson SD, Postigo C (2011) Drinking water disinfection by-products. In Emerging organic contaminants and human health. Springer, Berlin, Heidelberg 93-137. Link: https://bit.ly/3mp46Sa
- Li XF, Mitch WA (2018) Drinking water disinfection byproducts (DBPs) and human health effects: multidisciplinary challenges and opportunities. Environ Sci Technol 52: 1681-1689. Link: https://bit.ly/3sPobn3
- Von Gunten U (2003) Ozonation of drinking water: Part II. Disinfection and by-product formation in presence of bromide. Iodide or chlorine. Water Res 37: 1469-1487. Link: https://bit.ly/3uxuOuR
- Sedlak DL, von Gunten U (2011) The chlorine dilemma. Science 331: 42-43. Link: https://bit.ly/3dCy6pD
- Li H, Zhu X, Ni J (2011) Comparison of electrochemical method with ozonation, chlorination and monochloramination in drinking water disinfection. Electrochimica Acta 56: 9789-9796. Link: https://bit.ly/2OqsCpx
- Zhao Y, Qin F, Boyd JM, Anichina J, Li XF (2010) Characterization and determination of chloro-and bromo-benzoquinones as new chlorination disinfection byproducts in drinking water. Anal Chem 82: 4599-4605. Link: https://bit.ly/3dJIwnE
- Shirazian S, Rezakazemi M, Marjani A, Moradi S (2012) Hydrodynamics and mass transfer simulation of wastewater treatment in membrane reactors. Desalination 286: 290-295. Link: https://bit.ly/31S0zm2
- Bennamoun L, Fraikin L, Léonard A (2014) Modeling and simulation of heat and mass transfer during convective drying of wastewater sludge with introduction of shrinkage phenomena. Drying Technology 32: 13-22. Link: https://bit.ly/3mzup8t
- Schmalz C, Frimmel FH, Zwiener C (2011) Trichloramine in swimming pools–formation and mass transfer. Water Res 45: 2681-2690. Link: https://bit.ly/3t7jogI
- Yu X, Gen M (2010) Introduction to evolutionary algorithms. Springer Science & Business Media. Link: https://bit.ly/3fLY9NR
- Wu QY, Li Y, Hu HY, Sun YX, Zhao FY (2010) Reduced effect of bromide on the genotoxicity in secondary effluent of a municipal wastewater treatment plant during chlorination. Environ Sci Technol 44: 4924-4929. Link: https://bit.ly/39HtnSv
- Antoniou CV, Koukouraki EE, Diamadopoulos E (2006) Determination of chlorinated volatile organic compounds in water and municipal wastewater using headspace–solid phase microextraction–gas chromatography. J Chromatogr A 1132: 310-314. Link: https://bit.ly/39MEbyG
- American Public Health Association. American Water Works Association, Water Pollution Control Federation, & Water Environment Federation (1912). Standard methods for the examination of water and wastewater. American Public Health Association 2. Link:
- Cong D, Doherty M, Pang KS (2000) A new physiologically based, segregated-flow model to explain route-dependent intestinal metabolism. Drug Metab Dispos 28: 224-235. Link: https://bit.ly/3wrIWrj
- Male F (2019) Using a segregated flow model to forecast production of oil, gas, and water in shale oil plays. Journal of Petroleum Science and Engineering 180: 48-61. Link: https://bit.ly/3cPJ5Nf
- Male F, Gherabati A, Browning J, Marder M, Ikonnikova S (2017) Forecasting production from Bakken and three forks wells using a segregated flow model. In Unconventional Resources Technology Conference, Austin, Texas, Society of Exploration Geophysicists, American Association of Petroleum Geologists, Society of Petroleum Engineers 254-264. Link: https://bit.ly/323GQzX
- Pressman JG, Richardson SD, Speth TF, Miltner RJ, Narotsky MG, et al. (2010) Concentration, chlorination, and chemical analysis of drinking water for disinfection byproduct mixtures health effects research: US EPA’s four lab study. Environ Sci Technol 44: 7184-7192. Link: https://bit.ly/3rTBnWS
- Rauen WB, Angeloudis A, Falconer RA (2012) Appraisal of chlorine contact tank modelling practices. Water Research 46: 5834-5847. Link: https://bit.ly/2R2TcWw
- Hart FL, Vogiatzis Z (1982) Performance of modified chlorine contact chamber. Journal of the Environmental Engineering Division 108: 549-561. Link: https://bit.ly/2OvsQvC
Article Alerts
Subscribe to our articles alerts and stay tuned.
 This work is licensed under a Creative Commons Attribution 4.0 International License.


 Save to Mendeley
