Global Journal of Ecology
Potential assessment of renewable energy resources and their power plant capacities in Iran
Mehrzad Khazaee, Rahim Zahedi, Reza Faryadras and Abolfazl Ahmadi*
Cite this as
Khazaee M, Zahedi R, Faryadras R, Ahmadi A (2022) Potential assessment of renewable energy resources and their power plant capacities in Iran. Glob J Ecol 7(2): 060-071. DOI: 10.17352/gje.000062Copyright
© 2022 Khazaee M, et al. This is an open-access article distributed under the terms of the Creative Commons Attribution License, which permits unrestricted use, distribution, and reproduction in any medium, provided the original author and source are credited.Today, most developed and developing countries utilize renewable energy to meet their needs. The use of renewable energy prevents environmental pollution. A concern of the governments is to deal with environmental pollution. Iran as a major oil-producing country has increasingly paid attention to non-fossil energy resources, in particular renewable energy sources for its longer-term energy plans. In this paper, the types of renewable energy used in electricity generation in Iran have been studied. Studies show that during the last 20 years, 1.5% of the amount of electricity produced in Iran is supplied by renewable energy. Iran also has a much greater potential for utilizing renewable energy. By 2020, Iran has a potential of 42000 MW use of renewable energies. However, the capacity of renewable power stations constructed in Iran is 800 MW. Different regions of Iran have high wind, solar and geothermal energy potential, which has not been used enough to meet electricity needs.
Introduction
An essential aspect of development is energy consumption [1]. There are two sources of energy: renewable energy (geothermal, solar, wind, etc.), and non-renewable energy (fossil fuels) [2]. During the last century, fossil fuels have been the major providers of the world’s energy consumption. In different countries, the penetration of renewable energy sources is a critical aspect of planning for development [3-5]. The expansion of solar photovoltaic (PV) power stations as an application of solar energy have several benefits, including economic/technological development and reduced climate change effects/fossil fuel consumption/greenhouse gas emissions [6,7].
Iran has some of the global richest oil/gas reserves, ranking fourth for crude oil reserves [8,9] and second for natural gas reserves [10]. Renewable energy deployment has multiple motivations in resource-rich countries [11]. Iran needs to use renewable, sustainable energy sources for a variety of reasons, including rising population, high renewable resource potential, and advantages [12-14], increased popularity for domestic energy [15], and released domestic oil and gas resources for export [16]. There are other indirect advantages, including economic diversification, energy security, high-quality jobs, a more sustainable balance of trade, and new business ventures [17], relieving the burden of fossil fuel subsidies [18], dealing with the region’s severe air pollution [19] and minimizing the risks related to climate-altering greenhouse gas (GHG) emissions [20]. Because of climatic diversity and the country’s size, a wide range of renewable energy sources could be explored in Iran [21].
Iran is a Middle Eastern country situated in a high-radiation area and thus enjoys a distinct solar energy benefit [22-25]. Iran’s first solar power station (capacity = 250 KW) was constructed in Shiraz in 2008. Until 2015, Iran’s PV power stations had a total capacity of lower than 5 MW [26].
The Iranian government adopted new supportive policies in 2017 to ensure solar power generation, paving the way for investment in constructing PV power stations for generating electricity [27]. By implementing new supportive policies over the last three years, capacity had increased from less than 5 MW in 2015 to more than 45 MW in 2018. In 2017, 30 MW of this capacity was used, indicating that Iran is open to constructing PV systems [28]. Nevertheless, the installed capacity has not yet reached its maximum potential. There are plans in the works to boost the volume of electricity generated by PV systems. The current policy adopted by Iran’s government for encouraging investment in PV systems is to buy electricity generated by PV power stations at an ensured uniform FIT across all Iranian provinces.
According to the World Energy Outlook (2017), the world’s population is expected to grow from 7.4 billion in 2017 to more than 9 billion in 2040, resulting in a 30% increase in global energy demand [29]. Renewable energy will grow at the fastest rate in the electricity sector, accounting for nearly 30% of total demand in 2023 [30]. Hydropower will continue to be the most popular renewable energy source, accounting for 16 percent of the world’s electricity demand by 2023 [31], followed by wind (6 percent), solar PV (4 percent), and bioenergy (3 percent). Many issues in developing countries obstruct progress toward adopting renewable energy sources [32]. The key hurdles in the RE industry are a shortage of equipment and infrastructure required to manufacture necessary parts, transmission and storage problems, high construction costs, economic hurdles, technological costs, financial issues, scientific-technological hurdles, legal-political challenges, organizational hurdles, restricted access to modern information/technology, and social norms [29]. However, the advancement of such technologies may result in monetary, environmental, and social advantages and management and operational issues [33-36]. Three types of renewable energy, the solar, wind, and geothermal, have the greatest potential for electricity generation in Iran [37,38]. Therefore, they are examined in this paper.
In this study a review of the previous research has been done and also the potential of wind, solar and geothermal energies in Iran is measured. The sum of all the 3 mentioned renewable energy power plant capacities is indicated and compared with the potential feasibility of each energy. In the following the status of each of these alternative energy sources is reviewed rather in detail.
Wind energy feasibility
Wind energy for reasons such as non-pollution, renewable, tourist attraction, etc. in order to generate electricity has attracted more attention. Wind energy increased by 50% yearly on average from 2010 to 2015 (when it accounted for 1.5 percent of total global energy) [39,40]. Wind resources can not be relied on to generate specific electrical energy volumes due to their relationship with the time, location, and daily/seasonal changes in climate in a given region. Furthermore, wind energy is affected by the region’s environmental and geophysical properties owing to its intermittent and stochastic nature [41].
The second-largest source of renewable energy in Iran is wind energy. According to a wind energy potential assessment of the ministry of energy project, Iran’s harnessing potential is estimated to be around 100 GW [42]. Table 1 shows the current locations and capacities of wind energy projects. Existing power stations had a capacity of 158.5 MW in 2015, up 5 MW from the previous year. The launch of a 5-MW wind turbine in Qazvin was responsible for this [43]. In Iran, the first wind turbines were installed in the northern cities of Rudbar and Manjil. Currently, 204 different wind turbines throughout the country are generating approximately 170 MW of electricity [44].
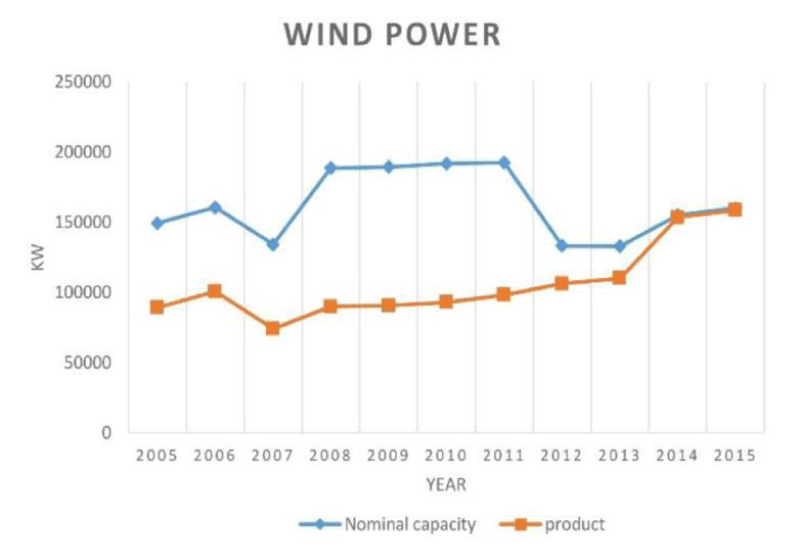
Wind power sites have a nominal capacity of 152130 KW, 85 suitable sites have already been constructed in 26 regions. Table 1 summarizes the current wind farms and their capacity. According to data extracted from the Energy Balance sheet of Iran from 2005-2015, the available wind potential is not fully utilized. Over the past few years, however, the gap between actual capacity and nominal capacity has narrowed to almost nothing Figure 1 [45]. Shows how the full capacity created is being put to the best possible use.
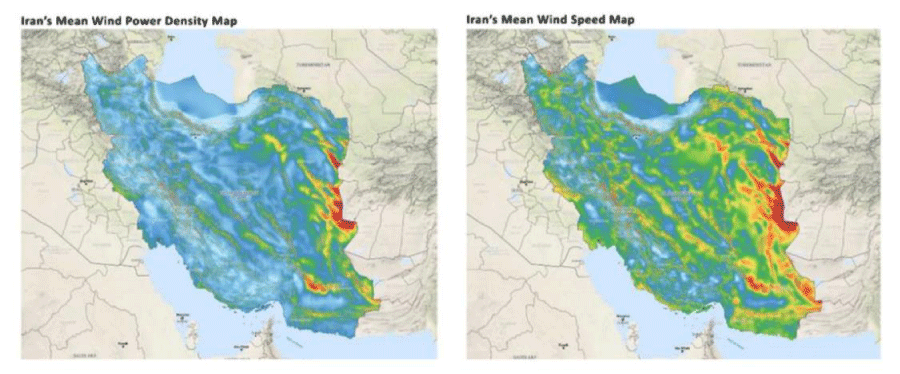
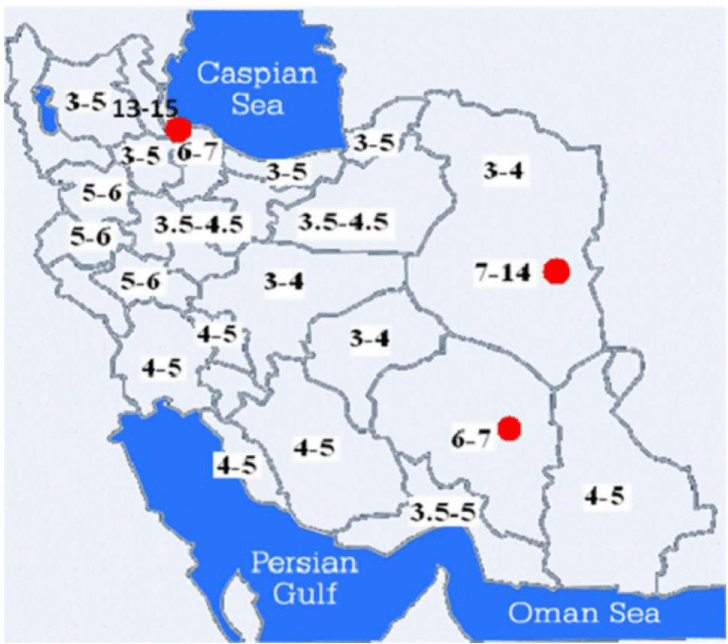
Manjil, Binalood, and Kahak, respectively, generate the most wind power. A map of Iran’s wind potential shows that the country has much room for wind energy. According to available maps, Iran has high potential in terms of wind speed and density (Figure 2) [44]. The country’s geographical features cause the difference in air pressure between Iran’s atmosphere and that of the Indian Ocean and central Asia. This results in cold northerly winds and humid airflow from the Atlantic and Mediterranean from the west during the winter [46]. In contrast to higher pressures in the north and northwest, Iran’s relatively low air pressures give rise to strong airflow during winter and summer [47]. According to calculations of wind energy potential, most of Iran’s provinces can be taken as potential locations for generating these types of energy. On the other hand, wind intensity differs significantly between provinces (Figure 3). The following equation is used to calculate wind energy potential for each province. The kinetic energy of a mass in motion is expressed as follows [48]:
The power in the wind is given by the rate of change of energy:
As the mass flow rate is given by:
And the rate of change in distance is given by:
Hence, from equation (3), the power can be defined as:
The value of Cp is specific to each type of turbine, depending on the wind speed the turbine operates in. Thus, the power extractable from wind is determined as follows:
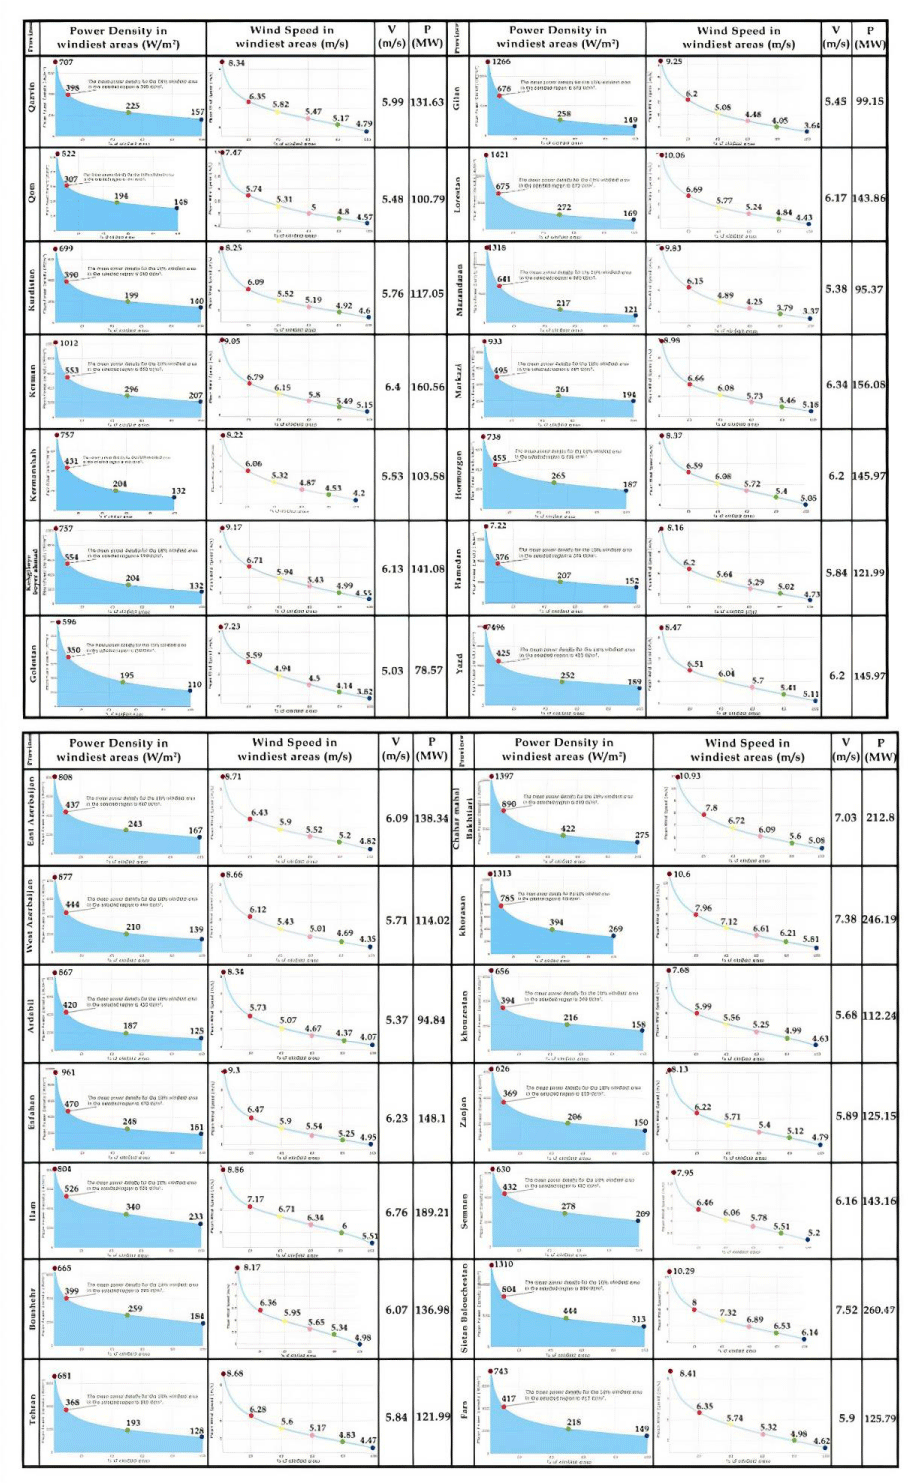
Where r, V, A, T, W, and Cp denote air density (1.225 kgm3), wind speed (m/s), area (m2), time (s), energy (J), and power coefficient, respectively. The quantity of energy extractable by a 100ha plant was measured. Here, P (MW) and V represent power potential and average wind speed in the windiest regions after measuring wind speed at a 50m height and removing winds below the wind speed threshold (4 m/s) for Iran’s 660KW wind turbines. Furthermore, the total area of each province should be considered when calculating its total wind energy potential [45].
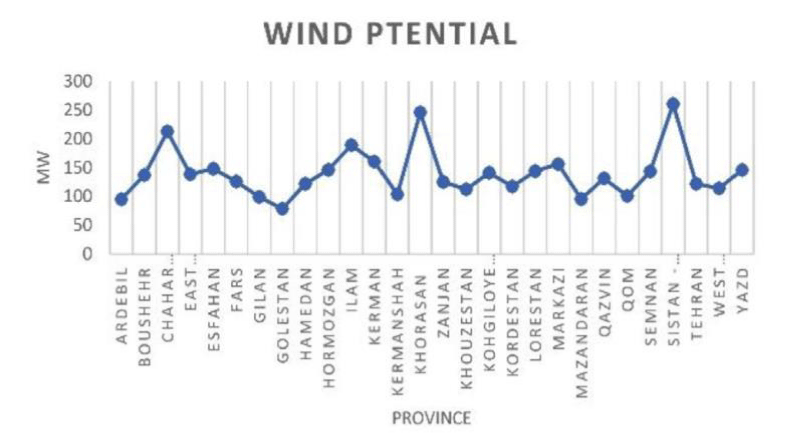
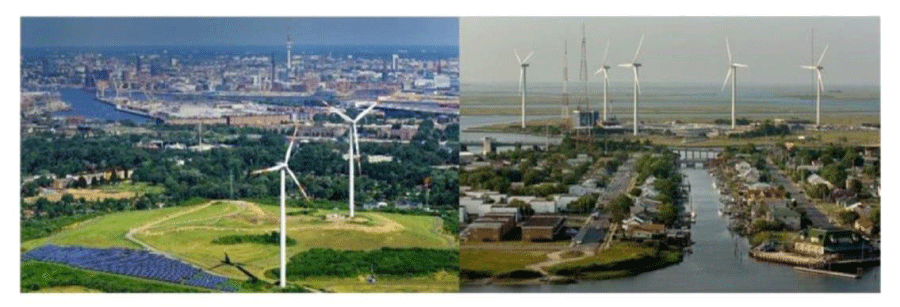
According to the Tables 1, based on current wind energy harnessing limitations, Khorasan and Sistan-Baluchestan provinces have the greatest potential for generating wind energy [49]. As a result, it appears prudent to invest in these provinces to take advantage of their potential. Wind energy potentials in various Iranian provinces are illustrated in Figure 4 separately and comparatively. In addition to generating electricity, the wind energy system can be used to beautify the city to attract tourists (Figure 5). A total of 138.71 MW of power has been produced by 244 wind turbines in 2020.
The estimated mean annual capacity factor of these wind parks is 33%. Variation of wind speed potential in different sites is represented in Figure 6.
Solar energy feasibility
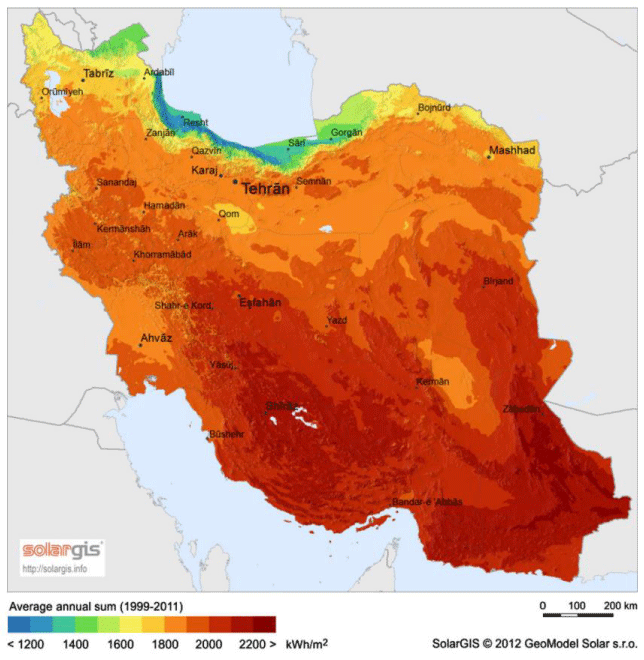
The seasonal/annual average of clearness indices was measured and utilized in the algorithm calculating downward solar radiation (DSR) using data from the IDW interpolation model and 63 Iranian radiation monitoring stations Figure 7. Illustrates a map of the annual average of clearness indices on a provincial scale [51].
Because of their moderate and extremely humid climatic conditions (80%) [46], the provinces along the Caspian Sea shores have a high cloud coverage for most days, according to Figure 6. As a result, their clearness index (KT) is relatively negative. Since they are located close to the Persian Gulf coast, Bushehr and Hormozgan provinces have high water vapor concentrations in most seasons, particularly during hot seasons; thus, the KT is not high in these provinces. Because of their position in dry climatic environments, the KT values for Iran’s central provinces are higher. The seasonal mean of DSR for the entire Iran was determined by integrating the DSR and KT values at the top of the atmosphere [51].
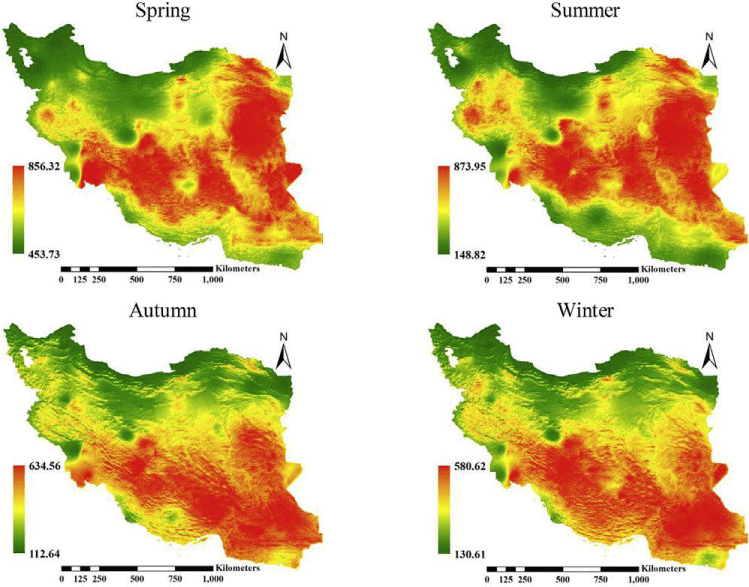
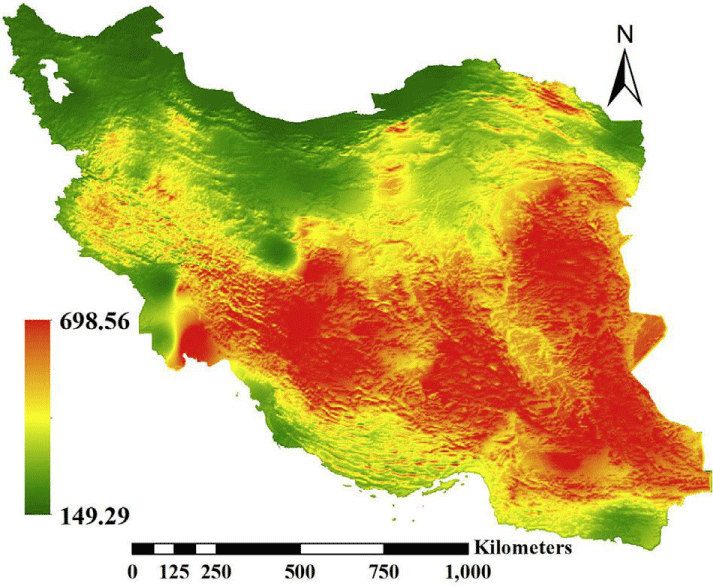
Figure 8 shows that the value of DSR decreases from southern to northern Iran. The key explanation for this is the change in latitude from southern to northern Iran and the higher degree of cloud coverage in the north relative to the south during the year. Furthermore, since eastern areas have a clear sky in most seasons, they receive higher DSR compared to western areas. More of Iran’s regions get less solar radiation in fall and winter because of seasonal variations in Mediterranean winds and sky cloud coverage than in spring and summer. In western Iran, the Mediterranean winds raise cloud coverage and precipitation, decreasing DSR in cold seasons in comparison with hot seasons. Iran’s eastern and southern regions get more solar radiation from the sun than the rest of the country.
Compared to many other parts of Iran, a Khuzestan province section located in southeastern Iran gets much DSR during the year. However, other areas of the province, influenced by dust/cloud phenomena in spring and summer, get less solar radiation. Owing to air dryness and extremely low cloud coverage levels all year round, Iran’s eastern parts, e.g., South Khorasan and Khorasan Razavi provinces, get a high degree of DSR all year long, benefiting from more sunlight hours. Compared to other parts of Iran, Sistan and Baluchistan province in southeastern Iran experiences much DSR in winter. However, due to the effect of Sistan’s 120-day wind)Winds that blow in those areas in the four months of June, July, August, and September(, many regions of this province do not get sufficient solar radiation during the summer. The Sistan wind, which blows 120 days a year, has a big impact on the weather. It raises the amount of dust in the Sistan and Baluchistan province’s atmosphere. Dust quantities in the air and the number of clear days in this province directly correlate with the reduction in incoming solar radiation. Water vapor levels in the air are proportional to the amount of solar radiation received in Iran’s coastal regions. Due to the higher water vapor levels in the air, Iran’s southern coastal areas get less solar radiation in warmer seasons than in the cold seasons in other regions. Iran’s annual average decreasing solar radiation map was evaluated and depicted in Figure 9, in accordance with the average solar radiation in different seasons [51].
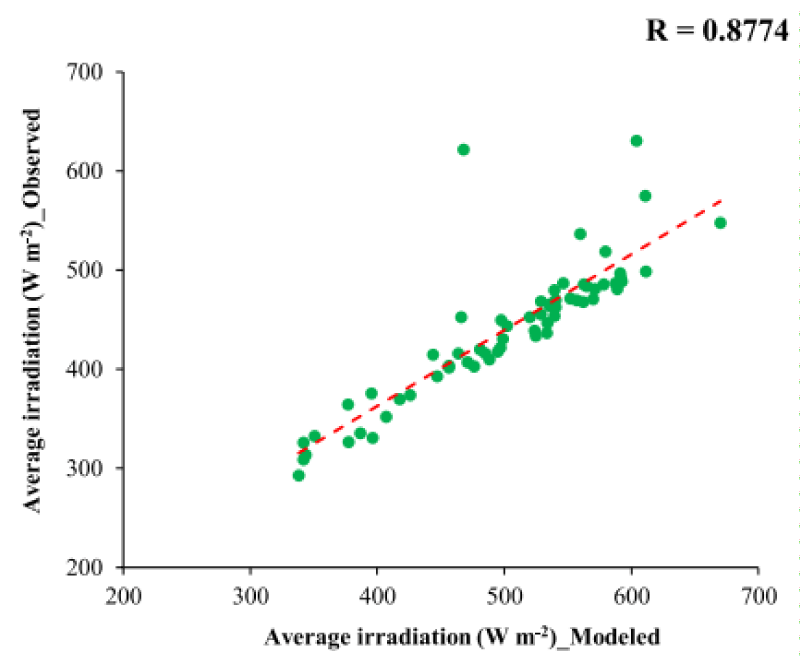
According to Figure 8 and a study of the position of existing solar PV power stations, power stations in the southern half of Iran have a higher capacity for DSR than power stations in Iran’s northern half. A comparison is drawn between the measured DSR by monitoring Iran’s stations and the modeled radiation to determine the replacement coefficient of atmospheric transparency with KT Figure 10. Illustrates this analogy. The findings showed that the DSR modeling for Iran was highly accurate Table 2. Shows the projected yearly DSR for the locations of existing solar power stations.
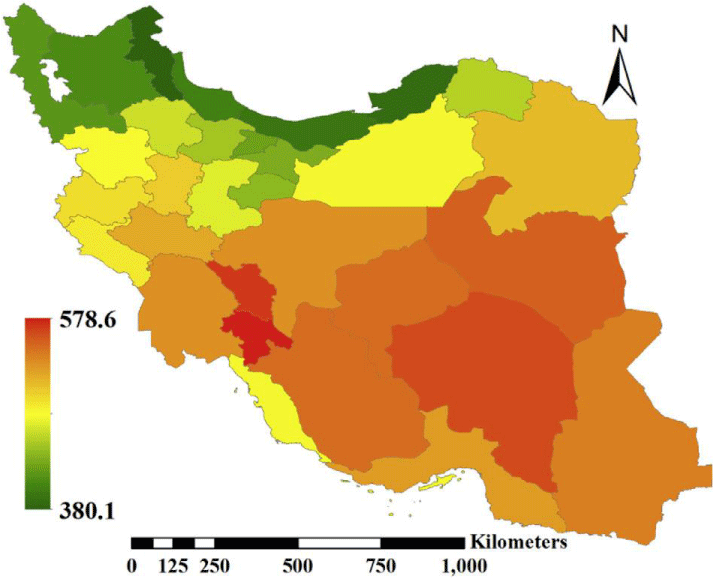
Table 2 shows that PV power stations based in East Azerbaijan, Khorasan Razavi, Markazi, and Tehran provinces, respectively, receive 443.35, 493.83, 495.9, and 443.12 W m-2 of DSR. Solar power stations should be built in areas where solar radiation is at least 500 W m2 [4]. On a scale of Iranian provinces, the annual average DSR was calculated, whose results are presented in Figure 11.
According to Figure 11, Kohgiluyeh and Boyer Ahmad Provinces receive the most DSR, with an annual average total of around 578.6 W m2. Ardabil Province, on the other hand, ranks last with 380.1Wm2. Furthermore, different solar radiation capacity exists in different Iranian provinces, directly related to each province’s climatic, environmental, and geographical conditions. The difference in the volume of electricity produced by PV power stations with the same cost/power structure in various Iranian provinces is due to their heterogeneous DSR capacity. Considering the Iranian government’s existing policy of guaranteeing electricity purchasing in all provinces at the same Feed In Tariff (FIT). The income levels of solar PV power stations in various provinces are different due to receiving different amounts of solar radiation from power plants. Because of the disparity in PV power station income levels, developers are unlikely to invest in provinces with less average solar radiation; thus, solar PV projects are likely to be concentrated in a few areas of Iran. This is in direct contrast to the Iranian government’s goal of exploiting and using renewable energy power stations countrywide [52].
Furthermore, provided the guaranteed FIT and the high DSR capacity of some Iranian regions, we can see a government overpayment to investors’ benefit. That is, the government should ensure the projects’ profitability by lowering FITs in these areas (which have a high DSR potential) while also avoiding overpayment. In light of the Iranian government’s policy of widespread generation and utilization of green energy, including solar energy, in all areas, and the need to avoid government overpayments, electricity FITs must be determined in compliance with the specific climatic and geographical requirements of each country.
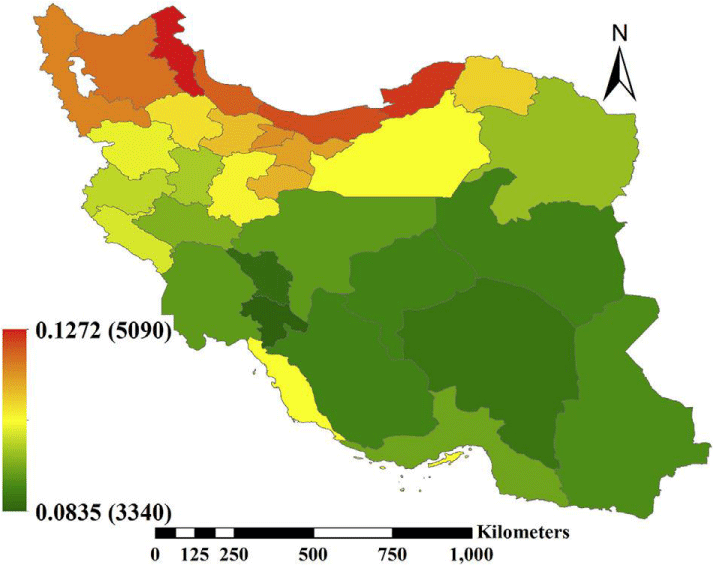
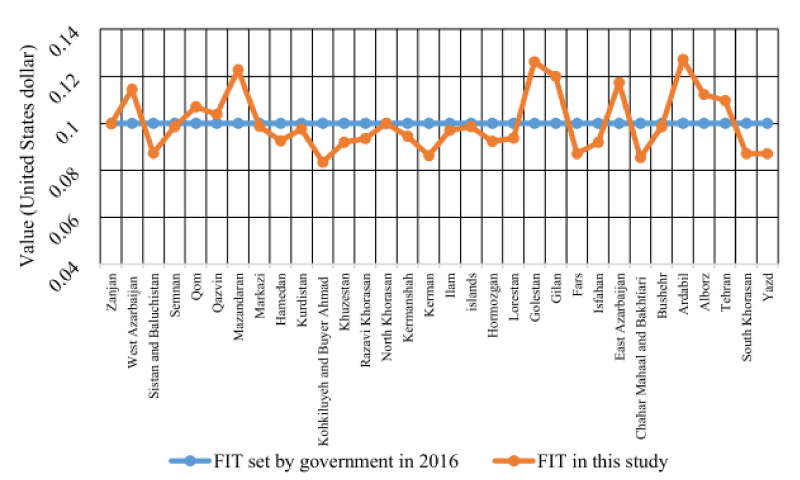
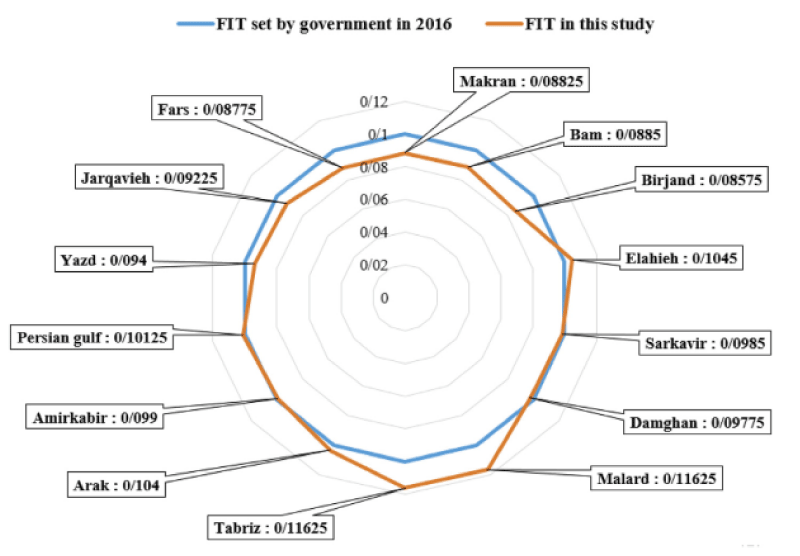
The optimal FIT for buying PV electricity was determined by applying the NPV model, as demonstrated in Figures 12,13 [22].
Figures 12, 13 demonstrate that the modeled optimal electricity price obtained from PV power stations in Bushehr, Kurdistan, Ilam, Markazi, North Khorasan, Qazvin, and Semnan Zanjan provinces is equivalent to the FIT decided by the government. The modeled ideal price for Ardabil, Alborz, East/West Azerbaijan, Golestan, Guilan, Mazandaran, Qom, and Tehran is higher than the government’s tariff. This finding indicates that, given the government’s FIT, solar plants in these provinces are uneconomic, and developers are less likely to invest in these provinces, located in northern Iran. Because the number of sunny days is less than in other provinces due to high cloud coverage levels and a low DSR potential due to their high latitudes. The modeled optimal price in other Iranian provinces, such as Fars, Hamedan, Chaharmahal and Bakhtiari, Hormozgan, Khorasan Razavi, Kerman, Khuzestan, Isfahan, Lorestan, South Khorasan, Yazd, and Sistan and Baluchistan is lower than the government-set tariff. This suggests that the government confronts overpayments for electricity purchased from solar PV power stations in these provinces. Generally, based on the government’s FIT and the results in Figure 12, Kohgiluyeh and Boyer Ahmad and Ardebil provinces are the best and worst places for a solar project to be installed, respectively. The mean optimal price for all Iranian provinces is US $0.1011, equivalent to the government’s FIT for solar PV power station purchases [53].
Finally, the optimal electricity purchase price was determined for Iran’s existing PV power stations (Table 2), taking into account solar radiation potential compared to the government’s FIT Figure 14. Shows the findings.
The results of Figure 13 showed that Hamedan, Khorasan Razavi, Markazi, and Semnan’s optimal prices are exactly the same as the government’s FIT [54]. The Fars, Kerman, Isfahan, South Khorasan, and Yazd power stations were among the most fruitful solar power stations for investors with respect to the value obtained for the optimal price. That is to say, the government has to pay a lot to buy electricity from these PV power plants. And since the government has not yet done so, of the fourteen existing power plants in Iran, only East Azerbaijan and Tehran are economically viable for investors.
Geothermal energy feasibility
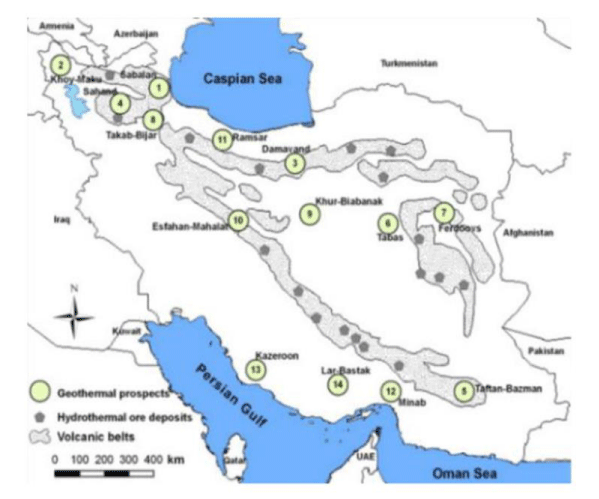
Geothermal energy may be used for a number of uses, including the production of electricity. While hot springs have been used in Iran for ages (for example, in spas and baths), geothermal energy production was only begun in 1975 by Iran’s Ministry of Energy using an exploration program in the country’s northwestern region. Damavand, Sabalan, Sahand, and Khoy-Maku were identified as four geothermal areas with development potential as a result of these investigations [55]. The RE Organization of Iran [43] conducted subsequent exploration studies from 1996-1999, finding ten additional zones, which are shown in Figure 15. In 1995, first Iran’s geothermal power generation project began at the Sabalan geothermal area, where five promising areas had been identified through a series of exploration and feasibility studies [56]. The NW Sabalan geothermal field [57] was chosen out of the five for exploration drilling. Mud pools, hydrothermal alteration, and hot springs are examples of geothermal energy Table 3 [58]. Shows the estimated number of hot springs in each province and the potential product of geothermal energy.
Hot springs
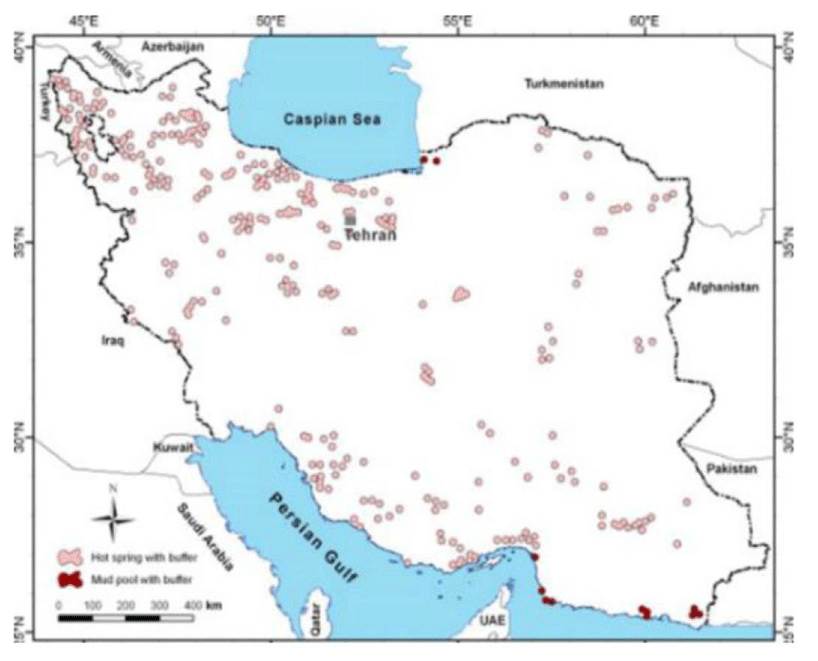
Hot springs are among crucial geothermal activities directly linked to the form and degree of hydrothermal variations. This form of energy could be utilized in structures, pools, and hydrotherapy centers [59]. Iran has 308 hot spring areas [60], the majority of which are in the north and northeast (Figure 15). Iran makes no use of hot springs as a source of energy. Since hot springs are often found in Iran’s cold and mountainous regions, they can be utilized as tourist attractions.
Mud pools
As significant geothermal manifestations, mud pools reveal details about chemical processes, fluid-rock interactions, and near-surface fluid flow [61]. Since much of Iran has a hot and dry climate, using mud pool potentials will contribute to saving energy and attracting mud-therapy tourism [45]. Currently, twelve known pools (Figure 16) in the southern and northeast coastal strips.
Hydrothermal alteration zones
Chemical composition, lithology, permeability, pressure, and temperature of fluids all affect the abundance, presence, and stability of hydrothermal alteration minerals. Geothermal energy is an RE tool that utilizes the earth’s core heat [62]. Direct heat utilization, electricity generation, and ground source heat pumps (GSHPs) are the three primary geothermal energy applications [63]. The majority of locations on the planet, including Iran, will benefit from geothermal energy. Iran is situated on the geothermal belt, so its northern provinces have high potential in this region [64]. Any of these areas’ hot springs exceed temperatures of 86 degrees Celsius. Approximately 9% of the country’s lands have been dedicated to potential geothermal areas, as per a map of digital geothermal potential (Figure 17) from 2007 [65].
Results and discussion
To accurately identify the limitations, barriers, and facilities available for the utilization of energy resources in a country, it is necessary to calculate and evaluate the extent of utilization of existing energy potential and the evolution of renewable energy carriers in a scientific and accurate manner. Iran is among the wealthiest countries in the world for energy resources because, on the one hand, it has extensive sources of fossil and non-renewable fuels, e.g., oil and gas, and on the other hand, it has great potential feasibility for renewable energy. In Iran, 285000 MWh of electricity generation was from nonrenewable sources more specifically 210000 MWh was from natural gas and 75000 MWh was from oil in 2020.
By extracting diagrams from the Iranian simulation model with real data obtained from the reports of the Ministry of Energy in MATLAB software, the renewable energy feasibility, including geothermal, wind, and solar energy, and installed power stations for 20 years, has been drawn and analyzed.
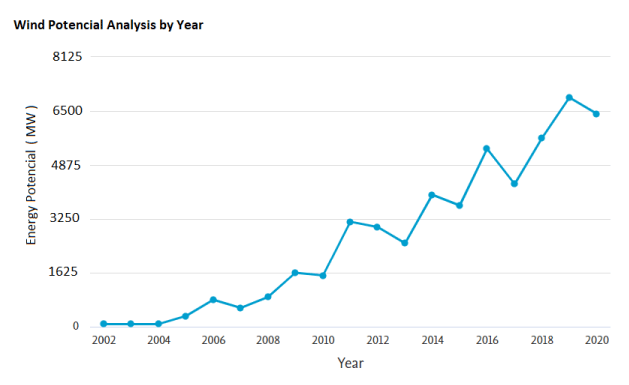
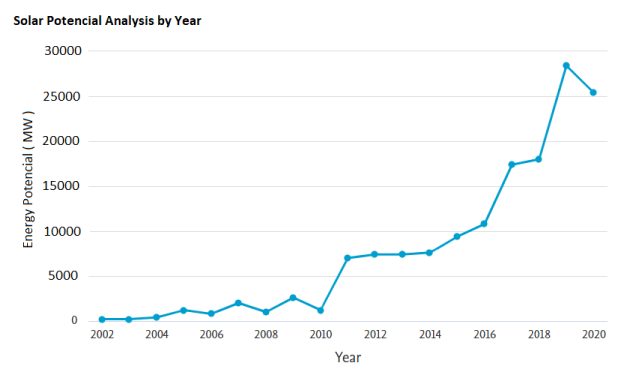
As can be seen from the diagrams of wind, solar and geothermal energy potentials in the above figures (Figures 18-20), in general, with technological advances and the possibility of exploiting these energies and creating demand for them and causing their transition from reserves to resources and as a result, the potential for energy resource estimates has been rising over the years.
In addition to technical and technological analyzes, economic analyzes are also performed for potential measurement. Therefore, technological or technical progress may have been made annually. However, with changes in electricity prices from alternative power stations such as combined fossil fuel power stations and due to changes in world oil/gas prices, and due to the low price of oil/gas in Iran due to their large reservoirs, it is not economically viable to use renewable energy resources, thus reducing their potential in some years ( Chart declination in some years).
Energy potential is calculated using real yearly wind, solar and geothermal information in Iran using the Weibull density equation that can be used in all provinces. Finally, the total wind, solar and geothermal potential in 2020 for Iran is estimated at 6500, 25300, and 9700 MW, respectively.
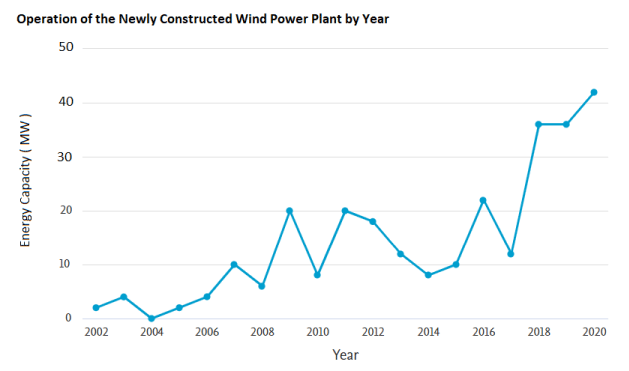
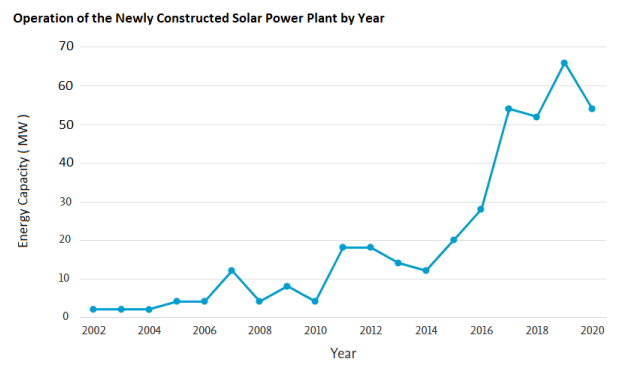
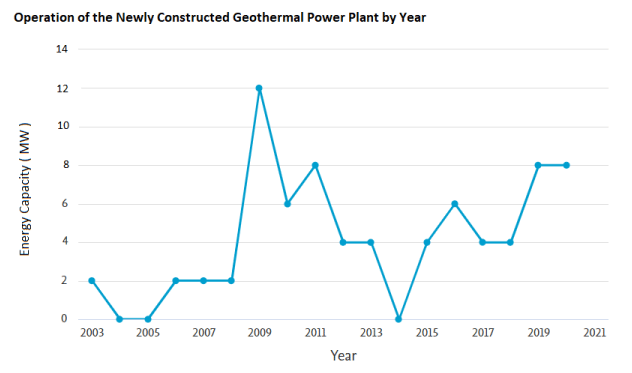
The charts above (Figures 21-23) indicate the new operation of the total number of power stations built each year and have a cumulative nature. For example, the operating capacity of wind power stations built between 2002 and 2003 is 7 MW. In 2004, because a new power station or a new phase of pre-built wind power stations was not operated, the country’s wind capacity in 2004 is the same. It is 7 MW. Regarding the second diagram(Figure 22), which shows the capacity of newly built solar power stations in Iran, for example, in 2017, there was a new capacity of 55 MW. In 2018 we had an increase in operating capacity, but this increase compared to 2017 was less and was about 52 MW. Regarding the third chart (Figure 23), which shows the capacity of newly built geothermal power stations, as shown in the chart, in 2004, 2005, and 2014, there was no construction or increase in the country’s geothermal power stations’ capacity.
The surface below these diagrams shows the cumulative operating capacity of all wind, geothermal, and solar power stations. For instance, the area below the graph of wind, solar and geothermal power stations is 305, 367, and 76 MW, respectively, which shows the total capacity of these power stations in Iran until 2020. The reason for these changes over the years is based on two main factors, first, the energy and carbon taxes according to the international treaties in which Iran has participated like COPs or Paris or Kyoto protocols and the second is subsidies for green and new energies from environmental protection policies, which made the economic justifications of using these renewable energies.
- Jmousavi MS, Ahmadi A, Entezari A. Forecast of Using Renewable Energies in the Water and Wastewater Industry of Iran. New Energy Exploitation and Application. 2022; 1(2).
- Jahangiri M. Feasibility study on the provision of electricity and hydrogen for domestic purposes in the south of Iran using grid-connected renewable energy plants. Energy Strategy Reviews. 2019; 23:23-32.
- Dincer I. Renewable energy and sustainable development: a crucial review. Renewable and sustainable energy reviews. 2000; 4(2):157-175.
- Ahmed S. Exploitation of renewable energy for sustainable development and overcoming power crisis in Bangladesh. Renewable Energy. 2014; 72:223-235.
- Hua Y, Oliphant M, Hu EJ. Development of renewable energy in Australia and China: A comparison of policies and status. Renewable Energy. 2016; 85:1044-1051.
- Owusu PA, Asumadu-Sarkodie S. A review of renewable energy sources, sustainability issues and climate change mitigation. Cogent Engineering. 2016; 3(1):1167990.
- Creutzig F. Catching two European birds with one renewable stone: Mitigating climate change and Eurozone crisis by an energy transition. Renewable and Sustainable Energy Reviews. 2014; 38:1015-1028.
- Ghobadian B. Future of renewable energies in Iran. Renewable and sustainable energy reviews. 2009; 13(3):689-695.
- Zahedi R. Daneshgar S. Golivari S. Simulation and optimization of electricity generation by waste to energy unit in Tehran. Sustainable Energy Technologies and Assessments. 2022; 53:102338.
- Petroleum B. BP statistical review of world energy 2017. Br Pet 2017; 66:1-52.
- Krupa J. Poudineh R. Harvey LD. Renewable electricity finance in the resource-rich countries of the Middle East and North Africa: A case study on the Gulf Cooperation Council. Energy. 2019; 166:1047-1062.
- Haas R. Efficiency and effectiveness of promotion systems for electricity generation from renewable energy sources–Lessons from EU countries. Energy. 2011; 36(4):2186-2193.
- Lior N. Energy resources and use: The present situation and possible paths to the future. Energy. 2008; 33(6):842-857.
- Lund H. Large-scale integration of wind power into different energy systems. Energy. 2005; 30(13):2402-2412.
- El-Katiri L, Husain M. Prospects for Renewable Energy in GCC States–Opportunities and the Need for Reform. 2014.
- Zahedi R. Modeling and interpretation of geomagnetic data related to geothermal sources, Northwest of Delijan. Renewable Energy. 2022.
- Alnaser W, Alnaser N. The impact of the rise of using solar energy in GCC countries, in Renewable energy and sustainable buildings. 2020. Springer. 167-183.
- Coady MD. How large are global energy subsidies?: International Monetary Fund. 2015.
- Stevens P, Lahn G. Burning oil to keep cool: The hidden energy crisis in Saudi Arabia. Chatham House, London, 2011.
- Wagner G, Weitzman ML. Climate shock: the economic consequences of a hotter planet. Princeton University Press. 2015.
- Tofigh AA, Abedian M. Analysis of energy status in Iran for designing sustainable energy roadmap. Renewable and Sustainable Energy Reviews. 2016; 57:1296-1306.
- Firozjaei MK. An integrated GIS-based Ordered Weighted Averaging analysis for solar energy evaluation in Iran: Current conditions and future planning. Renewable Energy. 2019; 136:1130-1146.
- Shorabeh SN. A risk-based multi-criteria spatial decision analysis for solar power plant site selection in different climates: A case study in Iran. Renewable Energy. 2019; 143:958-973.
- Alamdari P. Nematollahi O. Alemrajabi AA. Solar energy potentials in Iran: A review. Renewable and Sustainable Energy Reviews. 2013; 21:778-788.
- Najafi G. Solar energy in Iran: Current state and outlook. Renewable and Sustainable Energy Reviews. 2015; 49:931-942.
- Zahedi R, Golivari S. Investigating Threats to Power Plants Using a Carver Matrix and Providing Solutions: A Case Study of Iran. International Journal of Sustainable Energy and Environmental Research. 2022; 11(1):23-36.
- Forootan MM. Machine Learning and Deep Learning in Energy Systems: A Review. Sustainability. 2022; 14(8):4832.
- Pahlavan S. Assessing the Current Status of Renewable Energies and Their Limitations in Iran. International Journal of Renewable Energy Development. 2020; 9(1).
- Zahedi R. Zahedi A, Ahmadi A. Strategic Study for Renewable Energy Policy, Optimizations and Sustainability in Iran. Sustainability. 2022; 14(4): 2418.
- Zahedi R. Evaluation of Resources and Potential Measurement of Wind Energy to Determine the Spatial Priorities for the Construction of Wind-Driven Power Plants in Damghan City. International Journal of Sustainable Energy and Environmental Research. 2022; 11(1):1-22.
- Agency IE, Birol F. World energy outlook 2013. International Energy Agency Paris. 2013.
- Zhang X, Shen L. Chan SY. The diffusion of solar energy use in HK: what are the barriers? Energy Policy. 2012; 41:241-249.
- Mirza UK. Identifying and addressing barriers to renewable energy development in Pakistan. Renewable and Sustainable Energy Reviews. 2009; 13(4):927-931.
- Nalan ÇB, Murat Ö, Nuri Ö, Renewable energy market conditions and barriers in Turkey. Renewable and Sustainable Energy Reviews. 2009; 13(6-7):1428-1436.
- Mondal MAH, Kamp LM, Pachova NI, Drivers, barriers, and strategies for implementation of renewable energy technologies in rural areas in Bangladesh—An innovation system analysis. Energy policy. 2010; 38(8):4626-4634.
- Verbruggen A. Renewable energy costs, potentials, barriers: Conceptual issues. Energy policy. 2010; 38(2):850-861.
- Zahedi R. Feasibility study for designing and building a zero-energy house in new cities. Solar Energy. 2022; 240:168-175.
- Moosavian SF. Evaluation of research and development subsidies and fossil energy tax for sustainable development using computable general equilibrium model. Energy Science & Engineering. 2022.
- Akdağ SA, Güler Ö, Evaluation of wind energy investment interest and electricity generation cost analysis for Turkey. Applied Energy. 2010; 87(8): 2574-2580.
- Update AM. Global wind report. Global Wind Energy Council, 2017.
- Jiang H. Comprehensive assessment of wind resources and the low-carbon economy: An empirical study in the Alxa and Xilin Gol Leagues of inner Mongolia, China. Renewable and Sustainable Energy Reviews. 2015; 50:1304-1319.
- Zahedi R. Potential measurement of Iran's western regional wind energy using GIS. Journal of Cleaner Production. 2022; 330:129883.
- Dehghani Madvar M. Analysis of stakeholder roles and the challenges of solar energy utilization in Iran. International Journal of Low-Carbon Technologies. 2018; 13(4):438-451.
- Mortensen NG. Global Wind Atlas–validation and uncertainty. in Sound/Visual production (digital), WindEurope Resource Assessment Workshop. 2017.
- Norouzi M, Yeganeh M, Yusaf T, Landscape framework for the exploitation of renewable energy resources and potentials in urban scale (case study: Iran). Renewable energy. 2021; 163:300-319.
- Alamdari P, Nematollahi O, Mirhosseini M, Assessment of wind energy in Iran: A review. Renewable and Sustainable Energy Reviews. 2012; 16(1):836-860.
- Masoomi B. Strategic supplier selection for renewable energy supply chain under green capabilities (fuzzy BWM-WASPAS-COPRAS approach). Energy Strategy Reviews. 2022; 40:100815.
- Daneshgar S, Zahedi R, Farahani O, Evaluation of the concentration of suspended particles in underground subway stations in Tehran and its comparison with ambient concentrations. Ann Environ Sci Toxicol. 2022; 6(1): 019-025.
- Daneshgar S, Zahedi R, Investigating the hydropower plants production and profitability using system dynamics approach. Journal of Energy Storage. 2022; 46:103919.
- Khojasteh D. Assessment of renewable energy resources in Iran; with a focus on wave and tidal energy. Renewable and Sustainable Energy Reviews. 2018; 81:2992-3005.
- Firozjaei HK. On the effect of geographical, topographic and climatic conditions on feed-in tariff optimization for solar photovoltaic electricity generation: A case study in Iran. Renewable Energy. 2020; 153:430-439.
- Ghodrati A, Zahedi R, Ahmadi A, Analysis of cold thermal energy storage using phase change materials in freezers. Journal of Energy Storage. 2022; 51:104433.
- Nosratabadi SM. Economic evaluation and energy/exergy analysis of PV/Wind/PEMFC energy resources employment based on capacity, type of source and government incentive policies: Case study in Iran. Sustainable Energy Technologies and Assessments. 2021; 43:100963.
- Zahedi R. Numerical simulation of combustion of sulfide-biomass concentrate ingredients and contaminants in copper furnace smelting. Future Energy. 2023; 2(1).
- Hosseini SE. A review on green energy potentials in Iran. Renewable and Sustainable Energy Reviews. 2013; 27:533-545.
- Noorollahi Y. Review of two decade geothermal energy development in Iran, benefits, challenges, and future policy. Geothermics. 2019; 77:257-266.
- Seyedrahimi-Niaraq M. Development of an updated geothermal reservoir conceptual model for NW Sabalan geothermal field, Iran. Geothermal Energy. 2017; 5(1):1-22.
- Yousefi H. Cascading uses of geothermal energy for a sustainable energy supply for Meshkinshahr City, Northwest, Iran. Geothermics. 2019; 79:152-163.
- Noorollahi Y. GIS model for geothermal resource exploration in Akita and Iwate prefectures, northern Japan. Computers & geosciences. 2007; 33(8):1008-1021.
- Ahmadi S. Assessment of hydrochemistry and heavy metals pollution in the groundwater of Ardestan mineral exploration area, Iran. Environmental earth sciences. 2018; 77(5):1-13.
- Khazaee M. Assessment of renewable energy production capacity of Asian countries: a review. New Energy Exploitation and Application. 2022; 1(2):25-41.
- Barbier E. Geothermal energy technology and current status: an overview. Renewable and sustainable energy reviews. 2002; 6(1-2):3-65.
- Lund JW, Toth AN, Direct utilization of geothermal energy 2020 worldwide review. Geothermics. 2020; 101915.
- Zahedi R. Development of a New Simulation Model for the Reservoir Hydropower Generation. Water Resources Management. 2022; 1-16.
- Mollahosseini A. Renewable energy-driven desalination opportunities–A case study. Journal of environmental management. 2019; 239:187-197.
- Yousefi H. Developing the geothermal resources map of Iran. Geothermics. 2010; 39(2): 140-151.
Article Alerts
Subscribe to our articles alerts and stay tuned.
 This work is licensed under a Creative Commons Attribution 4.0 International License.



 Save to Mendeley
