Archive of Biomedical Science and Engineering
Parametric study for optimizing winglet efficiency and comparative analysis of aerodynamic performance of a wing with no winglet and with different types of winglets for lighter aircraft
Georgia Panagi*
Cite this as
Panagi G (2021) Parametric study for optimizing winglet efficiency and comparative analysis of aerodynamic performance of a wing with no winglet and with different types of winglets for lighter aircraft. Arch Biomed Sci Eng 7(1): 005-021. DOI: 10.17352/abse.000024Aircraft performance is highly affected by induced drag caused by wingtip vortices. Winglets are wing tip extensions and are used to minimise vortices formation to improve fuel efficiency. They are usually used in heavier transport aircraft due to higher operation costs and higher fuel consumption due to higher range missions. The research conducted for this thesis was used to investigate if the use of winglets in lighter low speed aircraft is beneficial in any way in terms of aerodynamic efficiency. This project includes a subsonic wind tunnel experiment used for validation of Computational Fluid Dynamics (CFD) analysis, performed on a fixed rectangular wing of a NACA 653218 aerofoil and a 3D printed blended winglet. The objectives of the analysis were to compare the aerodynamic characteristics of rectangular wing with different types of winglets and perform a parametric study to modify the winglets in order to optimise efficiency and reduce fuel consumption, as well as investigate the effects of surface roughness on the turbulent boundary layer. The wind tunnel experimental analysis was performed at sea-level conditions. The CFD simulations were performed at low subsonic flow in ANSYS CFX using Finite Volume Method, replicating the wind tunnel closed-loop conditions. The cfd findings were compared to existing data and to wind tunnel results. The investigation results indicate that the modified winglets designed for optimization, significantly affect the aerodynamic efficiency compared to traditional winglets or no winglets and were estimated to produce an approximate increase in lift to drag ratio of 40% using a modified winglet. A specific shape of curved winglet was found to be very effective at redirecting flow away from the wing and further research is recommended in this type of curved winglet .The effects of the surface roughness on the turbulent boundary layer are recommended for investigation as were not able to be completed due to campus laboratories lockdown.
Abbreviations
AOA: angle of attack; Re-Reynolds number; TE: Trailing Edge; LE: Leading Edge; Cl: Lift Coefficient; Cd: Drag Coefficient; L/D: Lift to Drag Ratio; BL: Boundary Layer; Labs: Laboratories; Cl/cd: Lift to Drag Coefficient Ratio
Introduction
By 1950, oil had become one of the main energy sources in the United States and was the only fuel source used in air transportation. During the 1970s, oil embargo and oil price had soared thus causing aircraft manufacturers, to find new ways of reducing fuel consumption due to the new high cost.
Winglets have been studied long before the oil embargo in the late 70s by many scientists. However, the first researcher that first developed wingtip devices was Whitcomb, whose breakthrough research managed to lead many aircraft manufacturers to incorporate winglets and to this day, remains one of the most innovative ideas in aviation, considering most of the transport aircrafts nowadays use wingtip devices.
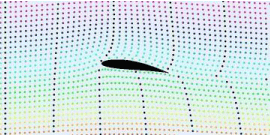
Airplane wings are shaped in a particular way, to make air move faster over the top of the wing and slower over the bottom, like shown in Figure 1. When air moves faster, the pressure of the air decreases according to Bernoulli’s principle and therefore the pressure on the top of the wing is less than the pressure on the bottom of the wing. The high pressure at the bottom pushes the wing upwards creating what is known as Lift. However, the inequality of pressure causes the air particles to move towards the low-pressure area, consequently causing air to swirl at the wingtips, which creates a wingtip vortex. This phenomenon is called induced drag or downwash, which causes energy loss, increases drag and creates a downward force on the top of the wing, thus requiring more lift to counteract the downward force and more thrust to counteract the induced drag, resulting in higher fuel consumption. Winglets increase the aspect ratio of the wing while keeping the surface area relatively low which increases lift generation, and redirect the surrounding flow minimising vortices. Since using winglets reduces the intensity of the wingtip vortices, less energy is lost from the air rotating outwards, which results in more thrust being available, while using the same amount of fuel. Improved winglet efficiency enables more payload capacity, reduces fuel consumption while increases cruising range which all result to lower operating costs. The research conducted in this thesis, could have a potential impact on environmental sustainability, since fuel efficiency will result to reduced harmful greenhouse emissions.
Global pollution caused by aviation, only accounts for a small percentage of global pollution levels however, what is causing concern is not the amount of carbon emission that is released during flight, but the way that the emissions are released, which is mid-air while flying therefore, polluting the atmosphere both locally and globally .Besides greenhouse gas emission, aircrafts also release air vapor, which is composed of air in the form of ice crystals. The air vapour by its very nature is not harmful,
However as aircrafts fly up to the stratosphere which is a dry air region, air vapour emissions are polluting the atmosphere by contaminating the dry air particles with moist particles that turn into long exhaust plumes [2]. This phenomenon is called contrail, and it worsens the climate change, by trapping heat inside the atmosphere. Therefore, there is a great concern about how aviation is involved in the increase of global warming the last decades. Various winglet efficiency experiments have been conducted over the last couple of decades but mainly for transport aircraft due to the higher costs affiliated with heavier aircrafts. Currently there is a trend on research for development of lighter air vehicles like automated unmanned aerial vehicles (quadcopters) or electric aircrafts. But according to studies, electric or fully automated air vehicles will probably take decades of studying and testing until they are commercially used .Therefore, there is potential improvement in increasing efficiency of current light aircrafts like gliders or four seated fixed-winged aircraft like the Cessna 172. Typical glider and Cessna cruising speeds range from 30 to 65 m/s, respectively. Therefore, this research is conducted to fill this gap in current research concerning the use of winglets for optimized performance and fuel efficiency for light, low speed air vehicles. Different angles of attack will be tested as well as different speeds ranging from 30 to 65 m/s in order to test the applicability of this research on the aircrafts mentioned. Project methodology, data gathering and results analysis will be discussed in detail over the next chapters.
Research questions
• This project was conducted to investigate the following research questions.What are the effects of different winglets on lighter aircraft efficiency?
• Which winglet parameters have the greater impact on overall efficiency?
• How does surface roughness affect the turbulent boundary layer?
In order to properly answer the research questions both experimental and numerical approaches were used in order to identify the most efficient winglet that could be used in lighter aircrafts.
Aims and scope
The main objectives of this project were to identify the key parameters that influence winglets’ efficiency through comparative and quantitative analysis of different types of winglets in order to provide better aerodynamic performance for lighter aircrafts. If aerodynamic efficiency will be achieved then consequently fuel efficiency will also be achieved resulting in lower operating costs and lower environmentally harmful emissions. This research was not conducted for heavier type aircrafts like Boeing or Airbus but for gliders or low speed aircrafts like Cessna 172. This study is mainly concerned in lift to drag ratio because of the tendency of Drag to increase with lift. Therefore, higher lift does not always signify better performance as could produce very high drag as well. Hence, the optimum measurement of greater performance is lift to drag ratio and this would be referred to as aerodynamic efficiency in this thesis.
To answer the research questions, the project was divided into stages involving CFD simulation and Wind tunnel testing.
Project management
This project was managed over a 7 month period from September 2019 to April 2020 and was first managed according to the initial project Gantt chart that was submitted on November with the Initial project concept proposal. That was prepared in the early stages of the project summarizing all the required tasks and meetings and their respective timescale estimation to successfully complete this project. However, as the project progressed some of the tasks that were listed in the initial plan were no longer feasible. Some implications were revealed in some point of this project which resulted in changes being added to the final project plan. The updated and final version of the project Gantt chart was produced in March 2020 (Appendix A). It includes the critical path in which the co-dependent tasks can be observed as well as the project milestones. All the tasks were successfully completed, which are in green colour, except the tasks which are in light blue colour. 3D printing the modified winglet was not completed due to student budget limitations (around £300). The cost of 3D printing a winglet with the chosen dimensions was not taken into consideration in the initial project plan. Consequently , a choice was made, based on tasks prioritization and time limitations, to 3D print the blended winglet which was already designed at the time and therefore a second wind tunnel test using the modified winglet was not conducted .During the viva, a suggestion from the project supervisor was taken into consideration and added to the project plan, which was to investigate the effect of the surface roughness of the modified winglet on the turbulent boundary layer . The literature review was conducted in order to find ways to achieve this but due to recent unforeseen circumstances (corona virus pandemic)the wind tunnel test and CFD numerical simulation were not conducted since the computer labs as well as the testing labs closed down due to national lockdown on March 17. These are tasks were numbered in the Gantt chart as 43, 51 ,52 and 53 respectively. After the lockdown, a contingency plan was used to complete the rest of the parametric study at home using a limited student ANSYS licence, resulting in compromised mesh quality and limited turbulence model solvers. The use of the logbook was found to be useful as every meeting with the project supervisor and lab technicians which were arranged every month, were all recorder as well as any notes and calculations that were used for the CFD simulation. It is also evidence that the project complies with the UK -Spec requirements (shown In a matrix form in Appendix C) as it shows professional commitment, leadership and inter-personal skills that were acquired during this 7 months research. However, while the communication and overall management in later stages of the project was very methodical and well organized,it is worth mentioning that some tasks needed to be done multiple times due to poor communication with the laboratory staff as well as budget and facility limitations in the first stages of the project. The risk management associated with this project include resource availability which was managed by informing lab technicians at an early stage about the project technical aspects to ensure materials would be available when needed as well as wind tunnel time allocation to prevent any time delays in testing .The key resource used for this project was computing power including ANSYS licence, which was located in the 24 hours unrestricted access computer labs on campus. Since, unrestricted access was granted at any time needed, a proper risk management plan was not developed as a risk of unavailable computer was low and hence the risk assessment has not changed from the initial one submitted in November (Appendix A), which mainly consists of wind tunnel risks like proper usage of wind tunnel equipment as well as usage of protective gears for the ears . Ultimately, a part of the simulation as well as testing was not completed in campus, due to the current unforeseen pandemic of coronavirus outbreak. Although, even if a proper risk assessment plan was developed at an early Stage, it would not have been sufficient to mitigate the problem of campus lockdown since these unforeseen circumstances are a global issue.
Literature review
The work involved in this project is focused on decreasing harmful gas emissions by increasing the aerodynamic efficiency of low speed light aircraft using winglets. This involves understanding the nature of winglets as well as possible factors effecting the aerodynamic behaviour of the wings during flight . The aerodynamic behaviour i3s usually studied through two methods, experimental testing as well as numerical modelling using mathematical modelling. These two methods were researched as well as winglets and flow behaviour in order to answer the research questions and aims that were set out to be achieved.
Winglet studies
Comprehension of flow behaviour around aerofoils is critical in using CFD for analysing and designing winglets. Bodies that move fast enough, create separation of the surrounding flow as well as turbulent wakes. These affect the aerodynamic capability of an aircraft and hence why is vital to understand these flow mechanisms.
Blended winglets are modern upward curved wingtips that are usually used in civilian transport heavy aircrafts. A study was conducted in which he optimised a winglet designed and performed a parametric study and found that the most dominant parameters effecting the aerodynamic behaviour of the winglet were the cant angle as well as the span [3]. Another study was conducted on the effects of winglet parameters on the overall effectiveness of the in which it was found that the aerodynamic efficiency reduction was linked with cant angle increase while toe angle had no effect in aerodynamic behaviour winglet [4]. An investigation was conducted for raked winglets which are small swept wingtips. The findings of this study [5] resulted in increase in lift to drag ratio of 25 using RANS and S-A turbulence models.
Boundary layer separation
The aerodynamic capability of an object is linked to the boundary layer formed around the object and its point of separation.
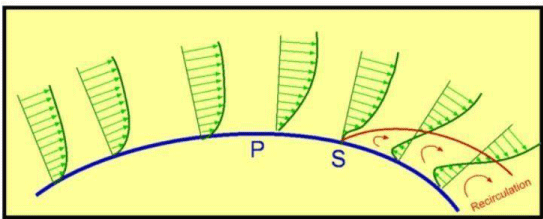
The shape of the boundary layer is highly affected by pressure gradient. The pressure gradient changes over an objects body due to flow moving over different curvatures at the body’s surface, in this case, a wing’s maximum thickness point. In this region, as the mainstream flow is accelerating up to the point of maximum thickness, the curvature of the body causes the flow lines to curve, and in order to equilibrate the centripetal forces, the flow accelerates and the fluid pressure drops. Up to this point the pressure gradient is negative, which is called favourable pressure gradient [6]. Once the flow moves beyond the point of maximum thickness, the curvature of the body is less effective at directing the flow in curved streamlines due to the open space downstream. Hence, the curvature in the flow reduces and the flow decelerates, the pressure gradient becomes positive as the pressure increases, turning the previously favourable pressure gradient into what is known as adverse pressure gradient. If the adverse pressure gradient acts over an extended distance, the deceleration in the flow near the wall will be sufficient to reverse the direction of flow in the boundary layer. The boundary layer develops a point of inflection as shown in figure 2, known as the point of boundary layer separation. For aircraft wings, boundary layer separation can cause significant consequences ranging from rise in pressure drag to lift loss, known as aerodynamic stall.
Effects of Re in separation
Reynolds number is a dimensionless quantity that measures the ratio of inertial forces to viscous forces of a fluid. This is used in fluid mechanics to predict flow behaviour. When the viscous forces are stronger than the inertial forces , they are enough to keep all the fluid particles in smooth lines resulting in parallel looking lines with no interchange of fluid particles between individual streamline layers, then the flow is laminar as seen in figures 3,4. This usually occurs at very low fluid speeds that result in Reless than 50 000 [8]. However, when the inertial forces dominate, the fluid particles are moving in irregular patterns creating eddies. This occurs at relatively high fluid speeds, resulting in Re higher than 100,000.
The process at which the flow patterns interchange can be explained using Figure 5 [9]. When the fluid speed becomes significantly high reaching a Re higher than 100 000, then the wake region moves forward as flow lines separate from the body’s surface following the turbulent boundary layer resulting low pressure difference and low pressure drag as seen in Figure 5, example E [10].
Separation can occur at either laminar or turbulent flow however, one of the two flow patterns delays the point of separation due to the pressure gradient which is one of the main factors influencing the point of separation. When a turbulent boundary layer enters a region of adverse pressure gradient, it can persist for a longer distance without separating compared to a laminar flow. This is due to the higher existing momentum near the wall and its continuous replenishing by turbulent mixing. Therefore, some winglets and wings are often design in such way that would result in higher Re number and hence turbulent flow because of laminar boundary layer’s inability to damp out disturbances and therefore inability to delay separation. A study was found (Syahmi & Hakim, 2018) which investigated the flow separation at three different Reynolds numbers which are 1E+6, 3 E+6 and 4E+6 using pressure distribution method and flow visualization. The experiment was conducted in Low Speed Tunnel. The pressure distribution is done on three different wingspan, which are 40%, 50% and 70%m of span and was measured and plotted to observe the flow characteristic at angle of attack from 0° to 35° for all three different Reynolds numbers. The flow visualization method was done at 30m/s airspeed from 0° to 18°. It is concluded that the Reynolds number of 1E+6 separates at 16°; Reynolds number of 3E+6 separates at 18° and Reynolds number of 4E+6 separates at 20°.This was used as a guidance to use Re higher that 4E+6 so that it resists adverse pressure gradient as angles of attack up to 20 degrees will be used.
Computational fluid dynamics
The best performing CFD code for low subsonic speeds of M lower that 0.2 has proven to be the Spalart- Allmaras turbulence model as suggested in studies (ES & OE, 2016) and was found to be slight more accurate than standard k – ε models. For lift coefficient, it is found maximum error by Spalart-Allmaras model about 12% lower than other turbulence models. For drag coefficient, it is found maximum error by Spalart-Allmaras model about 25% lower than other turbulence models. K-ε models ,are easier to converge and don’t have any restrictions in CFX.
Another study that analysed different winglet types using different turbulence models suggest that k- ε model was the better one in terms of lower power intensity as other models were found to be more power intensive requiring significantly greater computational time while both provide similar flow resolution [11]. It also concluded that the winglets performed better at cruising aoa with cant angles ranging from 45˚ to 60˚.
A study conducted on different winglet aspect ratio has found that all winglets provide improved aerodynamic efficiency , but winglets with high and low aspect ratios performed averaged as opposed to the one winglet with optimum aspect ratio which performed significantly better [12]. It was also suggested to used multi-tip end on the winglets as they improve lift generated.
A study investigating the difference between grit size in lift and drag coefficient results of a NACA653218, in which grit size ranged from 500 000 elements to a million. It was concluded that while higher number of elements resulted in greater accuracy of results, the suggested minimum element size was found to be around a million. It also tested different turbulence models resulting in error of S-A model around 25% less then other models like standard k-ε or RNG k-ε models [13].
A simulation analysis on raked winglets of 30˚ and 45˚ swept angles resulted in an average of 15% increase in lift coefficient at low angles of attack as well as considerable reduction in wing tip vortex [14].
According to (Tuling ,2019) the structure of the turbulent BL categorised into three areas .One the viscous sub-layer, in which molecular viscosity is higher then other forces .The buffer region, in which molecular viscosity and Reynolds stresses are equal and fully turbulent region, in which Reynolds stresses In the latter case the height of the wall is of magnitude of 50 to 100. Therefore, the wall height that was used for the cfd simulation was 100.
Research methodology
Stage 1: Numerical simulation
Computational Fluid Dynamics or CFD in Ansys, was used to conduct a comparative analysis between the rectangular wing as well as the different types of winglets by simulating their aerodynamic performance .Other software could have been used like STRAR CCM+, but Ansys was preferred due to previous experience as well as literature review findings. The main objectives of the simulation are pressure plots showing pressure distribution over the wing as well as lift to drag ratio, representing the aerodynamic efficiency. These are used in order to assess the aerodynamic efficiency as well as the downward force applied on the top surface of the wing. The different models that were used for the simulation were designed according to aerofoil dimensions collected from the literature review, as a means of validation. The simulation conditions were also as similar as possible to the wind tunnel experimental setup. This is done in order to be able to verify the simulation results and to produce high quality comparative analysis in the sense that the results from each method must be theoretically identical. However, in real life situations, the results of the two testing methods are certainly expected to differ as CFD simulation’s solution accuracy depends on the accuracy of the model’s mesh as well as boundary conditions measurements, computing power and time. This is the main reason that wind tunnel testing is used as a validation method as it is closer to real life flight. While this investigation aims for high similarity between the two method’s results, this is quite challenging to achieve. From literature review findings, the best turbulence model to use would be Spalart- Allmaras in Fluent. However, fluent is very limited in student licenses, therefore if for any reason campus computers with educational licenses could not be used, the software could not be accessed from a personal computer with a student license. This is the main reason that CFX was used instead of Fluent, even though it does not include so many turbulence models like SA. The cfd analysis was first used for comparison of performance between a rectangular wing without winglet and comparison of different types of winglets’ performance with aoa ranging from 0,4,8,10,12,14, 20 degrees and for speeds 30,40,45,65 m/s. Different angles of attack were tested in order to analyse in which flight phase are the winglet performing better, if the winglets perform better at lower angles of attack indicate that the winglets are more efficient in cruise while higher angles of attack indicate better performance in take-off. The wide variety in speeds were tested in order to analyse the applicability of this research in the two types of aircraft mentioned, gliders or single engine type aircrafts like the Cessna 172 which have different speeds. Then a parametric study was conducted changing one parameter at a time while keeping the other parameters the same, in order to analyse which parameter effects the aerodynamic efficiency the most and how it is affected.
Stage 2: Experimental testing
Experimental testing was required for verifying and interpreting results from stage 1 which is CFD simulation therefore, same model dimensions were used for results comparison of the two testing methods. From literature review findings for better aerodynamic performance, higher Re number is preferable. For this reason, the wing needed to be as big as possible since the university’s wind tunnel is subsonic and the maximum speed that can be achieved is 45 m/s, therefore the chord needed to be as big as possible but considering the wind tunnel test section space limitations, the maximum dimensions chosen for the wing were 400 mm for chord and 900 mm for span . These were the initial dimensions chosen for the models used both for manufacturing and cfd dimensions. However, these were changed a few times due to other limitations like 3d printer could only print maximum 290mm in height or the model could be split and printed in parts using a dovetail joint. However due to budget limitations this was not possible, therefore the final dimensions were changed to 290mm chord which is considered as the maximum height in 3D printing software. A wind tunnel testing the modified winglet was not conducted due to budget limitations as second winglet could not be manufactured due to budget limitations. Another wind tunnel test would was also planned for investigating the effects of surface roughness using the same winglet for the first test ,but modified in order to make the surface as smooth as possible ,but was not conducted due to campus laboratories closure due to national lockdown [15-20].
Long term implications of project
The technical aspects of this research involved 3D printing thermoplastic which is manufactured from non – renewable sources and releases toxic gases in the process. It is also non-biodegradable and can only be recycled under specific conditions. Other materials could have been used like PLA since it is made from corn starch and hence is compostable and more environmentally friendly but was not available to use. ABS printing also involved high costs. However, other manufacturing methods would be used for light aircraft winglets which would involve higher costs, nonetheless the fuel costs savings due to better performing wings, would certainly overcome the manufacturing costs over a time period. This investigation could have a substantial impact in environmental sustainability well as cost efficiency in lighter aircraft as higher aerodynamic performance means less fuel is used for the same range mission. Higher aerodynamic efficiency is mathematically represented as higher Cl to Cd ratio, therefore increased range missions could be achieved using the same or less amount of fuel, which results in lower polluting greenhouse gas emissions. This is based on Breguet’s formula seen in figures 5,6, in which Range is directly proportional to Cl to Cd ratio.
Technical content
Stage 1: Computational fluid dynamics simulation
CFD simulation was conducted to simulate the aerodynamic performance of different types of winglets during flight, using CFX in ANSYS version 19.2. The first step is the design process of models using CAD software and imported in ANSYS for numerical analysis. The numerical analysis is usually split into 3 stages of pre-processing, computation, and post processing. Pre-processing is the first stage and involves geometry setup for mesh generation, computation involves turbulence modelling using energy conservation which is applied using a controlled volume approach. The energy equation is primarily derived from the first law of thermodynamics as seen in equation 5.
Equation 5. Energy conservation
Design
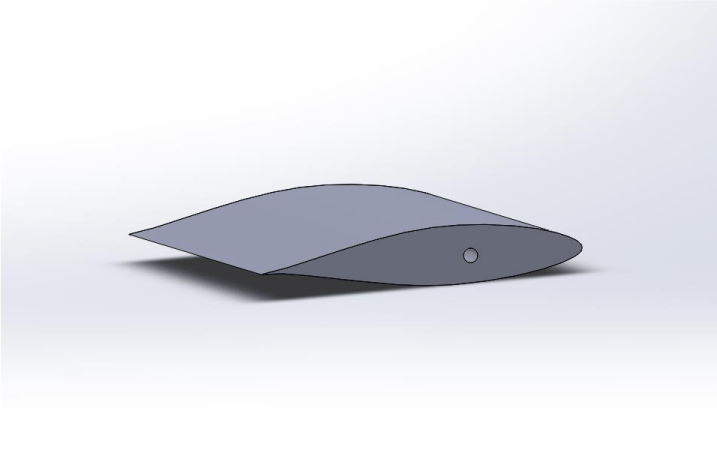
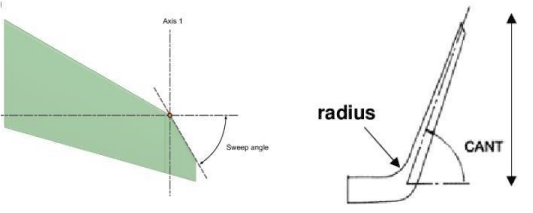
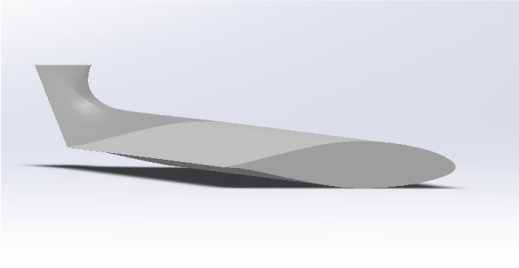
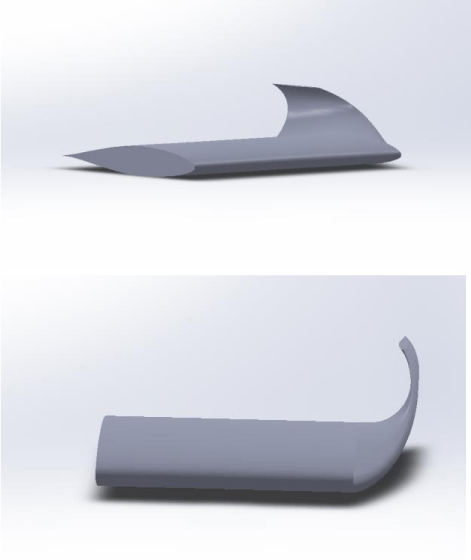
The cad models were designed in Solid works using a NACA 653218 aerofoil due to existing data on this aerofoil found in literature review for comparison .A rectangular wing was designed (figure 7) with dimension based on wind tunnel limitations and remained the same for every winglet variation in order to analyse the aerodynamic behaviour changes based solely on the effects caused by the different winglet types. The different variations of winglets were designed with a similar surface area and same chord, but have different parameters such as curviness, cant angle and vertical height. The other two winglets that were design for comparison with existing data found from literature review, were the blended winglet with 45˚ cant angle and the raked winglet with 45˚ swept angle (figure 8). Cant angle is referred as the vertical angle between the wing and the winglet height and sweep angle the backward angle between the wing’s and the winglet’s ends (explained in figures 8-10).
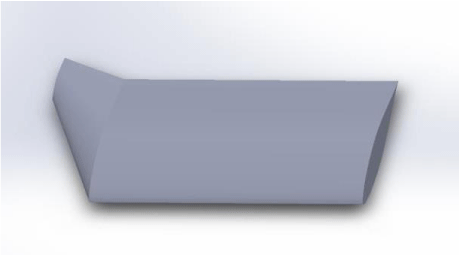
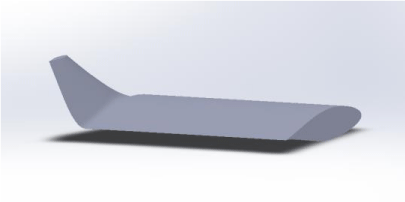
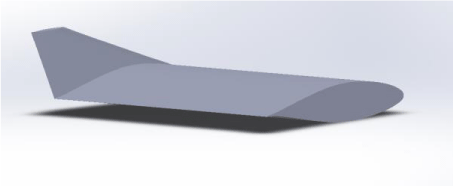
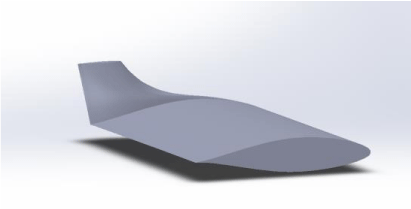
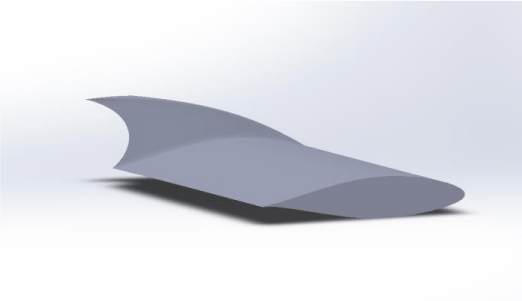
Following the analysis, the modified winglets were designed based on the best performing winglet which was found to be the blended, modifying the cant angle into 60 ˚and 70 ˚ as well as changing vertical distance and back shape (as seen in figures 11,12). Other shapes were created from the idea that smaller surface area could result in higher lift coefficient but would also increase drag coefficient as well, so presumably it would not make a significant difference in lift to drag ratio. However, modifying the shape of the winglet in a way that affects the air streamlines by redirecting the flow outwards away from the wing, therefore resulting in possible downwash decrease on the upper surface of the winglet .In order to achieve this, sections of the winglets were cut out in semi – circle shapes either at the front or back of the winglets (se0.9e figures 13-15), resulting in smaller surface area but the main objective was to analyse the effects of different sections of curved surfaces on downwash.
Pre-processing
Geometry: The CAD models were imported in CFX Design Modeler in order to create a certain geometry around the CAD model to simulate the wind tunnel, as CFD simulation was planned to be experimentally validated in this facility. Therefore, an enclosure was used to create a replica of the wind tunnel testing section according to the wind tunnel’s schematic diagram (Appendix D) with dimensions of 7 ft width, 5 ft height and 25 ft length. A second enclosure was also created with smaller dimensions near the wing, in order to capture fluid movements closer the wing with greater and finer detail as opposed to the first enclosure which is quite big. This would significantly minimise simulation computation time. The wing was subtracted from the wind tunnel enclosure using a Boolean function, creating a single geometric model.
Mesh generation
The quality of the simulation is dependant in mesh quality and setup settings. In order to increase the simulation’s accuracy equation 4 was used for the estimation of the required element size for each geometry’s mesh. Where Δy represents the first cell height near the wall, L the characteristic length, y+ the non-dimensional distance to the wall from centroid and REL is Re using characteristic length of domain.
Equation 4. First cell height (Support team, 2014)
The wind tunnel’s Re was calculated to be 6.17E+6(Appendix E), a y+ value was assumed based on literature review, and domain characteristic length of 2.15m. This yields to element size of 9mm but this was found to be way too small as meshing errors occurred for cell volume exceeding the minimum value and hence different values were used and the final one was 0.04 m and in some other cases 0.035.The boundary layer thickness was also calculated at 36 mm (Appendix E),but different value was used at some cases. It is worth mentioning that the main mesh settings were not the same for each model due to different types of cad geometries. The main reason behind this, is that some of the settings were not applicable in all cases and hence errors like intersecting mesh geometry occurred. Therefore, a variety of different settings were used that differ from one model to the other since some have intensive curved surfaces which require different approach.
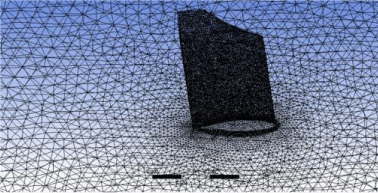
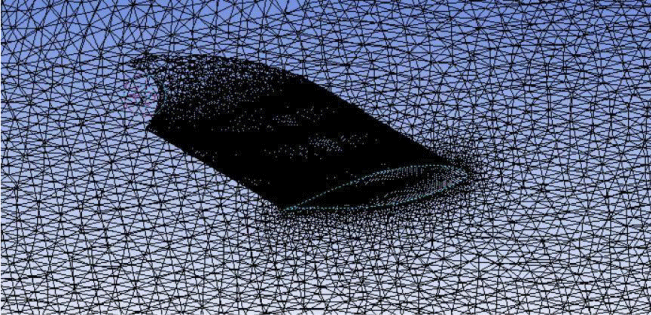
Some of the settings used were a CFX physics preference mesh relevance centre set to fine or medium and high smoothing levels, slow transition, inflation layers around the wing ranging from 15 layers to none with smooth transition. Some variety of settings are listed in Appendix F. Two different meshes can be seen in figures 16,17 in which the wind tunnel mesh is shown for the back-curved and blended winglet. These consists of 1462587 and 1339085 element size and 273264 and 237645 nodes respectively, which was effective in terms of computational time as well as the quality of results. But even higher number of mesh elements are usually used, which result in significantly greater quality.
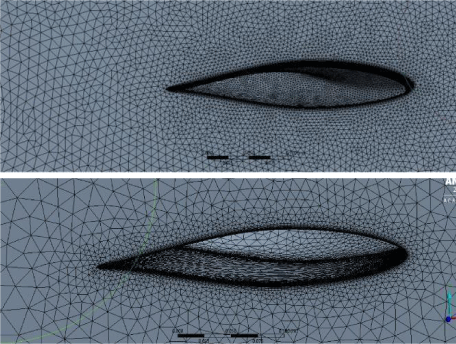
Different types of winglet meshes are illustrated in figures 18,19 showing the mesh generated for the 45˚blended winglet and the 60˚ back curved winglet. These were generated using different mesh settings. For the blended winglet 45˚ an unstructured tetrahedron mesh was generated with the use of adaptive sizing function with element size starting from 0.035 around the domain boundary walls and decreasing towards the wing boundary layer. The different mesh element sizes can be seen in figures 20-22 in detail. An inflation sphere with 0.75m radius and element size of 8 mm was used as seen in figure 23 in order to capture flow behaviour close to the model. Edge sizing on both wing and winglet edges with 800 divisions. As for the back curved winglet, edge sizing of 200 divisions were used and face meshing function was used as well as patch conforming methods as only tetrahedrons were tolerable in this cad configuration.
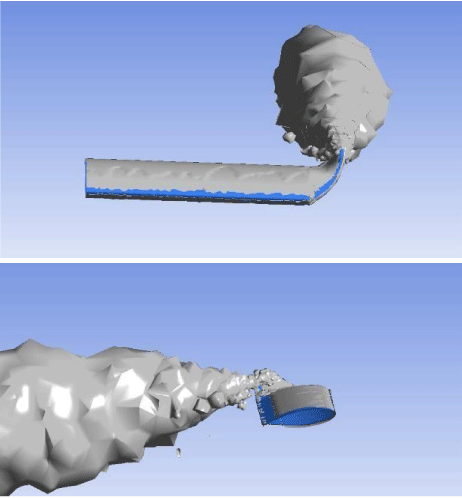
The quality of the mesh was also assessed using the quality function under mesh metric. There are two ways to check the quality. These are using skewness and orthogonal quality which describe the asymmetry of cells and the closeness between element edges respectively. Figure 24 describes the range of values and their equivalent quality and was used in order to optimise skewness quality. The aim was to limit the mesh quality to a minimum of “good” which is on the higher range of the spectrum and could produce results with good accuracy. Therefore if the values exceeded 0.8 in skewness or lower than 0.2 in orthogonal quality, than the settings were changed in order to amend this .The results of a bad mesh can be seen in figures 25 compared to a good mesh in figure 26, which represent the same back curved winglet model but in the former figure the mesh skewness was bad and hence the surface of the wing is worn down and badly distorted. On the latter figure, the skewness quality was changed to “good” by varying different settings and consequently only a very small portion of the wing was deteriorated which would still affect the numerical results, but slightly compared to the previous mesh state.
CFX-PRE conditions
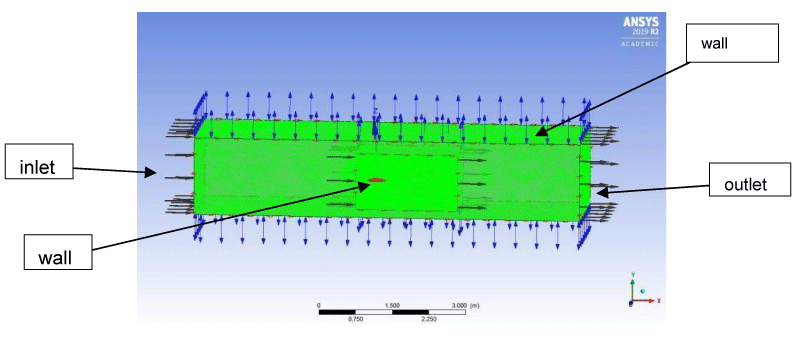
Boundary conditions are the input settings required for the simulation computation and were defined accordingly in order to replicate the wind tunnel’s conditions. The inlet has a subsonic flow regime with air temperature of 25 ˚Celsius with medium intensity turbulence option of 5%,reference pressure at 1.01E+5 Pa and static temperature at 288.2Kelvin.The velocity was different at each run since the simulation was aiming to analyse performance at different speeds as well as various aoa. In order to input the aoa correctly, as there is no option of choosing the aoa, the velocity was changed from normal single axis velocity to cartesian coordinates using the cosine component in X axis and sine component in Y axis(shown in Appendix G).The walls of the wind tunnel were specified as smooth walls with no slip as the roughness parameter. The outlet has relative pressure of 0.0 Pa averaged through the whole outlet area in a subsonic flow regime. Named selections were created for the wing, front and back walls named symmetry1 and symmetry2, and top and bottom walls were named openings. By naming two walls with the same name significantly reduces computational time as solver only computes the calculations for one side of wall and applies the results to the other side. All the named selections were named strategically as such shown in figure 27, as the processing software recognises.
Solver control
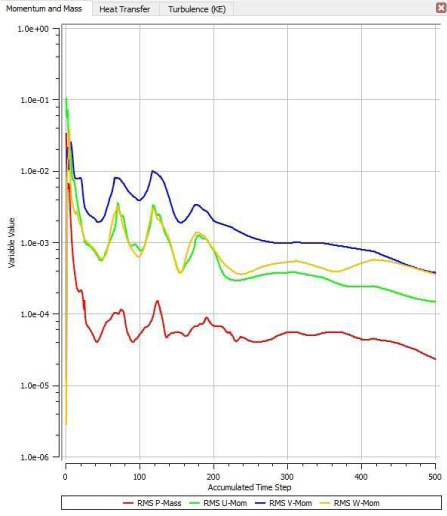
For this study k-ε turbulence model was used which was successfully implemented as this model is less demanding in terms of mesh quality and stability. Other models were also tested like k-ω but had insignificant effects on numerical results or better convergence. Steady flow analysis was selected with a time scale factor of 0.05 to 0.05 for a combination of better convergence as well as time efficiency. High resolution advection scheme was selected with a first order turbulence numeric for better simulation stability. The number of coefficient loop iterations was set to a minimum of 50 and a maximum of 500, which usually was more than enough for convergence. The residual type was as default Residual Mean Square (RMS) and the residual target set at 1E-4.
Computation
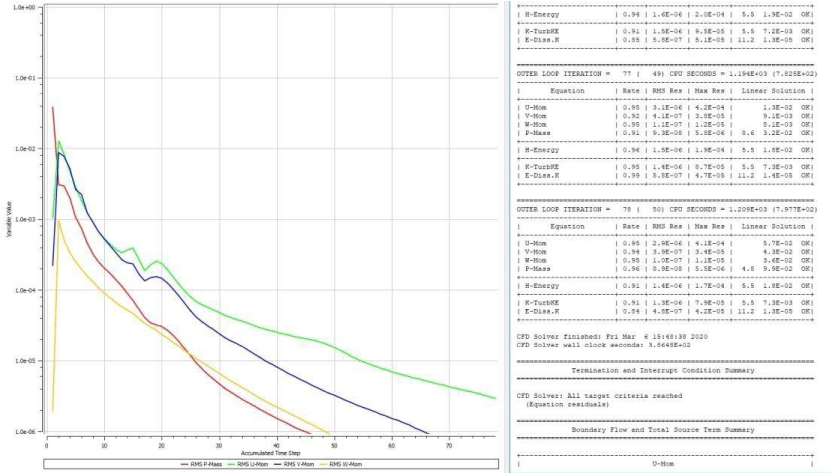
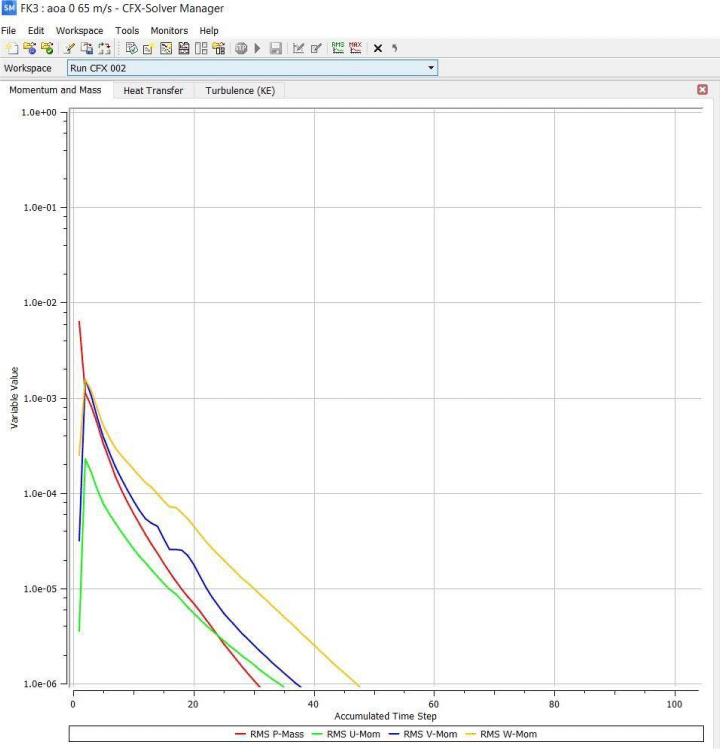
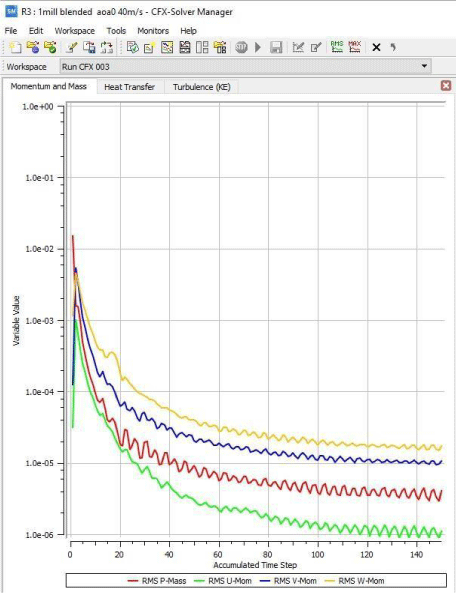
The convergence plots produced while simulation is computing, are one of the best ways to assess the simulation’s convergence as it relates the error produced from the equations. The residual number located at Y axis measures the local imbalance of a conserved quantity in each iteration of control volume. As a rough guided for RMS residual levels, 1E-4 is considered to be loosely converged,1E-5 well converged and 1E-6 tightly converged. According to the figures 28,29, the RMS plots have fully converged with residuals of 1E-6 , which signify good convergence and stability. In contrast, figures 30,31 signifies unsteady behaviour since gradient of lines are non- zero with loose convergence of 1E-4 convergence and figure 30 bad convergence with residuals of 1E-3.The whole cfd investigation took an estimate of 120 hours to complete computation using a quad-core 32.0GB RAM memory with i73770 CPU and 3.40GHz processor.
Stage 2: Wind tunnel testing procedure
Manufacturing process
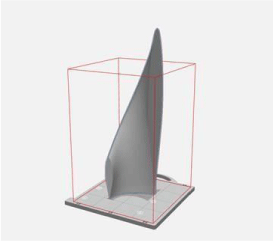
Winglet manufacturing: Two separate geometries were created for the original prototype that was used for the wind tunnel test, one for the main rectangular wing and the other geometry was the blended winglet of 45 degrees cant angle (figure 23). It represents the initial winglet design through the 3D printing software, in which clearly exceeds the maximum height that the machine can print at once. This caused two problems, one of them was that the winglet needed to either scaled down or be printed into two smaller parts and assembled back into one piece after the printing process by using a dovetail joint. The other problem was that even if the part would be hollowed out, it would still be very expensive and would exceed the budget limitations. Although the winglet was scaled down to 290mm chord, the cost of printing had used up the student budget, therefore the other winglets that were initially planned to be tested were not printed.
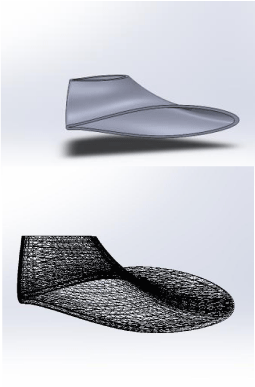
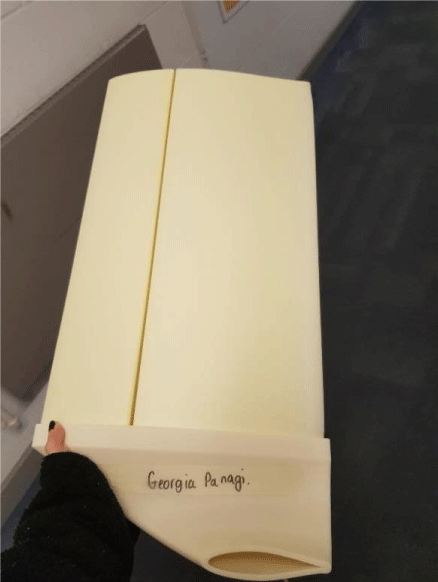
The winglet was hollowed using a shell function in Solid works keeping 4 mm of layer to avoid printing failure as well as ensure material durability during wind tunnel testing. An additional 5cm were added at the winglet’s chord edge to create a “lip” which would help with the wing assembly. The final CAD model and STL file that was used for printing are illustrated in figure 32, and the predicted printed version can be seen in figure 33. The actual printed winglet is shown in figure 33 which was printed very successfully. However, the surface of the 3d printed part was quite rough as seen in figure 33 but could be smoothed by following a certain procedure in order to avoid affecting the wind tunnel results. In order to do this the winglet would need to be smoothed and painted to create a smoothed surface. A new wing would also have to be manufactured to be used for the second wind tunnel experiment investigating the effects of the surface roughness on the turbulent boundary layer.
Wing manufacturing: The wing shown in figure 14 was design with a hole of 12.5mm diameter cutting through the wing , merging the two sides . This was done in order to mount the wing on the rod of the wind tunnel’s symmetry wall. The wing was manufactured from foam with final dimensions of 500mm span and 283mm in order to be able to slide into the winglet. The assembly shown in figure 34, validates that both components were accurately designed creating the perfect fit.
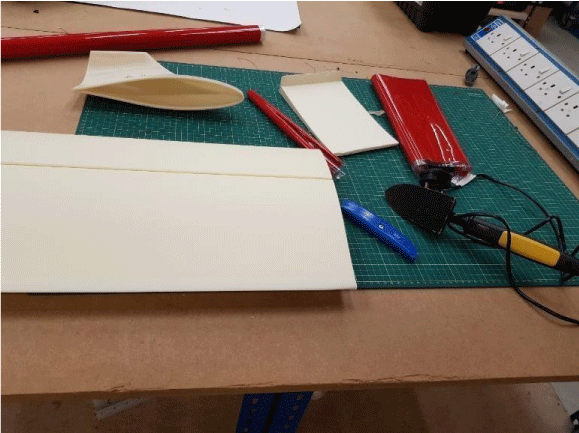
Wind tunnel experimental setup: The winglet as it is made from foam, has a rough surface which would greatly affect the wind tunnel results. For this reason, a very smooth film called solar film is used in order to coat the surface of the wing. The solar film has two sides, one side contains an adhesive substance, in order to stick to the wing’s surface and its located at the bottom while the other side on the top, has a heat resistance coating .The adhesive can only be activated by direct heat application. This was done by using a heating iron which is used for bonding as well as smoothing the surface and preventing possible formation of air bubbles. This process is shown in figure 34.
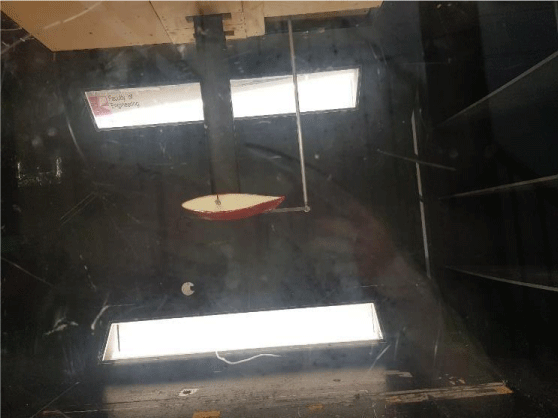
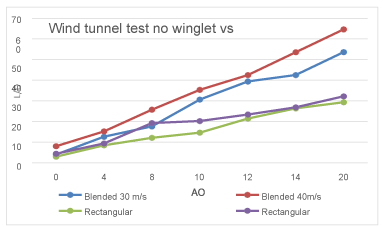
The model was mounted to a rod, fixed to the measuring sting in the high-speed section of the wind tunnel, by sliding the wing over using the 12.5mm diameter cut out section. A big sized ruler was used to measure the vertical distance from the floor to each side of the wing, in order to make sure that the wing was parallel to the ground. This is a simple calibration method to ensure the accuracy of the aoa starting from exactly 0 degrees. Next, three screws were placed strategically one side of the wing to ensure stability during the wind tunnel. Firstly, the rectangular wing was tested as seen in figure 35 ranging the aoa from 0 to 15 degrees for 37 and 30 m/s , recording all data channels (lift,drag,aoa, speed). The speed did not exceed 37m/s due to wing movement during the test. The same procedure followed for testing the blended winglet, after a film was attached at the top opening to reduce drag due to rough edges as seen in figure 36.
Result analysis
FD Post-processing results: Data gathered from cfd computation of the different types of winglets were used in order to assess each winglets efficiency which is related to L to D drag or Cl to Cd ratio and how pressure is distributed over the upper surface of the wing. CFX-post was used to calculate lift and drag coefficients by using equation 4. However, lift and drag forces were calculated using in-built expressions to describe force on y and x axis respectively as seen in equation 5, in which a variable wing was created that is located at the named selection that was previously named at pre-processing as “wing”. The ratio was found using the absolute value of lift divided by drag.
Equation 4. Lift and drag coefficient
Equation 5. Lift and drag forces expressions
Downwash and wing tip vortices analysis
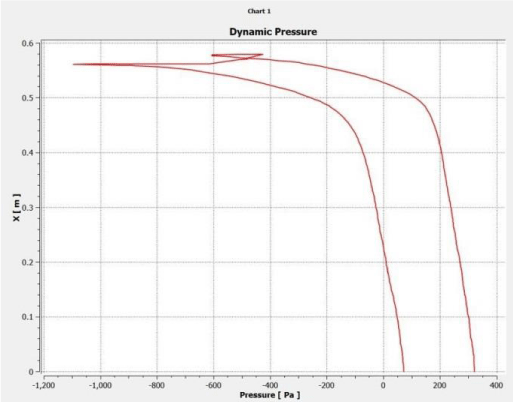
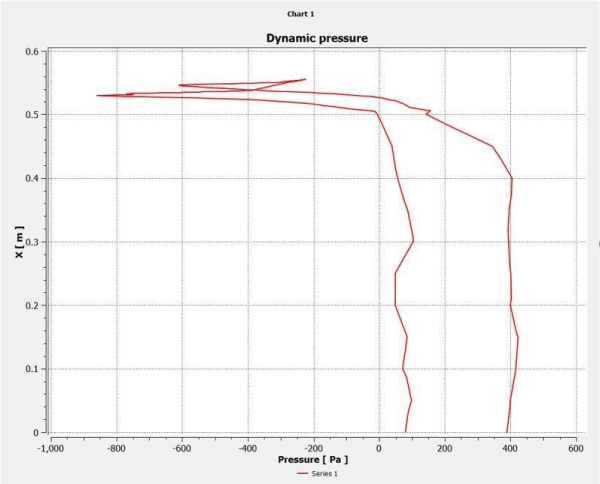
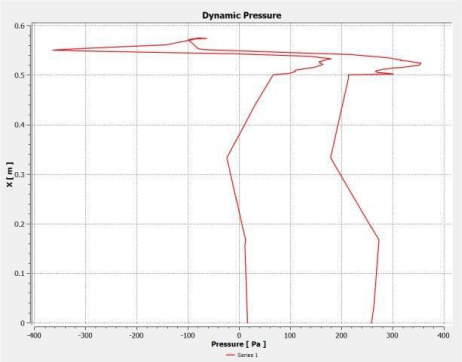
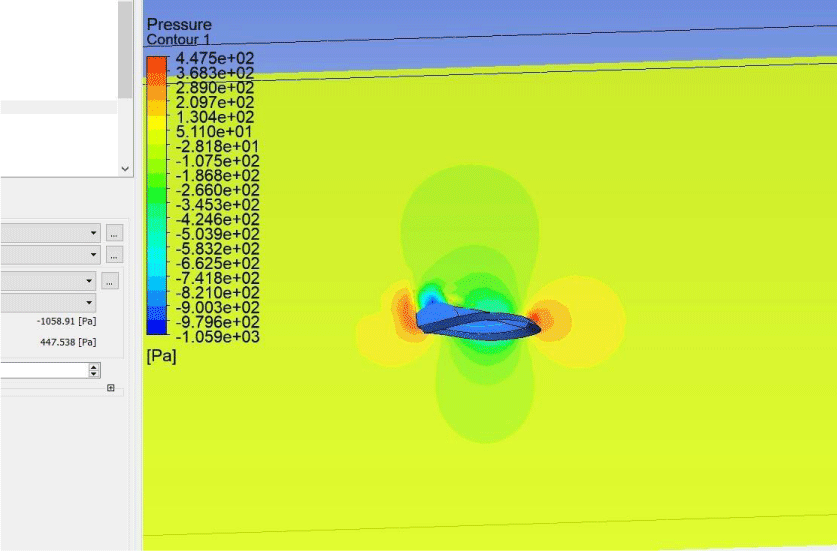
The pressure distribution over the wing can be assessed using a pressure contour plot or by creating a pressure - distance graph. This was accomplished by creating a pressure distribution line horizontally over the wing, and creating an in-built chart plotting the pressure over the model surface which is illustrated at figures 37-39. These graphs show that both blended and back curved winglets provide low pressure at the end of the winglet which would result in reduced wing tip downwash, with the blended 45˚ cant angle showing the lowest pressure distribution at the wingtips of approximately 100Pa.This signifies that higher lift would be available since there is less downward force as well as less wingtip vortices as these are created from the pressure difference between top and bottom of the wing.
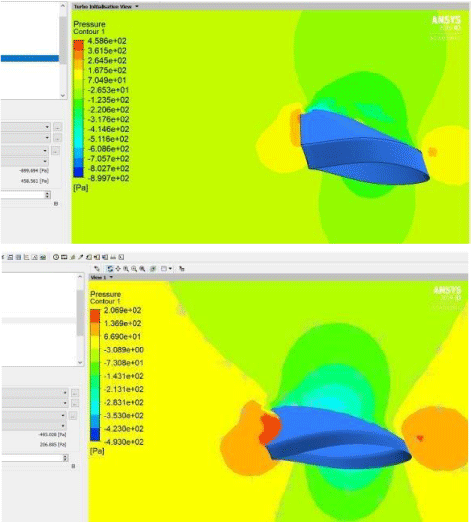
The contour plots seen in figures 40,41 illustrate the pressure distribution over the top and bottom surfaces of the wings as well as front and back sides. As mentioned, when the pressure of the air particles is higher at the bottom than on the top, these tend to move towards the top surface creating wing tip vortices and downwash. Therefore, the winglet with less downwash according to the pressure contour plots was the back curved 60˚ due to lower pressure levels at the winglet upper surface which is indicated from the light blue colour, while the blended 70˚winglet seemed to produce more downwash indicated from the intense green colour.
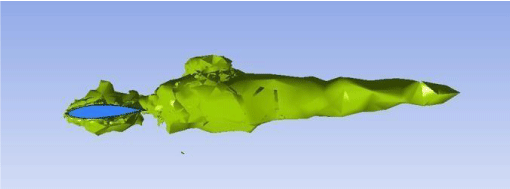
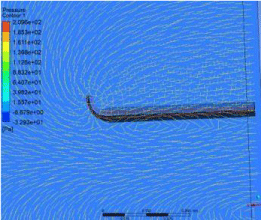
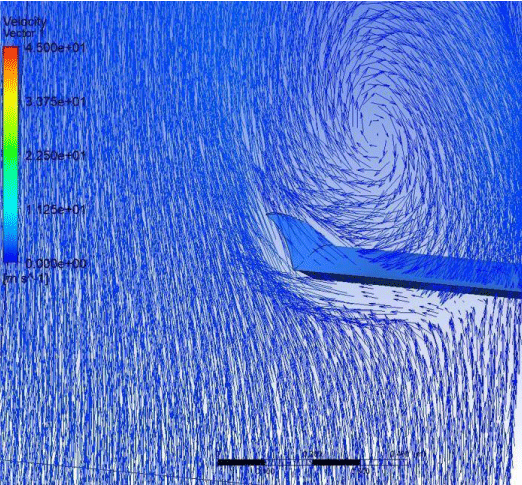
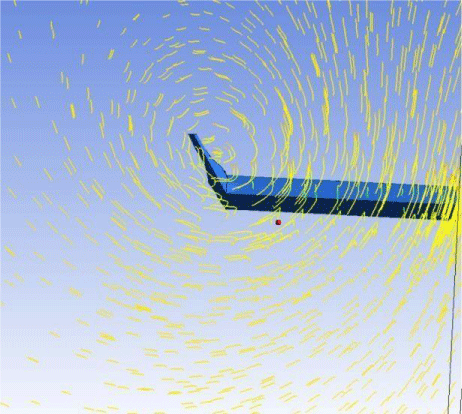
Furthermore, the winglet that produces less wing tip vortices seems to be the back curved 60˚ as opposed to the blended 70˚ which seemed to have slightly better pressure distribution. Referring to figures 42-45 the streamlines around the wing show the direction of the air swirls that cause downwash and form vortices. The blended 70 ˚ seemed to have an intense field of vortices while the back curved 60˚ seemed to redirect the flow direction away from the wing’s surface. This may be due to the curved shape at the back and front of the winglet. This was also validated using vortex display as seen in figures 18,19. In figure 19, blended 45˚ winglet’s shape causes air particles to evenly distribute over the wing area while diverting the vortex away from the wing on the winglet tip minimising wingtip swirling. In contrsast, 70˚ blended winglet vortex as seen in figure 44 was distributed over the surface unevenly, creating higher levels of wing tip vortices. This is also validated as seen in figures 42 in which the 70˚blended winglet’s vortex is significantly more intense compared to the front curved winglet 50˚ or the blended 45˚.
Aerodynamic efficiency analysis
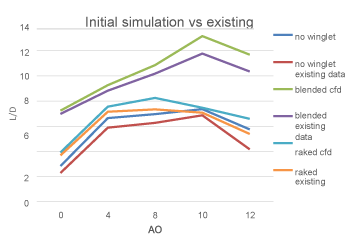
Lift and drag values were evaluated using CFX-post calculators and using the values generated, graphs were plotter in order to easily analyse the results. Firstly, the CFD results were validated using existing results found from literature review. The dimensions that were originally supposed to be used, were similar to those from the lit review and were used for cfd validation before the wind tunnel testing. However, the dimensions were scaled up for the wind tunnel testing preparation, in order to achieve higher Re but were scaled down slightly later on, due to printing limitations. Therefore, validation from existing data was only used in early stages of cfd investigation for only 2 winglet configurations as seen in figure 46 to assess the validity of the initial setup and mesh settings. Existing data were obtained from literature review with smaller wing dimensions and averaged to use for comparison. However, since the final values were significantly bigger than the ones used previously , higher values of efficiency were expected in later results.
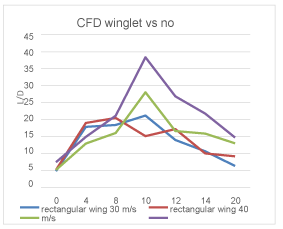
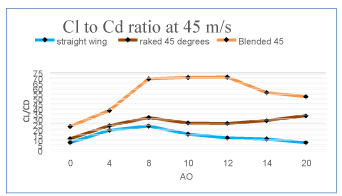
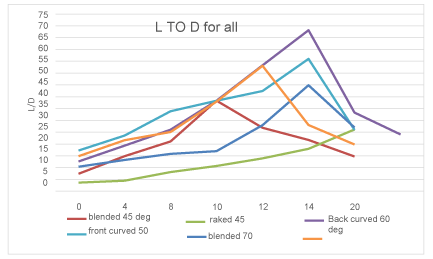
The initial comparative analysis between 3 models is illustrated in figure 47 were results found suggest that the simulation setup and mesh settings were correct, therefore producing similar results with existing data. The latest simulation results for comparison of the effects of winglets on overall efficiency can be seen in figure 48, where the lift to drag ratio was almost doubled with a blended winglet, compared to a rectangular wing with no winglet. The comparative analysis of the effects of blended and raked winglets on efficiency can be seen in figures 49, in which clearly the blended winglet was the most efficient with maximum lift to drag ratio of around 70, while raked and rectangular around 30 and 20 respectively. The lift to drag ratio for all winglets including the modified ones can be seen in figures 50-54. The most efficient winglets seemed to be the curved ones as expected, due to their ability to redirect the surrounding flow, while the least efficient was found to be the raked which is probably due to the straight shape of the winglet. All of the winglets seemed to be more efficient at the highest speed of 45 m/s and the stall angle was found to be 10 degrees in the initial simulation with smaller dimensions, while in the latest simulation was found to be around 14 for the modified winglets. This indicates that winglet configurations do not provide optimum aircraft performance at all stages of flight. Table 1 represents the respective L to D ratio for 65 m/s. This was done in order to relate this research to light aircraft with similar wing shape and speeds. According to the literature review a Cessna 172 has a flight speed of approximately 65 m/s and hence, an investigation was done to investigate the winglets’ behaviour in such speed. The best performing winglet at this speed was found to be the back curved 60˚ with 43.8491 and blended winglet of 45 ˚with slight difference at 43. 339.The accuracy of the simulation was also assed using control volume approach. Theoretically the amount of air mass flow entering the controlled volume shall equal the amount of air mass flow exiting the controlled volume. Therefore, a calculator was used in CFD-post to estimate the amount of air mass flow entering and leaving the controlled volume, ranging from 5% error to 15% depending on the intensity of the model’s cad geometry. An overall increase in lift to drag ratio of 40% was calculated from cfd results, between a wing with no winglet and the most effective winglet which was the back curved 60˚ winglet. Therefore, the dominant parameters affecting drag reduction were found to be the cant angle with optimum cant angle of 60˚, as well as the shape of the winglet. The same cant angle (60˚) but with higher vertical distance was found to produce more drag, while higher cant angles were found to be ineffective.
I would like to thank the following people for guidance and support in the research of this thesis.
My supervisor, Mr. Rohitha Weerasinghe for supporting me throughout this project. Mr. Zac Kaana for assisting in manufacturing and wind tunnel testing.
Ms. Lucy Corfield for assisting me in 3D printing.
Mr. Jonathan Winfield for helping in any questions concerning this module.
Declaration
This study was completed as part of the Aerospace engineering degree at the University of the West of England. The work illustrated is my own, wherever work of others was used credits of owners were acknowledged.
- Rominger WA, Maimon R (2020) Why does the air flow faster over the top of an air foil?. Link: https://bit.ly/3ey5cJ6
- LeBlanc R (2020) Will Electric Airplanes Make Travel More Sustainable. Link: https://bit.ly/3euqUxA
- Takenaka K, Hatanaka K, Yamazaki W, Nakahashi K (2008) Multidisciplinary Design Exploration for a Winglet. Journal of Aircraft 45: 1601-1611. Link: https://bit.ly/33vYxIQ
- Toor Z, Abbas Z, Masud J (2016) Uncertainty Analysis of Various Design Parameters on Winglet Performance. 54th AIAA Aerospace Sciences Meeting. Link: https://bit.ly/2SuXmqS
- Panagiotou P, Kaparos P, Yakinthos K (2014) Winglet design and optimization for a MALE UAV using CFD. Aerospace and science Technology. Link: https://bit.ly/3f6CuOr
- Epifanov M (2020) BOUNDARY LAYER. Link: https://bit.ly/2St7MY3
- Slocum A, Long P (2020) Separation of Flow. Link: https://bit.ly/3hrqb2b
- McGee & Saha (2020) Reynolds Number - Blayne Sarazin - OpenWetWare. Link: https://bit.ly/3uyiJWz
- Wahid M, Hakim M, Othman N, Mat . (2020) The Effects of Reynolds Number on Flow Separation of Naca Aerofoil. Link: https://bit.ly/3tEzHS0
- Winslow J, Otsuka H, Govindarajan B (2020) Link: https://bit.ly/3uABdWj
- Beechook A, Wang J (2013) Aerodynamic Analysis of Variable Cant Angle Winglets for Improved Aircraft Performance. Automation and Computing. Link: https://bit.ly/3y7CBlJ
- Narayan G, Bibin J (2015) Effect of winglets induced tip vortex structure on performance of subsonic wings. Aerospace Science and Technology.
- Abdelgany J, Khalil E (2016) Airfoil Aerodynamic properties [online]. Journal of Aeronautics & Aerospace Engineering.
- Lishifelshyal, W (2016) Analysis of drag over a wing model with and without raked wing tip. EPRA International Journal of Research and Development (IJRD).
- Norris K (2020) MAE 3241: Aerodynamics and Flight Mechanics. Link: https://bit.ly/3uy0dh6
- Guerrero J, Sanguineti M, Wittkowski K (2018) CFD Study of the Impact of Variable Cant Angle Winglets on Total Drag Reduction. Aerospace 5: 126. Link: https://bit.ly/33rLk3S
- Sørensen N, Johansen J (2007) Numerical Analysis of Winglets on Wind Turbine Blades using CFD. Link: https://bit.ly/3uABmsP
- Allen JB (1999) “Articulating Winglets” United States Patent Document.
- Jackson K, Fasanella E (2004) NASA Langley Research Center Impact Dynamics Research Facility Research Survey. Journal of Aircraft 41: 511-522. Link: https://bit.ly/2RFYXde
- Ryan A (2020) Boundary Layer Separation and Pressure Drag – Aerospace Engineering Blog. Link: https://bit.ly/33vZlNS
Article Alerts
Subscribe to our articles alerts and stay tuned.
 This work is licensed under a Creative Commons Attribution 4.0 International License.















 Save to Mendeley
