International Journal of Agricultural Science and Food Technology
Evaluation of advanced sorghum (Sorghum bicolor L. Moench) hybrid genotypes for grain yield in moisture stressed areas of Ethiopia
Temesgen Teressa1*, Tamirat Bejiga1, Zigale Semahegn1, Amare Seyoum1, Hailegebriel Kinfe2, Amare Nega1, Ligaba Ayele1 Daniel Nadew1, Mohammed Salah1, Sewmehon Siraw1, Mesfin Bekele3, Solomon Mitiku4 and Tadesse Ayalew4
2Tigray Regional Agricultural Research Institute, Shire Maitsebri Agricultural Research Center, Shire, Ethiopia
3International Crop Research Institute for Sami-Arid Tropics, ICRISAT, Adama, Ethiopia
4Amhara Regional Agricultural Research Institute, Sirinka Agricultural Research Center, Woldia, Ethiopia a
Cite this as
Teressa T, Bejiga T, Semahegn Z, Seyoum A, Kinfe H, et al. (2021) Evaluation of advanced sorghum (Sorghum bicolor L. Moench) hybrid genotypes for grain yield in moisture stressed areas of Ethiopia. J Agric Sc Food Technol 7(2): 212-219. DOI: 10.17352/2455-815X.000109Sixty two advanced hybrid sorghum varieties were evaluated in three environments, Kobo (KB), Sheraro (SH) and Mieso (MS) during 2019 of the main season. The objective of this study was to evaluate sorghum hybrids for production in drought stressed areas of Ethiopia. The experiment was piloted using a randomized complete block design with two replications. The result of over sites showed for grain yield, environments, environment by block and genotype by environment interaction effect highly significant variability among the genotypes. These point out that the variability among varieties and highly diverse growing situations across these three environments and vital in governing the expression of these traits. Significant genotype interaction by environment resulted either from differential responses of the variety or the test environments were highly significant (P ≤ 0.001). Out of 62 genotypes, G52, G47 and G38 were with near zero IPCA scores and hence have less interaction with the environments. Out of which only G47 and G52 had above average yield performance. Among environments, SH exhibited near zero IPCA1 score and hence had small interaction effects among environments, indicating that all the genotypes performed well in this location. So, it is the most favorable environments for most genotypes while MS and KB were good for only few genotypes. Genotypes, G36, G49, G37, G12, G68 and G6 generally exhibited high yield of positive IPCA1 score, from which G28, G55 and G34 had high IPCA1 scores in which G55 and G28 being the overall best genotype. Hence, the G55 and G28 were identified as specially adapted and the highest yielding genotype to the corresponding environments. Generally, G33 can be recommended for specific adaptation whereas, G55 and G28 relatively for wider adaptation.
Introduction
Sorghum [Sorghum bicolor (L) Moench] is an important cereal crop grown across diverse ecologies and belongs to the grass family. It is the fifth most important grain crop in the world, and a major food crop in the Asian and African continents [1]. It is a naturally self-pollinated short day plant with high degree of spontaneous crosspollination, in some cases, reaching up to 30% depending on panicle types [2].
It is the third major cereal crop in Ethiopia in terms of area next to tef (Eragrostis tef) and maize (Zea mays) and the forth in production next to maize, tef and wheat [3]. In Ethiopia, more than 5 million households are producing sorghum on 1.8 million ha of land & 52.6 million (qt) production and yield/ha of 28.8qt [3].
Sorghum grain is used as a staple food for millions of people in developing countries, while the stalk and leaves are used as livestock feed [4]. Sorghum is grown for food, feed, fiber and biofuels [5]. Sorghum grain and fresh or dry biomass have diverse uses and market opportunities [6]. Sorghum grain is processed into flour to prepare fermented and unfermented breads, porridges, couscous, and snacks. Malting sorghum is a valuable raw material to prepare alcoholic and non-alcoholic beverages [7,8]. Sorghum is second preferred crop next to tef for preparing ‘injera’ [9].
It is the major crop in drought stressed lowland areas that cover 66% of the total arable land in the country [10]. These areas are characterized by limited and erratic rainfall, and hot temperature. A major challenge of sorghum production in these parts of the country is lack of high yielding and stable varieties. Variety development for these parts of the country has focused on selection of early maturing varieties that can escape drought. For the last nearly half a century, a number of early sorghum open-pollinated varieties were developed and released for these areas. But, the hybrid sorghum varieties have not been get attention in these areas. So, the objective of this study was to evaluate sorghum hybrids for production in drought stressed areas of Ethiopia.
Materials and methods
Description of the study area
The experiment was conducted in 2019 across three locations, at Shire Maitsebri Agricultural Research Center (Sheraro), Sirinka Agricultural Research Center (Kobo) and Mieso Research Center, Ethiopia and these locations represent the drought stressed areas of the country and they are potential for sorghum production as well.
Genetic materials
A total of sixty two sorghum hybrid genotypes which were advanced from preliminary yield trials for their withstand to drought, including three released hybrid varieties as checks were used for this study (Table 1). These check varieties (ESH-4 and ESH-5) were originated from Purdue University and Argity was released by National Sorghum Research program, Ethiopian Institute Agricultural Research, for production in drought stressed areas of the country. All check varieties conferred for high yielder and drought tolerant. All the test genotypes and checks were evaluated in drought prone sites of the country Table 2.
Data collection
Data were collected on plant and plot basis for yield and yield attributes traits using sorghum descriptors [11].
]Days to flowering: the number of days from sowing date to when 50% of plants on the plot started flowering.
Days to maturity: The number of days from planting to the date when 95% of the plants matured physiologically.
Plant height (cm): Average height of main stalk from five plants from pre tagged was measured from above ground level to the tip of the end of panicle lengths.
Grain yield (gm): Yield obtained from total harvest of the plot and then it was converted to kg per hectare.
Statistical analysis
Data collected on 62 sorghum genotypes developed by the Ethiopian institute of agricultural research, National sorghum research program were subjected to analysis of variance (ANOVA) for key traits, components of grain yield in order to check the presence of significant difference among genotypes. The analysis of variance of the combined data expresses the observed (Yij) mean yield of the ith genotype at the jth environment as: Yij = μ + Gi + Ej + GEij + eij [12]. Where μ is the general mean; Gi, Ej, and GEij represent the effect of the genotype, environment, and the GEI, respectively; and eij is the average of the random errors associated with the rth plot that receives the ith genotype in the jth environment.
Result and discussions
Analysis of variance across tested environments
Pooled analysis of variance (ANOVA) for grain yield, plant height, days to flowering and days to maturity is given in Table 3. The result of over sites showed for grain yield, environments, environment by block and genotype by environment interaction effect highly significant variability among the genotypes. These point out that the variability among varieties and highly diverse growing situations across these three environments and vital in governing the expression of these traits. Significant genotype interaction by environment occasioned either from differential replies of the variety or the testing sites. Fentie, et al. [13], Teressa, et al. [14] Abebe, et al. [15] have been reported combined analysis of variance across locations for grain yield highly significant variability among the genotypes but, with significant environment, and genotype by environment interaction effect. Adugna [16] in sorghum reported also a similar result which showed a significant difference of genotypes, environment and genotype by environment effect for grain yield in dry hot lowlands of Ethiopia.
This means it makes complication for variety selection and advancement for a breeder, therefore more assessing of varieties using wider and specific adaptation and locations with good selective ability and illustrative is desired for further inquiry.
AMMI analysis of variance for GxE interaction
The AMMI analysis for grain yield (kg ha-1) of 62 is presented in Table 4. The analysis showed that variations due to genotype (G), environment (E) and genotype by environment (G x E) were significant (P < 0.001).
The large sum of squares (Table 4) for environment indicated that the environment were diverse, with large differences among environments causing most of the variation in grain yield, which is in similar result with the Patnaik MC, (2009), MoA (2010) and Fentie M, Assefa A, Belete K [13] Teressa, et al. [14] findings, in which the environments exhibited larger sum of squares than that of the genotypes. The presence of G x E interaction was obviously confirmed by the AMMI model, when the interaction was partitioned, among the first two interaction principal component axis (IPCA) (Table 5). The first (IPCA1) is highly significant (P < 0.001) by capturing more % of the total variation in the GxE interaction sum square, and the second interaction IPCA is significant.
AMMI stability analysis and grain yield performance
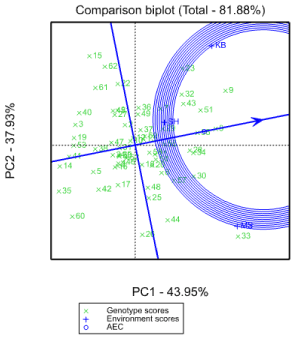
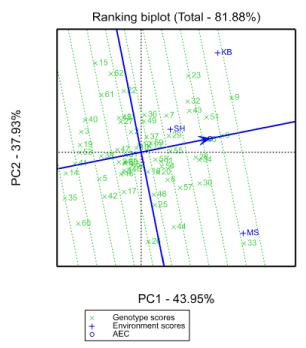
The ranking of 62 sorghum hybrid genotypes based on their mean yield and stability performance are shown in Figure 1. The line transient through the bi-plot origin is the average tester coordinate (ATC), which is defined by the average PC1 and PC2 scores of all environments (Yan and Kang 2003). The line which passes through the origin and is perpendicular to the ATC represents the stability of genotypes. Either direction away from the bi-plot origin on this axis indicates greater GE interaction or reduced stability. For selection, the ideal genotypes are those with both high mean yield and high stability. In the bi-plot, they are close to the origin and have the shortest vector from the ATC. The genotype G55, followed by G28 and 34, can be considered as genotypes with both high yield and stability performance (Figure 2). The genotypes with highest yield performance but, relatively with low stability were G30 and G8, whereas the genotypes with low yield and low stability were G23, G33, G44, G51, G9 and G57. The other genotypes on the right side of the line with no arrow have yield performance greater than mean yield and the genotypes on the left side of the line had yields less than mean yield. Among the genotypes, G55 was the most stable, followed by G28 and 34 with better mean yield enactment. Conferring to this bi-plot (Figure 2), G33 can be suggested for specific adaptation whereas G55 and G28 relatively for wider adaptation which is similar with [14].
The biplot describes the first two principal components and accounted for 81.8% of the total variation in grain yield (Figure 1). The lines that connect the test environment to the biplot origin are environment vectors. The angles between the vectors of the two environments estimated the correlation coefficient between them Yan (2002). So, in this case the angle between KB and SH, SH and MS, KB and MS were all less than 90o. Thus, the three environments are said to be positively correlated to each another.
Stability analysis based on AMMI and GGE models
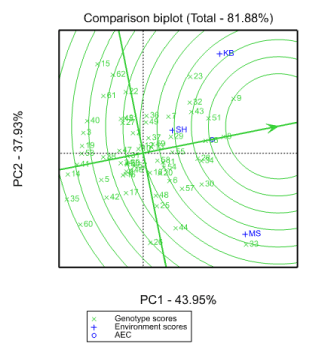
The environmental scores are linked to the origin by side lines (Figure 3). Sites with small spokes exert weak interactive forces while, those with long spokes exert robust interaction (Tadesse, 2017). Therefore, KB and MS exerted strong interaction forces while the SH did less. On the other side, the genotypes close to the origin are less sensitive to environmental interaction and those distant from the origins are more sensitive and have large interaction. In this study, G15, G26, G44, G30, G19, G14 and G62 had more responsive since they were far away from the origin whereas, the genotypes G47, G55, G68, G3, G29, G49, G2 and G27 were nearby to the origin and hence they were fewer sensitive to environmental influencing forces while genotypes G47, G37, and G2 were the most closest to the origin and therefore had almost no interaction forces (Figure 3).
Once a genotype and site have the similar sign on the PCA axis, their relations is positive and if not, their interaction is negative (Zobel, 1988). Genotypes and environments on the alike parallel lines gave similar yields and a genotype or environment on the right side of the center of the axis has higher yields than those of left side. Accordingly, G36, G49, G37, G12, G68 and G6 mostly revealed high yield of positive IPCA1 score, among G28 and G34 had high IPCA1 scores in which G28 being the overall superior genotype. Hereafter, the G28 was recognized as particularly adapted and the top yielding genotype to the consistent environments (Figure 3). On the other hand G22, G49, G27, G47, G17 and G2 were high yielding genotypes with negative IPCA1 scores. Out of 62 hybrids, G52, G47 and G38 were with close zero IPCA notches and hence have less interface with the environments out of which G47 and G52 had beyond average yield enactment. Among environments, SH exhibited near zero IPCA1 score and hence had minor interaction effects showing that, entire genotypes performed sound in this location. Therefore, it is the most promising environment for most of genotypes, while MS and KB were good for rare genotypes alone Adugna (2007), Anandan (2009) and Teressa, et al. 2019 stated related pattern of interactions.
GGE bi-plot analysis
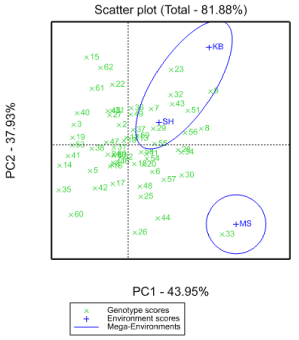
GGE bi-plot can top distinguish which genotypes perform best in which environments. GGE and AMMI models are comparable as far as their accurateness is worried Sheng, et al. (2000). The polygon view of the GGE bi-plot (Figure 4) shows the best genotype in apiece environment Hunt LA (2002). The genotypes (G33, G15, G30, G8, G23, G62, G35, G60, G44 and G26) have the long vectors, in their respective path, which measure responsiveness to environments. The vertex genotypes for each sector are the ones that provided the superior yield for the environments that fall in that sector Tadesse, (2017). The genotype with the high yield in MS is G33 and in KB and SH were G23, G8, G32, G43, G51, G7, G55, G37 and G29. The other genotypes (G15, G62, G22, G61, G35, G60, G26, G44, and G26, were poorest in all locations because there is no site in their segments.
Enactment of genotypes
The grand mean yield values of the three environments were compared, MS (3791.1 kg/ha) followed by SH (3009.5 kg/ha) had higher sorghum grain yield, while KB (2466.8 kg/ha) had the smallest sorghum grain yield. Environments MS and KB could, therefore, are regarded as the highest and the lowest yielding environments, respectively. This result is in agreement with the verdict of Zigale, et al. (2019).
The mean values of 62 hybrid sorghum varieties for the traits measured are illustrated in Table 6. Genotypes, ETSH19227 & ETSH19251 were the highest and while, ETSH19253 & Argity were low yielding varieties with the yield of 3989.3, 3938 kg/ha and 2402, 2307.3 kg/ha, respectively. This exhibited the occurrence of interaction across the experimental sites. In overall, rank of genotypes altered environment to environment. This point out that, a notable GxE needs more study to understand the patterns of interactions. This result is similarly reported by Temesgen, et al. (2019), [18].
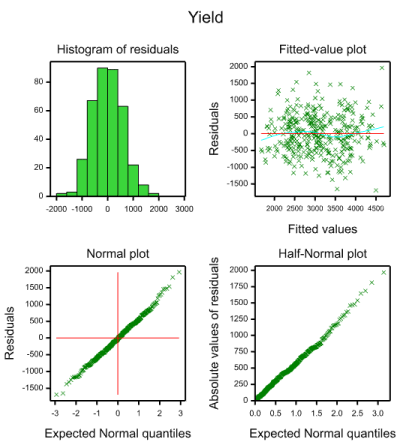
The distribution of phenol-agronomic traits was normal for combined data over sites (Figure 5).
The result for grain yield, environments, environment by block and genotype by environment interaction effects over sites revealed there is a highly significant (P ≤ 0.001) variability among the genotypes. These point out that, the variability among varieties and highly diverse growing situations across these three environments and vital in leading the expression of this trait. Significant genotype interaction by environment resulted either from differential responses of the variety or the testing sites.
Summary and conclusion
The largest sum of squares for environment indicated that the environments were varied, with large differences among environments causing most of the variation in grain yield, in which the environments revealed larger sum of squares than that of the genotypes. The presence of G x E interaction was obviously confirmed, when the interaction was partitioned, among the first two interaction principal component axis (IPCA). The first (IPCA1) is highly significant (P < 0.001) by capturing more percent of the total variation in the GxE interaction sum square, and the second interaction IPCA is significant (P<0.002).
Ideal genotypes are both with high mean yield and stable. In the bi-plot, they were close to the origin and have the shortest vector from the ATC. The genotype G55, followed by G28 and G34, can be considered as genotypes with both high yield and stability performance. The genotypes with superior yield performance but relatively with low stability were G30 and G8, whereas, the genotypes with low yield and low stability were G23, G33, G44, G51, G9 and G57. Among the genotypes, G55 was the most stable, followed by G28 and G34 with better mean yield performance.
The angles between the vectors of the two environments estimated the correlation coefficient between them. The angle between KB and SH, SH and MS, KB and MS were all less than 90o. Thus, the three environments are said to be positively correlated to one another.
The KB and MS exerted strong interaction forces while, the SH did less. On the other hand, genotypes, G15, G26, G44, G30, G19, G14 and G62 had more responsive since they were far away from the origin whereas, the genotypes G47, G55, G68, G3, G29, G49, G2 and G27 were close to the origin and hence they were less sensitive to environmental interactive forces while genotypes G47, G37, and G2 were the most closest to the origin and hence had almost no interaction forces.
Genotypes, G36, G49, G37, G12, G68 and G6 generally exhibited high yield of positive IPCA1 score, out of which G28 and G34 had high IPCA1 scores in which G28 being the overall best genotype. Hence, the G28 was identified as specially adapted and the highest yielding genotype to the corresponding environments. Among environments, SH exhibited near zero IPCA1 score and hence had small interaction effects indicating that all the genotypes performed well in this location. Consequently, it is the most favorable environments for most genotypes while, MS and KB were good for only limited genotypes. Generally, G33 can be recommended for specific adaptation whereas G55 and G28 relatively for wider adaptation.
- Somegowda V, Vemula A, Naravulab J, Prasad G, Rayaprolu L, et al. (2021) Evaluation of fodder yield and fodder quality in sorghum and its interaction with grain yield under different water availability regimes. Current Plant Biology 25: 100191. Link: https://bit.ly/2S2CeZl
- Poehlmann J, Sleper D (1995) Breeding Field Crops. Iowa State University Press, Ames 15: 494. Link: https://bit.ly/3vFUJRX
- CSA (2019) The Federal Democratic Republic of Ethiopia central statistical agency agricultural sample survey volume-I report on area and production of major crops.
- Habte N, Gezahegn G, Moges M, Alemu T, Amare S, et al. (2021) Genome‑wide association analysis reveals seed protein loci as determinants of variations in grain mold resistance in sorghum. Theoretical and Applied Genetics. Link: https://bit.ly/3p7aLla
- Paterson A, Bowers J, Bruggmann R, Dubchak I, Grimwood J, et al. (2009) The Sorghum bicolor genome and the diversification of grasses. Nature 457: 551-556. Link: https://bit.ly/34B01Ci
- McGuire SJ (2007) Vulnerability in farmer seed Systems: Farmer practices for coping with seed insecurity for sorghum in Eastern Ethiopia. Economic Botany 61: 211-222. Link: https://bit.ly/3uE06jk
- Abdi A, Zemede A, Endashew B, Awgechew T (2002) Patterns of morphological variation of sorghum (Sorghum bicolor (L.) Moench) landraces in qualitative characters in North Shewa and Sout Welo, Ehtiopia. Hereditas 137: 161–172. Link: https://bit.ly/34CXbMZ
- Adugna A (2014) Analysis of in situ diversity and population structure in Ethiopian cultivated Sorghum bicolor (L.) landraces using phenotypic traits and SSR markers. SpringerPlus 3: 212. Link: https://bit.ly/3if76QO
- Ayana A, Bryngelsson T, Bekele E (2000) Genetic variation of Ethiopian and Eritrean sorghum [(Sorghum bicolor (L.) Moench)] germplasm assessed by random amplified polimorphic DNA (RAPD). Genetic Resources and Crop Evolution 47: 471–482. Link: https://bit.ly/2RaOOFv
- Gebeyehu G, Adugna A, Tadesse T (2004) Development of sorghum varieties and hybrids for dryland areas of Ethiopia. Uganda Journal of Agricultural Science 9: 594-605. Link: https://bit.ly/2WGDCAs
- IBPGR and ICRISAT (1993) Descriptors for sorghum [Sorghum bicolor (L.) Moench. International Board for Plant Genetic Resources, Rome, Italy; International Crops Research Institute for the Semi-Arid Tropics, Patancheru, India. Link: https://bit.ly/3ySzGgY
- Fisher RA (1925) Statistical methods for research workers. Oliver and Boyd, London. Link: https://bit.ly/3vEBB6V
- Fentie M, Assefa A, Belete K (2013) Ammi Analysis of Yield Performance and Stability of Finger Millet Genotypes across Different Environments. World Journal of Agricultural Sciences 9: 231-237. Link: https://bit.ly/3uISQT8
- Teressa T, Seyoum A, Bejiga T, Nega A, Tirfessa A (2019) Effect of Genotype x Environment Interaction on the Performance of Hybrid Sorghum Genotypes in Moisture Stressed Areas of Ethiopia. International Journal of Plant Breeding and Crop Science 6: 579-586.
- Assefa A, Bezabih A, Girmay G, Alemayehu T, Lakew A (2020) Evaluation of sorghum (Sorghum bicolor (L.)] Moench) variety performance in the lowlands area of wag lasta, north eastern Ethiopia. Cogent Food & Agriculture 6: 1. Link: https://bit.ly/3yUJo2v
- Adugan A (2008) Assessment of yield stability in sorghum using univariate and multivariate statistical approaches. Hereditas 145: 28-37. Link: https://bit.ly/3fB7yaq
- Dahlberg J, Berenji J, Sikora V, Latković D (2011) Assessing sorghum [Sorghum bicolor (L) Moench] germplasm for new traits: food, fuels & unique uses. Maydica 56: 1750. Link: https://bit.ly/3wERGcO
- Yitayeh ZS, Bisetegn KB , Mindaye TT (2019) AMMI and GGE Analysis of GxE and Yield Stability of Early Maturing Sorghum [Sorghum bicolor (L.) Moench] Genotypes in Dry Lowland Areas of Ethiopia. Adv Crop Sci Tech 5: 425. Link: https://bit.ly/3w59e1V
Article Alerts
Subscribe to our articles alerts and stay tuned.
 This work is licensed under a Creative Commons Attribution 4.0 International License.
 Save to Mendeley
