Annals of Systems Biology
Determining the chlorine kinetic behavior in surface water using evolutionary metaheuristic algorithms
Farhad Mahmoudi Jalali1, Seyyed Roohollah Masoomi2, Mostafa Azizi3, Reza Aghlmand4, Mohammad Gheibi4* and Zahra Kian5
2Department of Environmental Engineering, Civil & Environmental Engineering Faculty, Tarbiat Modares University, Tehran, Iran
3Department of Mine Engineering, Shahid Bahonar University of Kerman, Iran
4Department of Civil Engineering, Ferdowsi University of Mashhad, Iran
5Department of Chemical Engineering, Amirkabir University of Technology, Tehran, Iran
Cite this as
Jalali FM, Masoomi SR, Azizi M, Aghlmand R, Gheibi M, et al. (2021) Determining the chlorine kinetic behavior in surface water using evolutionary metaheuristic algorithms. Ann Syst Biol 4(1): 026-030. DOI: 10.17352/asb.000014The use of a reliable technique in measuring the residual chlorine concentration is of particular importance. Because based on the results of these measurements, the water quality of the network is calculated and evaluated in terms of ensuring the health of the community. The concentration of residual chlorine in the effluent of the treatment plant decreases as water flows through the distribution network. Chlorine decay is divided into two categories: wall and mass decay. Various detectors such as DPD and Ortho-toluidine can be used to measure residual chlorine. This study is the first step in the spectroscopy of chlorine and Ortho-toluidine color complex. The results of this stage of the research indicate that to measure the residual chlorine concentrations, the absorbed values should be read at a peak of 450 nm. In the next step, after measuring the free chlorine concentrations remaining at different times, the degree of chemical reaction was determined using multivariate nonlinear regression methods. In the final step, the reaction coefficient was calculated by simulating the differential equation in the Simulink environment and optimizing the error of the initial values of the reaction constant to the real values using the genetic algorithm (GA). The results of the analysis showed; The mass decay of chlorine in the sample follows the quadratic and the reaction constant is equal to 0.005 .
Introduction
Disinfection is one of the main missions of water treatment systems. This process in water treatment plants usually involves primary and secondary disinfection. According to USEPA guidelines, the primary purpose of disinfection is to control biological growth in treatment ponds, prevent the formation of biological masses on filters, improve coagulation and flocculation, and reduce the taste and odor of raw water entering the treatment plant [1]. According to the definition of Standard 1053 of the Standards and Industrial Research Organization of Iran, drinking water is water that has physical, chemical, and biological properties to such an extent that its consumption for drinking in the short and long term does not cause human health [2]. In water treatment plants, depending on the type of source and its quality, different treatment units can be used. But the disinfection unit in all water treatment plants must be used to ensure microbial health. Currently, the use of chlorine for disinfection is the most common disinfection method in Iran due to its cheapness and antimicrobial power, and relatively good stability. In the disinfection process, five general mechanisms lead to the disruption of microorganisms and damage to their cellular structure. These mechanisms include damage to the cell wall, change in cell permeability, a change in the colloidal property of the protoplasm, a change in DNA or RNA, and an inhibition of enzymatic activity. Oxidizing chemicals such as chlorine inhibit the enzymatic activity of microorganisms [3]. Chlorine may come in many forms, compounds, and phases, such as; Sodium hypochlorite, calcium hypochlorite, chlorine dioxide, chloramine compounds, and chlorine gas should be used [4]. Ammar, et al. (2014) have investigated the degradation of chlorine dioxide in the desalinated water mass. In this study, for both primary and secondary disinfection, the effect of concentrations of 0.6 to 1.4 mg/l chlorine dioxide on mass decay rate was evaluated. Also, due to the effect of temperature on the degradation rates of chlorinated compounds, the experiments were performed at four temperatures of 20, 27, 35, and 45 degrees Celsius. The results of these experiments were computationally evaluated using T-test statistical methods [5]. Liu, et al. (2014) have investigated the effect of pH, water temperature, and the ambient temperature around pipelines in relation to chlorine mass degradation. This study was performed on case samples of two separate regions, which led to the presentation of models to express the relationship between chlorine degradation and the mentioned parameter [6]. Hua, et al. (2015) have conducted a study on chlorine decay and its reaction with organic matter (DOM) in water. In this study, models with quadratic reactions were presented to calculate the residual chlorine concentration [7]. Monteiro, et al. (2014) have investigated chlorine degradation in the urban water network using the EPANET MSX multiple simulation model. In this study, based on the reported results of other studies, chlorine mass degradation was considered as a quadratic type, and simulations were performed in the EPANET MSX environment. The results of this study showed; EPANET MSX environment in chlorine degradation simulation has similar results to the EPANET model, but due to the graphical features of the EPANET model than the EPANET MSX model, users are more interested in using the EPANET model [8]. In the present study, the intention is to first determine the optimal wavelength for measuring chlorine concentration, then using the synthetic experiments and computational nonlinear multivariate regression method, the degree of reaction is determined. Finally, using the combination of MATLAB software Simulink environment, and genetic algorithm, the values of the constant coefficient of the traditional reaction of chlorine mass decay are calculated.
Materials and methods
Chlorine mass decay
Chlorine reacts with organic and mineral molecules in the water matrix during movement along with the water supply network and its concentration decreases. This type of reduction in chlorine concentration is called chloride mass decay. Over the past few decades, scientists have conducted extensive research on the mass (volumetric) decay of chlorine. The results of the research have led to the development of several models for determining the mass degradation coefficient of chlorine (Table 1). Haas and Karra (1984) first proposed five practical models for chlorine mass degradation. In their research, all substances that can react with free chlorine were assumed to be a composite (A). The general form of the reaction and the differential equation used in the study are presented in equations 1 and 2, respectively [9].
(1)
(2)
As can be seen in the above relation, the parameters k’, C, R, m, and n are related to the mass synthesis coefficient is the chlorine concentration (mg/L), the concentration of chlorinated oxidants (mg/L), the degree of reaction of the oxidants, and the degree of reaction of chlorine. Since the concentration of oxidizing agents is much higher than the concentration of disinfectant (chlorine), the concentration of oxidizing agents is assumed to be constant over time. For this reason, equation 3 was proposed by Haas and Karra (1984) [9], as follows.
Finally, the researchers performed complementary modeling to provide a relationship for limit concentrations. It is assumed in some models; Over time, the chlorine concentration does not fall below known values (CL). The differential equation is partially described by equation 4.
(4)
As shown in Table 1; Many researchers divide the chlorine decay process into two parts: fast reaction (k1) and slow reaction (k2). Al-Jasser, et al. (2007) [17] argue for two phases (fast and slow) in considering the chlorine decay process; The fast phase of the reactions takes place in the treatment plant or inside the tanks, in places where a load of oxidizing substances (impurities in water) is high, and also the slow phase takes place along the lines of the water supply network. It is worth noting; Where re-chlorination occurs; Both fast and slow reactions occur.
In this study, to determine the rate of chlorine mass degradation, water outlet samples of the filtration unit of a treatment plant located in Khorasan Razavi province were used. The treatment plant is fed by surface water sources. In these samples, the chlorine degradation rate was evaluated over a period of 4 hours. An Agilent 8453 spectrophotometer and spectrocell were used to measure the chlorine concentration. According to Beer-Lambert law, there is a direct and linear relationship between the amount of light absorbed by the samples and the concentration of the substance in them [20]. The detector used in the experiments was Ortho-toluidine, which produces a distinct yellow color in the presence of chlorine. For this purpose, at the beginning of the measurements, it was necessary to perform a series of spectroscopic studies to determine the maximum absorption wavelength by the yellow color of the chlorine and Ortho-toluidine complex. Therefore, standard samples with different concentrations of chlorine were prepared and spectroscopically examined. It should be noted that to prepare standard solutions, bleach-containing 8% NaOCl was used. To determine the percentage of NaOCl content of purchased bleach, the iodometric method was used [21]. In the titration steps of the iodometric method, three chemicals of potassium dichromate, sodium thiosulfate, and starch adhesive were used. In order to increase the accuracy of the test and to prevent possible errors, the three mentioned substances should be titrated separately and the purity of each of them should be calculated and evaluated. In the next step, the values of the standard samples (containing concentrations of 0.25, 0.5, and 1 mg / l of bleach water) were prepared using the above-mentioned bleach water solution according to the iodometric test outputs. A portion of Ortho-toluidine was added and each sample was spectroscopically measured in four replications in the visible wavelength range (380-600 nm) and their average absorption was calculated. According to the results of spectroscopy, the wavelength of 450 nm (Lambda = 450 nm) was obtained as the maximum absorption index. The spectroscopic results of standard solutions are presented in Figure 1, which well shows the maximum wavelength. After determining the maximum absorption wavelength, the necessary measurements were made to determine the residual chlorine concentrations in the desired water samples. Finally, after performing synthetic experiments on chlorine mass degradation, the values of reaction degree and reaction constant were calculated.
Calculation of reaction degree and constant coefficient of chlorine mass degradation using statistical techniques and differential equations.
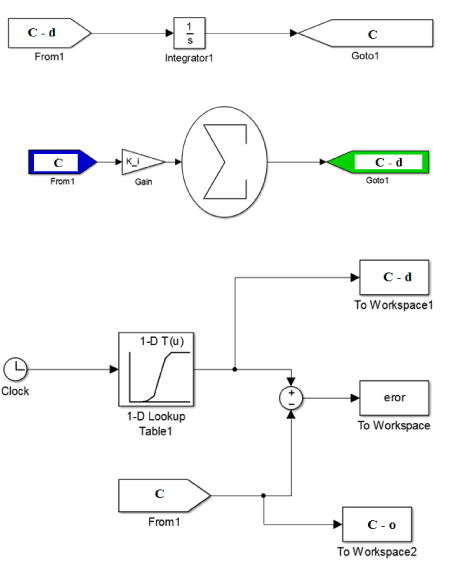
In this part of the study, a combination of Simulink environment and genetic algorithm (GA) was used to calculate the synthetic coefficients of chlorine mass degradation. The method of solving this equation (Haas and Karra model [9]) is based on the ODE 45 method of MATLAB software in the analysis of differential equations (Figure 2). As can be seen in equation 5, the equation contains unknowns including n (degree of reaction) and k (synthetic coefficient of constant reaction). To calculate the degree of chemical reaction from regression analysis, changes in chlorine concentration over time were performed as shown in Table 2. The error optimization equation (Error function in Figure 2) and the regulatory parameters of the genetic algorithm are also expressed in Equation 6 [22].
(5)
Results and discussion
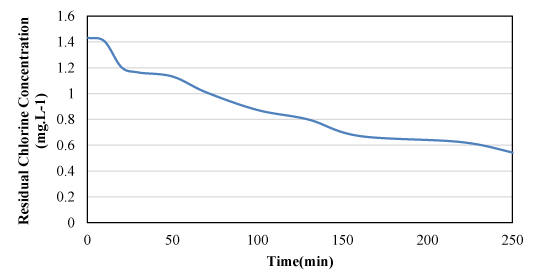
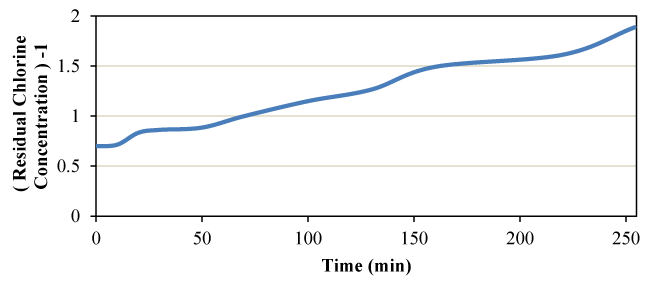
The synthetic experiment on chlorine mass degradation was performed at different time steps. The results are summarized in Table 3. The table contains the results of calculations for determining the degree of reactions zero, one, and two. Also, the data in Table 4 for zero, one, and two-degree reactions are shown in Figures 3, 4, and 5, respectively.
The application of nonlinear multivariate regression analysis to determine the degree of reaction of chlorine mass degradation led to the results summarized in Table 3.
From the analysis of the results of the above table, it is clear; The quadratic reaction creates the best compatibility due to the maximum amount of R-Square and the lowest amount of error (SE). In other words, the second degree can be chosen as the most appropriate value of the degree of reaction. A review of the research background reveals; Due to the small difference between the R-Square and SE statistical indices in the first and second degree, the reaction can be declared as the first degree. Given that the qualitative-hydraulic modeling processes are performed on first-grade enamel and there is little difference, the existing claim can be stated as the result of measurements. Therefore, the engineering judgment of the researcher determines the degree used in qualitative-hydraulic modeling. In order to calculate the constant mass degradation coefficient k, a combination of the mentioned model in Simulink environment and GA algorithm was used. The results of the integrated model showed that the value of the constant mass decay coefficient of chlorine is equal to 0.005 , which in the linearization mode gives a value equal to 0.0045 .
However, determining the value of the constant reaction coefficient by the combined method is more accurate and takes precedence over the linearization method (straight-line slope) which resulted in an error of 10%.
Conclusion
Measuring and calculating chlorine deterioration in the treatment plant and water supply network is of particular importance. There are various solutions and methods for the synthetic study of chlorine mass decay. One of these methods is the use of Ortho-toluidine reagent, which showed the results of spectrophotometry using spectrophotometry (UV-Visible); The readings should be 450 nm in length. After measuring chlorine degradation, the degree of chemical reaction, as well as the reaction constant, should be determined. This study has modeled the general shape of the equation in the Simulink environment of MATLAB software to determine the degree of reaction from multivariate nonlinear regression analysis and to determine the reaction constant. Then, with the help of the GA algorithm, it optimizes the error of the initial values of the reaction until it reaches the real value. The results showed that the case reaction of this study followed the second degree and its reaction constant was equal to 0.005 .
- Ghernaout D, Ghernaout B, Kellil A (2009) Natural organic matter removal and enhanced coagulation as a link between coagulation and electrocoagulation. Desalination and Water Treatment 2: 203-222. Link: https://bit.ly/3kqLFOb
- Institute of Standards and Industrial Research of Iran (2010) Physical and chemical properties of drinking water (standard 1053). Tehran, Iran.
- Garrido-Cardenas JA, Esteban-García B, Agüera A, Sánchez-Pérez JA, Manzano-Agugliaro F (2020) Wastewater treatment by advanced oxidation process and their worldwide research trends. International Journal of Environmental Research and Public Health 17: 170. Link: https://bit.ly/3xFOXAA
- Mishra V, Abrol GS, Dubey N (2018) Sodium and calcium hypochlorite as postharvest disinfectants for fruits and vegetables. In Postharvest disinfection of fruits and vegetables. Academic Press 253-272. Link: https://bit.ly/3wBCUTI
- Ammar TA, Abid KY, El-Bindary AA, El-Sonbati AZ (2014) Chlorine dioxide bulk decay prediction in desalinated drinking water. Desalination 352: 45-51. Link: https://bit.ly/36yzBSA
- Liu B, Reckhow DA, Li Y (2014) A two-site chlorine decay model for the combined effects of pH, water distribution temperature and in-home heating profiles using differential evolution. Water Res 53: 47-57. Link: https://bit.ly/3r7D04v
- Hua P, Vasyukova E, Uhl W (2015) A variable reaction rate model for chlorine decay in drinking water due to the reaction with dissolved organic matter. Water Res 75: 109-122. Link: https://bit.ly/3xPCI4R
- Monteiro L, Figueiredo D, Dias S, Freitas R, Covas D, et al. (2014) Modeling of chlorine decay in drinking water supply systems using EPANET MSX. Procedia Engineering 70: 1192-1200. Link: https://bit.ly/3AZGlqP
- Haas C, Karra S (1984) Kinetics of wastewater chlorine demand exertion. Journal (Water Pollution Control Federation) 170-173. Link: https://bit.ly/3r6n3LD
- Vasconcelos JJ, Rossman LA, Grayman WM, Boulos PF, Clark RM (1997) Kinetics of chlorine decay. Journal‐American Water Works Association 89: 54-65. Link: https://bit.ly/2UJDnps
- Qualls RG, Johnson JD (1983) Bioassay and dose measurement in UV disinfection. Appl Environ Microbiol 45: 872-877. Link: https://bit.ly/3wBNGcD
- Clark RM, Grayman WM, Males RM, Hess AF (1993) Modeling contaminant propagation in drinking-water distribution systems. Journal of environmental engineering 119: 349-364. Link: https://bit.ly/3kdz7JC
- Hunt WA, Kroon JR (1991) Model calibration for chlorine residuals in distribution systems. In Proc., Water Quality Modeling in Distribution Systems Conf.
- Rossman LA, Clark RM, Grayman WM (1994) Modeling chlorine residuals in drinking-water distribution systems. Journal of Environmental Engineering 120: 803-820. Link: https://bit.ly/3hB51OF
- Hallam NB, West JR, Forster CF, Powell JC, Spencer I (2002) The decay of chlorine associated with the pipe wall in water distribution systems. Water Research 36: 3479-3488. Link: https://bit.ly/3i1FUDD
- Mutoti G, Dietz JD, Arevalo J, Taylor JS (2007) Combined chlorine dissipation: Pipe material, water quality, and hydraulic effects. Journal‐American Water Works Association 99: 96-106. Link: https://bit.ly/3AW77jG
- Al-Jasser AO (2007) Chlorine decay in drinking-water transmission and distribution systems: Pipe service age effect. Water Res 41: 387-396. Link: https://bit.ly/3wBOiir
- Gang D, Clevenger TE, Banerji SK (2003) Relationship of chlorine decay and THMs formation to NOM size. J Hazard Mater 96: 1-12. Link: https://bit.ly/3xC091n
- Fisher I, Kastl G, Sathasivan A (2011) Evaluation of suitable chlorine bulk-decay models for water distribution systems. Water research 45: 4896-4908. Link: https://bit.ly/3hxncVo
- AWWA Water Quality Division Disinfection Systems Committee (2000) Committee Report: Disinfection at small systems. Journal (American Water Works Association) 92: 24-31. Link: https://bit.ly/3hDdhxI
- AWWA (2012) Standard Methods for the Examination of Water and Wastewater, American Water Works Association, 22nd Edition, 2012. Link: https://bit.ly/3kcPC91
- Goharimanesh M, Akbari A (2015) Optimum parameters of nonlinear integrator using design of experiments based on Taguchi method. Journal of Computational Applied Mechanics 46: 233-241.Link: https://bit.ly/3i3A1pB
Article Alerts
Subscribe to our articles alerts and stay tuned.
 This work is licensed under a Creative Commons Attribution 4.0 International License.


 Save to Mendeley
