Trends in Computer Science and Information Technology
Fast algorithms for particle searching and positioning by cell registration and area comparison
Yoshifumi Ogami*
Cite this as
Ogami Y (2021) Fast algorithms for particle searching and positioning by cell registration and area comparison. Trends Comput Sci Inf Technol 6(1): 007-016. DOI: 10.17352/tcsit.000032In the direct simulation Monte Carlo method and multi-phase flow calculations, structured and unstructured grid systems for complex geometries necessitate the time-consuming process of searching a large number of cells to position target particles. This paper proposes effective computational methods for particle searching and positioning that are applicable to structured and unstructured grid systems. Firstly, two methods are introduced to limit the cells to search: the surrounding cell registration method and the Cartesian cell registration method. In the case of two-dimensional potential flow around a circular cylinder, as an application of the proposed methods, it is demonstrated that the surrounding cell registration method is 232 times faster than the method of searching all the cells until the cells occupied by the target particles are found, whereas the Cartesian cell registration method is 200 times faster with the appropriate parameters. Secondly, a method called the area comparison method is introduced to position a target particle and find the exit edge of the cell at which a trajectory of the particle exits. It is demonstrated that the area comparison method can position particles 1.15–1.2 times faster than particle-to-the-left positioning because the latter is implemented with multiple if-statements, while the former has only one.
Abbreviations
DSMC: Direct Simulation Monte Carlo; SCR: Surrounding Cell Registration; CCR: Cartesian Cell Registration; BCP: Background Cartesian Grid Position; AC: Area Comparison
Introduction
Particle searching and positioning are the major time-consuming processes in the Direct Simulation Monte Carlo (DSMC) method [1,2] and multi-phase flow calculations [3-5]. When the Cartesian grid system is used, particle searching and positioning are quite easy because the identification number given to the cell occupied by a target particle can be computed from an algebraic expression. However, in the Cartesian grid system, the flow over complex geometries is difficult to describe and such descriptions are inaccurate, limiting the engineering applicability of the Cartesian grid system. On the other hand, the structured grid system can simulate complex geometries with a better quality of body fitting and better accuracy of object boundary calculation as compared to the Cartesian grid system [6]. Moreover, the quality of body fitting for complex geometries is even better with unstructured grid systems such as those used in industrial applications [7-9]. However, structured and unstructured grid systems for complex geometries necessitate the time-consuming process of searching a huge number of cells to position target particles.
By taking advantage of the Cartesian grid system to efficiently search cells, Liang, et al. [10] proposed a DSMC method that combines two levels of Cartesian grid systems with an unstructured triangular grid system. However, as pointed out by Wang, et al. [11], although this method improved the calculation efficiency, several calculations must be performed separately at the junction of two types of grids, which is relatively tedious. Chuncai, et al. [12] divided the computational domain into various rectangular regions of Cartesian grid systems with a small number of triangular elements. The particle trajectory is tracked by searching the rectangular regions first and then the triangular elements. This method also improved calculation efficiency. However, the grid cell system is limited to a triangular grid system, and searching grids in small areas can still be time-consuming.
Wang, et al. [11], also proposed the background Cartesian grid position (BCP) technique for two-dimensional computations. In this technique, a structured grid system is superposed on a layer of a background Cartesian grid system, and the geometric relationship between the structured and background grids is established in advance to limit the cells to search later. Although their results showed a significant decrease in the computational time required for particle positioning, BCP is limited to structured grid systems. Furthermore, applying BCP to three-dimensional grids may be somewhat difficult.
First, to overcome the above limitations, two methods are herein introduced to limit the cells to search only for positioning a target particle in a structured or unstructured grid system are introduced. The first is called the Surrounding Cell Registration (SCR) method and is described in Section 2.1. In this method, the cell numbers of the cells surrounding the central cell are registered with the central cell in advance to limit the cells to be searched later. It is demonstrated that a program with this method runs faster than those with other methods because SCR has the least number of cells to search among the studied methods. However, it should be noted that SCR and the other methods mentioned later have a drawback in that the cell numbers of the cells in which the particles are introduced must be known or given in advance. This drawback is overcome by the second method, which is called the Cartesian Cell Registration (CCR) method and is described in Section 2.2. CCR uses a Cartesian grid as a background two-dimensional grid system, as in the method proposed by Wang, et al. [11], but in a completely different manner; our method can be applied to both structured and unstructured grids.
Section 4.2 compares the performance of SCR and CCR with that of the method of searching all the cells until the cells occupied by the target particles are found (the brute-force method). For two-dimensional potential flow around a circular cylinder, as an application of the proposed methods, it is shown that computational programs with both methods are almost 200 times faster than a program with the brute-force approach. Moreover, the concepts of SCR and CCR are simple enough to apply to three-dimensional grid systems quite easily. In this paper, the present methods are not applied to DSMC but to a simple potential flow. However, this flow is enough to study computational speeds of the present methods.
While searching cells using the proposed methods, the cell in which the target particle exists must be determined; in other words, the target particle must be positioned. Wang, et al. [11] explains this point as follows. “A widely used particle positioning algorithm has been proposed by R. Chorda (RC) method [13]. The core of RC positioning method is to find the grid intersecting with particle motion trajectory through searching, and then make specific mathematical judgment on these grids one by one, to find the grid where the particle is finally located. Particle to the left (P2L) and Trajectory to the left (T2L) are the two important mathematical criteria used in RC method [sic].” In short, P2L finds the cell occupied by the target particle, while T2L detects the exit edge of the cell at which a trajectory of the particle exits. P2L was first introduced by Zhou, et al. [14], following which this method was improved and applied to various geometries by many researchers [13,15,16]. Instead of T2L, Reji, et al. [17] presented a method based on geometric calculation. However, it must be pointed out that, in P2L and T2L, the vertices of each cell must be ordered anticlockwise, which makes them somewhat complicated to apply to three dimensions. Moreover, the computer program must evaluate if statements as many times as the number of edges for each target cell to position a target particle. This increases the computational time, as demonstrated in Section 4.1. Moreover, the application of P2L and T2L to three dimensions increases the number of if statements.
Second, to overcome the above shortcoming, a simple and easy-to-apply method called the Area Comparison (AC) method is introduced. The AC method is used to find the cell occupied by a target particle or to position the target particle in Section 3.1 and to detect the exit edge in Section 3.2. Both these tasks can be performed by comparing areas only once; in other words, a computer program with this method requires only one if statement per target cell or edge. Further, in the AC method, the vertices of a cell are not necessarily ordered anticlockwise; rather, they may be randomly ordered. As demonstrated in Section 4.1, a computer program with the AC method runs 1.15–1.2 times faster than P2L. Moreover, the AC method may be applied intuitively to three-dimensional grids by comparing volumes, in which case the method is called the volume comparison method.
Limiting the cells to search
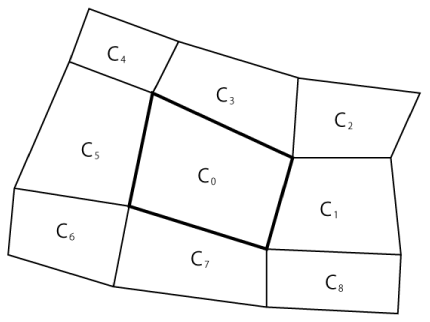
Surrounding Cell Registration (SCR) method: Figure 1 shows a portion of the quadrangular grid system considered here. The grid system may be structured or unstructured, and it may have any polygonal structure other than a quadrangular structure. In addition, the cells may be numbered sequentially or arbitrarily. In Figure 1, the cell C0 is the central cell. The cell numbers of the eight cells C1–C8 surrounding the central cell C0 are registered with C0. In a computer program, the array CN for the central cell C0 has the following elements, in which C0 is the cell number of the cell C0:
CN[C0, 1] = the cell number of C1 (10, for example).
CN[C0, 2] = the cell number of C2 (13, for example).
CN[C0, 8] = the cell number of C8 (1111, for example).
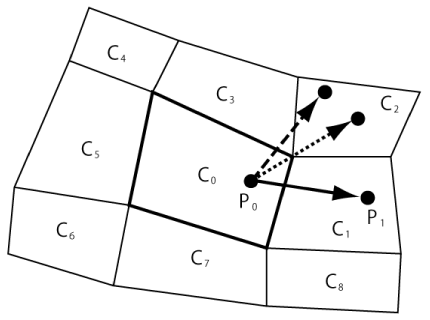
Each cell in the quadrangular grid system shown in Figure 1 has eight surrounding cells, except for cells at the boundary. For example, the cells on the surface of a circular cylinder have only five surrounding cells. The number of surrounding cells varies with the type of grid system. In a computer program, a surrounding cell is chosen if it shares at least one of its vertices (not edges) with the central cell. With this criterion, the cells that share edges as well as vertices with the central cell are chosen. Moreover, this registration method enables the treatment of cases in which the particle trajectory passes through a vertex (Figure 2, dotted arrow) or through a cell (dashed arrow) without any auxiliary calculation such as that performed in [14].
After the registration of the all the eight surrounding cells with the central cell C0, let the next cell C1 be the central cell. Now, the cell numbers of the eight cells surrounding C1 are registered with C1 as follows:
CN[C1, 1] = the cell number of C2 (13, for example).
CN[C1, 2] = the cell number of C3 (40, for example).
CN[C1, 8] = the cell number of C8 (1111, for example).
Some of the cells for the above registration are not shown in Figure 1.
This registration process is repeated for all cells, and the registration is performed only once. By using these registration data, computationally expensive cell searching can be avoided because the number of the target cells to search is at most nine (the central cell and eight surrounding cells) for each target particle to be positioned. The computational efficiency of the surrounding cell registration method is described in Section 4.2.
The concept of SCR is similar to that of “mesh connectivity” proposed by Macpherson, et al. [16], which refers to the sharing of the same faces by cells. In their paper [16], they treated a particle passing through a cell (dashed arrow in Figure 2) in a few steps, while SCR requires only one step, even when the particle passes through a vertex (dotted arrow in Figure 2), as explained in Section 3. Furthermore, their method needs to store a vector describing the center position of each edge as well as each edge normal vector to verify if a particle crosses an edge. On the other hand, CSR requires only the coordinates of the cell vertices and does not use these vectors.
Cartesian Cell Registration (CCR) method
SCR and some other methods such as P2L have a drawback in that the cell numbers of the cells in which the particles are introduced must be known or given in advance. If the initial locations of particles are randomly given and all the cells are searched until the cells of the first locations are found every time new particles are introduced (the brute-force method), the computational cost will be huge.
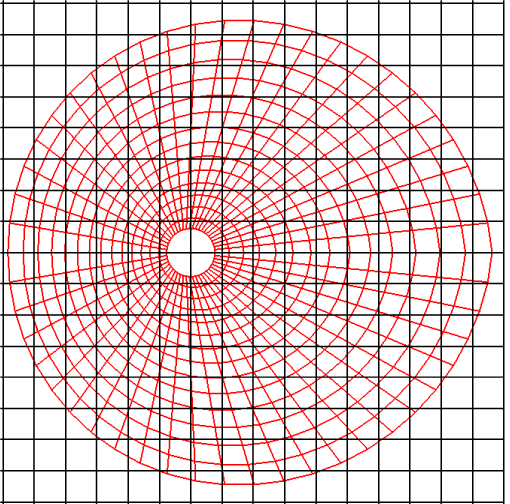
To decrease the cost, Wang, et al. [11] proposed the BCP technique, as mentioned previously. Although their results showed a significant decrease in the computational time for particle positioning, BCP is limited to structured grid systems. CCR also utilizes a Cartesian grid system, but it can be effectively and robustly applied to both structured and unstructured grid systems. Let us consider a grid system around a circular cylinder as the target grid system (shown in red in Figure 3) to be registered with a Cartesian grid system (shown in black in Figure 3). This target grid system may be structured, unstructured, or any polygonal structure other than a quadrangular structure. Moreover, the cell numbers are either sequential or arbitrary.
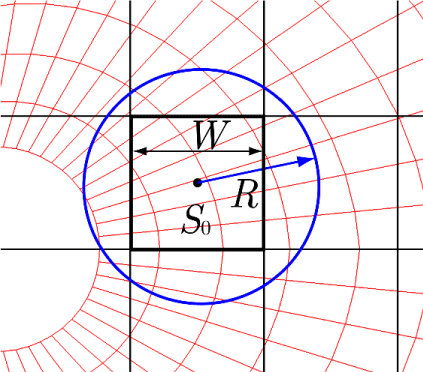
Consider a square cell S0 on the Cartesian grid system with a cell width W, as shown in Figure 4. The cell numbers of all the red cells on the target grid system that have centers within a distance R from the center of S0 are registered with S0. This registration process is performed for all Cartesian grid cells and target red cells. Some of the target red cells may be registered more than once with different Cartesian grid cells. However, it is highly important to adjust the parameters W and R so that no target red cells are left unregistered. The number of registered target cells can be zero or excessively large, depending on the parameters W and R as well as the cell sizes of the target grid system.
The cell number of the Cartesian grid system in which a target particle exists can be computed from an algebraic expression by using the coordinates of the particle. Subsequently, the cell number of the target grid system in which this particle exists can be determined by searching only the target cells registered with Cartesian grid cells and then positioning the target particle through the AC method, which is described in Section 3.
The computational efficiency of this method depends on tvhe average number of cells registered with the Cartesian grid cells. This aspect, along with the optimal values for the parameters W and R, will be discussed in Section 4.2.
Area comparison method
Positioning of particles: While searching cells using the methods presented in Section 2, the cell in which the target particle exists must be determined. Here, we introduce the Area Comparison (AC) method for this purpose. AC requires neither the anticlockwise ordering of the vertices as in [13] nor a vector describing the center position of each edge and the edge normal vectors as in [16]; rather, it requires only the coordinates of vertices of the cells. Moreover, the AC method is simple enough to adopt in three dimensions intuitively, although the application to three dimensions is not presented in this paper.
Consider a target particle P0 in a cell C0 at time t, as shown in Figure 2. When the time is updated to t + Δt with a sufficiently small time step Δt, the particle moves to one of the surrounding cells or remains within C0. Note that the choice of Δt neglects the case where the particle moves through two or more cells. This case is examined in Section 3.2.
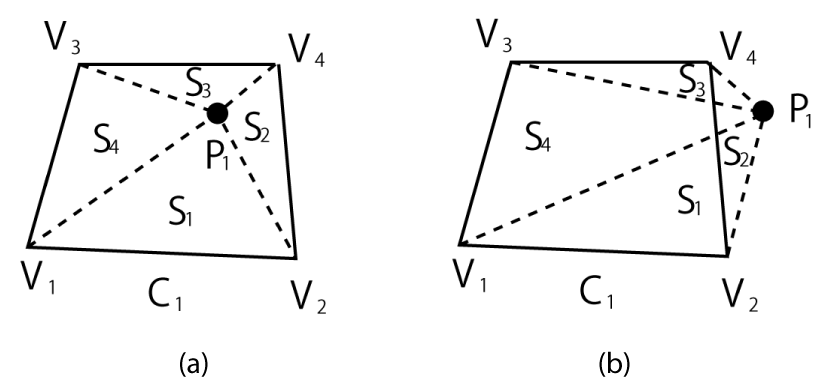
Let the area of the cell C1, one of the cells surrounding C0, be S. Further, as shown in Figure 5, let the area of the triangle given by the vertices V1 and V2 of C1 and the particle position P1 be S1, the area of V2V4P1 be S2, the area of V3V4P1 be S3 and the area of V3V1P1 be S4. The area A of a triangle with the vertices (x1, y1), (x2, y2), and (x3, y3) is expressed as follows:
.
The existence of the particle in C1 can be verified by the following simple if statement:
If S = S1 + S2 + S3 + S4, then the particle exists in the cell C1 (Figure 5 (a)).
Moreover, if S = S1 + S2 + S3 + S4 and S1 = 0, then the particle is on the edge V1V2. Additionally, if S = S1 + S2 + S3 + S4, S1 = 0, and S2 = 0, then the particle is on the vertex V2. Finally, if S S1 + S2 + S3 + S4, then the particle is outside C1 (Figure 5(b)). If this is the case, another registered surrounding cell is considered, and the above procedure is repeated until the occupied cell is confirmed. It should be noted that a particle passing through a vertex (Figure 2, dotted arrow) or through a cell (Figure 2, dashed arrow) can be treated in the same manner as a particle crossing cell edges (solid arrow) without any auxiliary calculation such as that considered in [14].
This method may be easily applied to three dimensions, in which case it is called the volume comparison method. In three dimensions, the volume of a cell is compared with the total volume of the polyhedrons generated with the cell vertices and the particle coordinates.
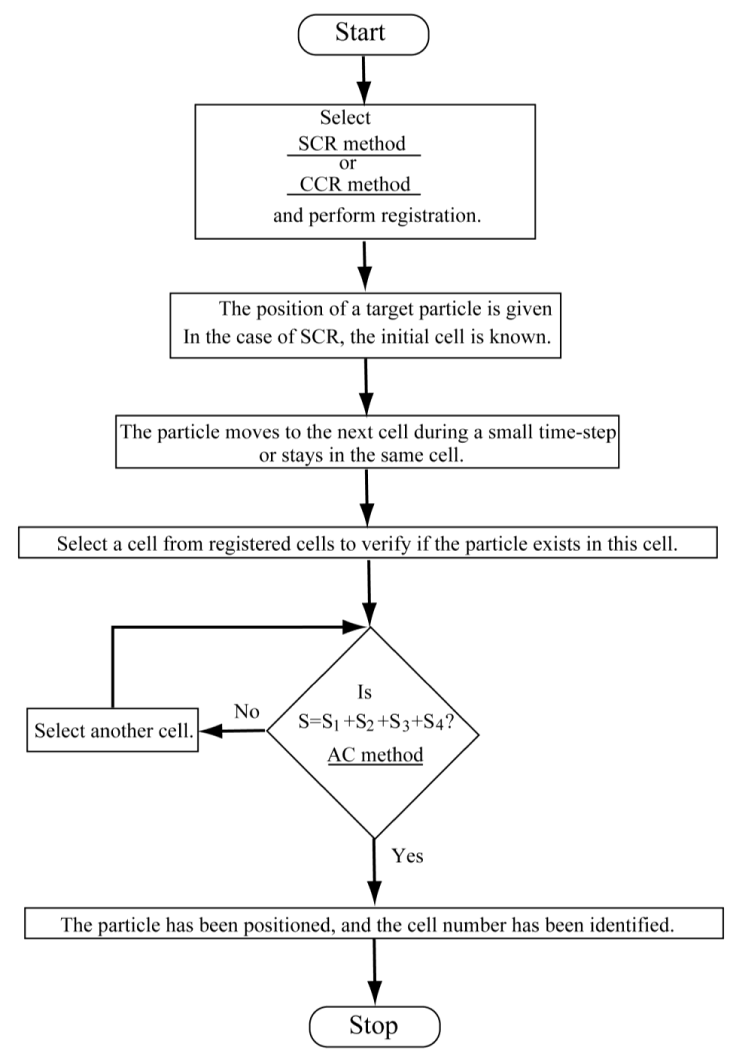
To illustrate the process to position a target particle and to identify the cell number of the target particle by using CCR or SCR with the AC method, a flow chart is shown in Figure 6.
Determination of the exit edge of the cell where a particle trajectory exits
In the case of simulations that require the residence time of a particle in each cell through which its trajectory crosses, it is necessary to determine the exit edge and the intersection point of the exit edge and trajectory. This is also true for the case where the particle moves by a distance greater than one cell length.
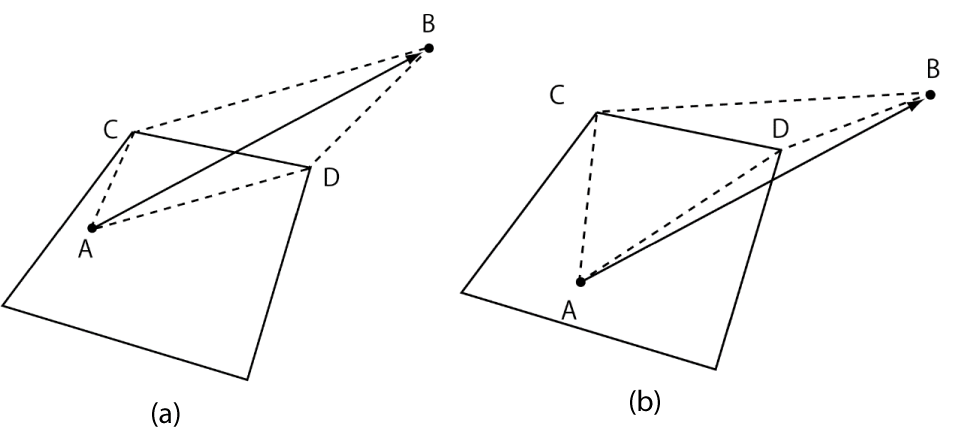
Figure 7 illustrates the application of the AC method to determine the exit edge. In the figure, point A is the position of a particle at time t, and B is its position at time t + t. B is considered far from A. Therefore, the particle trajectory AB crosses more than one cell. CD is one of the edges of the cell containing the particle at time t.
T2L examines each edge together with anticlockwise-ordered vertices through the fol lowing two conditions:
1) Does the trajectory AB in Figure 7 lie to the left of the vertex C of a target edge CD?
2) Does the trajectory AB lie to the left of the vertex D of the edge CD?
The exit edge is found only when the first condition is false and the second is true. Reji, et al. [17], used the following two conditions:
1) Are the vertices C and D on opposite sides of the trajectory AB?
2) Are the points A and B on opposite sides of the edge CD?
The exit edge is found only when the both conditions are true.
In contrast to the above two sets of conditions, the AC method verifies whether the particle trajectory AB and edge CD intersect through one simple condition:
1) Is ΔACD + Δ BCD = ΔCAB+ΔDAB ?
The particle trajectory AB and edge CD intersect (Figure 7(a)) only when the above condition is true; thus, the exit edge can be found. Moreover, the intersection point can be obtained through simple geometric calculation.
Additionally, if ΔDAB = 0, for example, the particle trajectory AB passes through the cell vertex D and if ΔACD + Δ BCD ≠ ΔCAB+ΔDAB, the particle trajectory AB and edge CD do not intersect (Figure 7(b)).
By checking at most four edges of the cell, the exit edge or the vertex through which the particle trajectory passes can be determined. Subsequently, the surrounding cell that shares this edge or vertex is considered, and the above procedure is repeated until the cell containing the particle position B is found.
In this manner, all the exit edges as well as the intersection points of the edges and the trajectory can be found. This idea may be applied to three dimensions without much difficulty.
Simulation Results and discussion
Comparison between area comparison method and particle to the left
In this section, the computational speeds are compared between the AC method and P2L using Fortran programs.
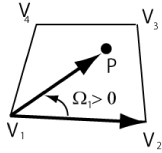
Before comparison, P2L is briefly explained. As shown in Figure 8, when the point P with the coordinates of the particle (xp, yp) lies on the left-hand side of the edge V1V2, the cross product W1 between the edge vector V1V2 and particle vector V1P given by
is positive [13]. In the above equation, (x1,y1) and (x2,x2) are the coordinates of the vertices V1 and V2, respectively. Therefore, if all the cross products Wi for all the edges of the cell are positive, then the particle is in that cell.
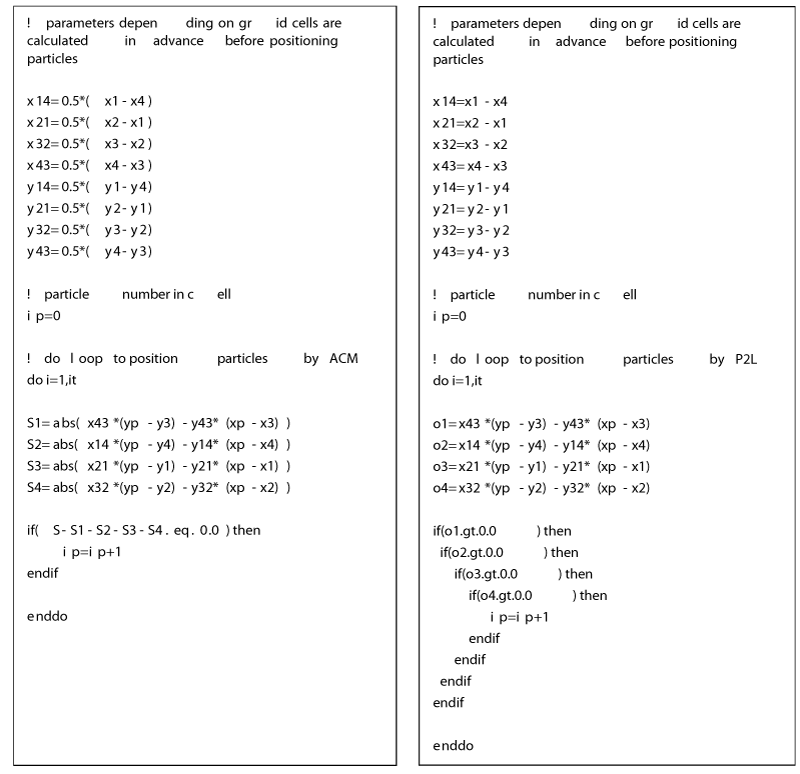
The basic parts of Fortran programs for the AC method and P2L are shown in Figure 9. In these programs, (x1,y1), (x2,y2), (x3,y3), and (x4,y4) are the coordinates of the vertices of a quadrangular cell, and (xp,yp) are the coordinates of the target particles, which are pre-determined so that the particles are within the cell for simplicity. The actual numerical values of these coordinates are not shown in Figure 9. In addition, ip is the number of the particles found in the cell, and it is the number of iterations of the do loop, which is equal to the number of the particles to position.
It is important to note that, for P2L and the AC method, the parameters depending only on the geometry of the grid cell system, such as x1-x4 and 0.5*(x1-x4), are calculated in advance before positioning particles in order to minimize the computational time. Furthermore, for the AC method, the area S of the cells is additionally calculated in advance. Moreover, it is of interest to note that the programs for the AC method and P2L are quite similar. The differences between these programs are as follows: the AC method employs absolute-value operators; moreover, P2L has four if statements, while AC method has only one. The if statement in the AC method contains subtractions, while the if statements in P2L have no arithmetic operations.
The operations of absolute value and subtractions in if statement may increase the computational time of the AC method, while four if statements may increase the computational time of P2L. The effects of these operations on the total computational times are examined as follows.
The complete Fortran programs are written in double precision, compiled using the commercial compiler PGI 19.10-0 with an optimization level of 4, and executed on a computer with an Intel Core i7-4770K processor running at a clock speed of 3.50 GHz. Table 1 lists the computational times for the AC method and P2L for different values of it. It is observed that the AC method is almost 1.2 times faster than P2L. Further, the programs are modified for triangular cells instead of the quadrangular cells, which decreases both the absolute-value operations in the AC method and the if statements in P2L. The results presented in Table 2 demonstrate that the AC method is almost 1.15 times faster than P2L.
Furthermore, through additional calculations, it is found that, in the case of quadrangular cell calculations, the absolute-value operations and the subtractions in the if statement, respectively, account for 14.47% and 31.35% of the computational time for the AC method. Further, the four if statements account for 90.23% of the computational time for P2L. Therefore, it can be concluded that P2L takes a longer computational time than the AC method owing to its use of multiple if statements.
In this paper, the computational times to determine the edge containing the exit trajectory are not compared between the AC method and T2L. However, the AC method is expected to be faster than T2L because of the same reasons. Moreover, the application of P2L and T2L to three dimensions will increase the number of if statements to a far greater extent than the AC method would.
Comparison of particle searching and positioning methods
In this section, computer simulations are conducted to investigate the speeds of searching and positioning particles using the methods introduced in Sections 2 and 3.
1) To search cells, the following three methods are considerSCR method
2) CCR method
3) Brute-force method
To position particles, the AC method is used for all the three methods.
We set three objectives for the simulations in this section:
1) Compare the computational speeds for searching and positioning
2) Study the characteristics of the parameters W and R
3) Determine the optimal values for these parameters
To accomplish the above objectives as comprehensively as possible, the particles are assumed to move with a simple potential flow around a circular cylinder, as an application of the present methods, and additional physical phenomena such as particle collisions are not considered. This simple potential flow is enough to study computational speeds of the present methods.
The diameter of the circular cylinder is 2, and the computational region is divided into 50 segments in the radial direction and 100 segments in the circumferential direction. This creates a denser grid system, as shown in red in Figure 10, than the red grid system in Figure 3. The smallest and largest areas of the red cells in Figure 10 are 0.00223 and 0.395, respectively. These two values are used later.
The computational procedure is as follows.
1) At time 0, 40 particles are equidistantly placed at the coordinates x = -6.95 and y = 0.01 + 0.04(i - 1) [i = 1–40].
2) The cells in which the particles exist are searched using the three methods mentioned above and confirmed using the AC method. As an exception, in the case of SCR, the cells of the initial positions of the particles are determined using the brute-force method.
3) For simplicity, as mentioned previously, the particles move with the velocities of the potential flow, u and v, which are given as follows:
where x and y are the coordinates of the particles. The time step Δt is set as 0.01, which is small enough to ensure that the distance of particle movement in one time step does not exceed one cell length.
4) The computation ends when all the particles reach x = 7.
First, the computational times of the brute-force method and SCR are measured as 0.9390 and 0.00405 s, respectively, demonstrating that the latter is 232 times faster. The times 0.9390 and 0.00405 s are used as the basis for comparison. The time for registration is not included here, because the registration is performed only once in advance, as mentioned previously. Nevertheless, the time for registration is discussed later in this section.
Figure 9 shows the trajectories of 10 out of the 40 particles. The trajectories create streamlines of a potential flow around a circular cylinder.
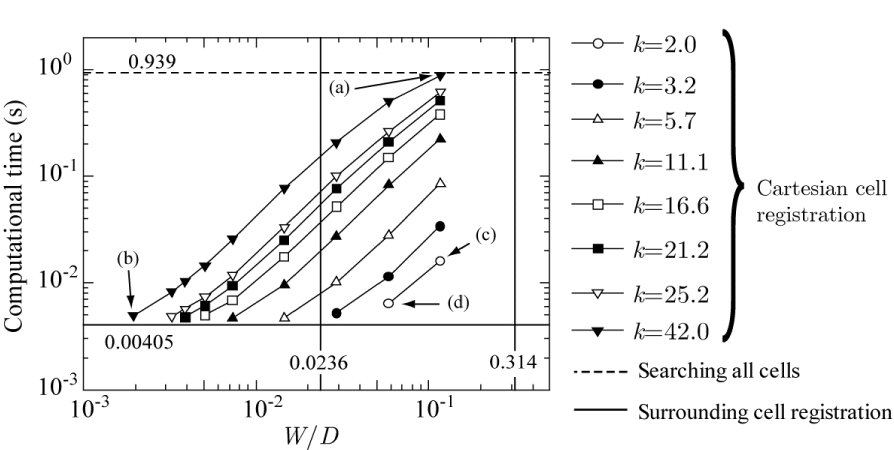
Next, the computational time of CCR is investigated. Figure 11 plots the computational time against the cell width W of the Cartesian grid system normalized by the cylinder diameter D for various values of the parameter k, which describes the radius as R = kW (see Figure 4). All the parameters are adjusted so that no red cells in Figure 10 are left unregistered with Cartesian grid cells (not shown in Figure 10).
As shown in Figure 11, all the computational times of CCR (symbols at k = 2.0–42.0) lie between those for SCR and the brute-force method, demonstrating that SCR method is the fastest (0.00405 s) and the brute-force method is the slowest (0.939 s). The minimum width of the target red cells ( ) and the maximum width ( ), where 0.00223 and 0.395 are, respectively, the smallest and largest areas of the target red cells, are indicated by vertical lines in Figure 11. All the Cartesian cell widths W/D adopted in this computation are smaller than 0.314, and almost half of them are smaller than 0.0236. This result suggests that the Cartesian grid cells are smaller than all of the target red cells when W/D < 0.0236, some of the target red cells are smaller or larger than the Cartesian grid cells when W/D > 0.0236, and none of the Cartesian grid cells are larger than the largest target red cell for all W/D values considered in this computation.
For example, when k and W/D are the largest (42.0 and 0.1166, respectively), as indicated by an arrow labeled “(a)” in Figure 11, the computational time is the largest (0.8818 s) among the results for k = 42.0. In this case, the radius R is also the largest (9.8); consequently, the average number of cells registered with each Cartesian grid cell is as large as 17662, because of which the search time is the largest. The Cartesian grid cells with which no cells are registered are excluded when calculating the average number of registered cells. All the target red cells are registered with the Cartesian grid cells, but this does not mean that all the Cartesian grid cells have cells registered with them. For instance, the Cartesian grid cells in the circular cylinder have no registered cells.
In contrast, when k = 42.0 and W/D is the smallest (0.001944), as indicated by the arrow labeled “(b)” in Figure 11, the computational time decreases to 0.00495 s. The radius R is 0.163, and the average number of registered cells is 15.13. This number is much smaller than that of case (a) (17662), making this computational time the shortest among the results for k = 42.0. Moreover, the computational time converges to the minimum value as the width of the Cartesian grid cell decreases.
When k is the smallest (2.0) and W/D is the largest (0.1166), as indicated by the arrow labeled “(c)” in Figure 11, the computational time is 0.0161 s, which is much shorter than that of case (a). The radius R is 0.4666, and the average number of registered cells is 120.4, which is less than that of case (a). When k = 2.0 and W/D is the largest (0.05833), as indicated by the arrow labeled “(d)” in Figure 11, the computational time is 0.00648 s. The radius R is 0.2333, and the average number of registered cells is as small as 30.66.
For all values of k, it is observed that the computational time converges to each minimum value as the width of the Cartesian grid cell deceases.
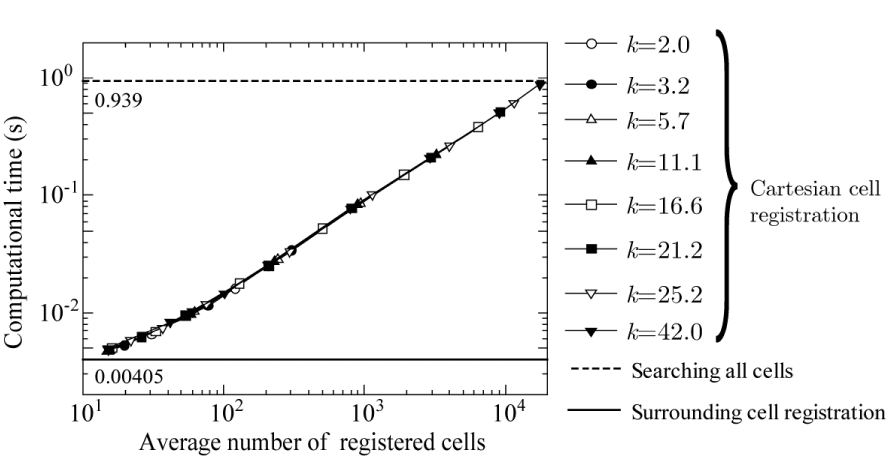
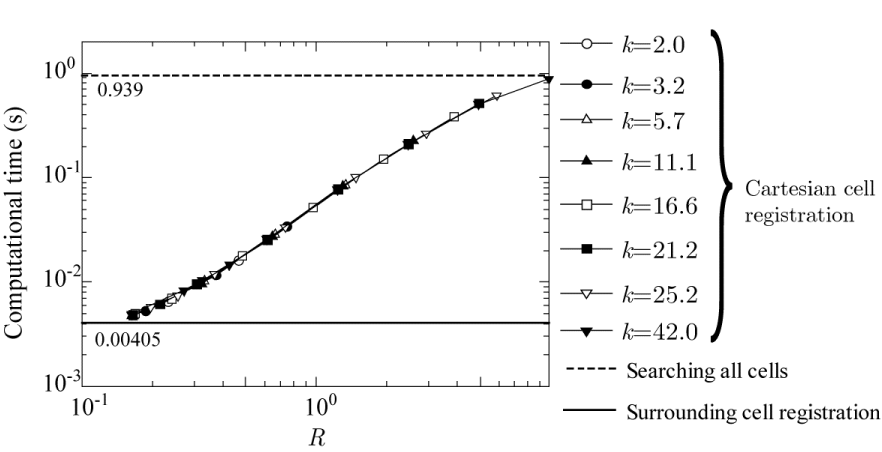
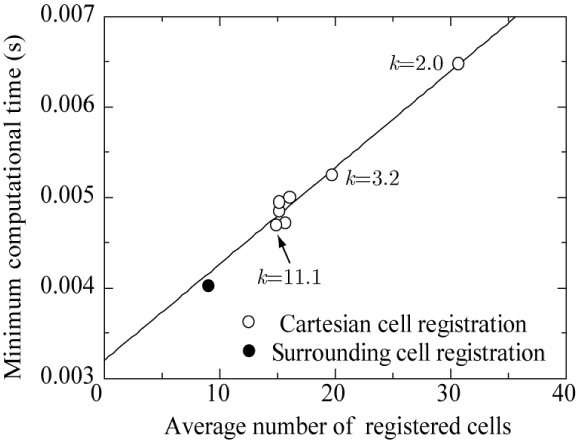
Considering that the computational time is strongly correlated with the average number of registered cells, the graph is redrawn with the average number of registered cells on the horizontal axis, as shown in Figure 12. The graph is also redrawn with R on the horizontal axis, as shown in Figure 13. Exceeding expectations, all the data in Figures 12,13 are sufficiently fitted by a single curve. This indicates that the computational time depends only on the average number of registered cells or R but not on W. Further, the lowest computational time is 0.00470 s for R = 0.1619 and an average number of registered cells of 14.859, which are obtained when k = 11.1 and W = 0.0146 (W/D = 0.0073). This proves that the width of the Cartesian grid cell has optimum values of W/D = 0.0073 and R = 0.1619, which are neither the largest (W/D = 0.1166) nor the smallest (W/D = 0.00194) in Figure 11. Moreover, it seems that the computational time of the surrounding cell registration method converges to 0.00405 s as the radius R decreases.
In Figure 14, a graph of the minimum computational time for each k in Figure 11 is drawn as a function of the average number of registered cells. The minimum computational time is observed to be proportional to the average number of registered cells. Therefore, if the average number of registered cells can be set to 9, the computation time would be the smallest (0.00405 s); this result is given by surrounding cell registration method, which has 9 registered cells including the central cell (Figure 1). However, it is quite difficult to adjust the parameters to decrease the average number of registered cells without having red cells unregistered in the target grid system considered in this paper. In future work, this may be possible if the parameter R is adjusted according to the density of cells.
Table 3 summarizes the lowest computational time for each method. SCR shows the best performance and is 232 times faster than the brute-force method. Furthermore, the performance of CCR increases as the average number of registered cells decreases. Consequently, at the optimal values of k = 11.1 and W/D = 0.0073, CCR method is 200 times faster than the brute-force method. Note that the optimal parameter values depend on the target grid system.
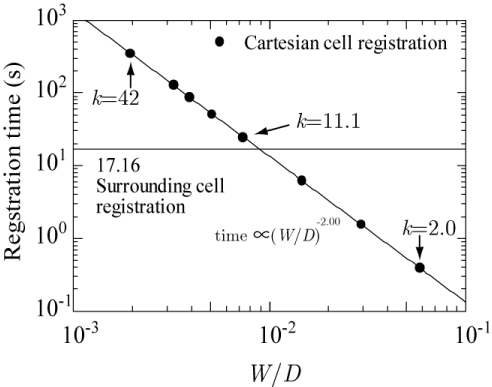
Because the cell registration is performed only once, unless the grid system is changed, the computational time of registration does not affect the time for searching and positioning, namely, for DSMC and multi-phase flow calculations. Even so, the registration time should not be prohibitively large. Figure 15 shows the registration time of CCR (filled circles) as a function of the normalized cell width W/D and that of SCR (horizontal line, 17.16 s). The registration time is observed to be inversely proportional to the square of W/D.
Although a smaller W results in a lower computational time, the registration time increases prohibitively. However, as mentioned previously, the best computational time is obtained when W = 0.0146 (k = 11.1, W/D = 0.0073), which is neither the largest (k = 2.0, W/D = 0.1166) nor the smallest (k = 42, W/D = 0.00194). The registration time of 24.763 s at k = 11.1 is quite moderate. Moreover, it is of interest to note that the registration time of 24.763 s is the closest among all data to the registration time of SCR (17.16 s), and the average number of registered cells at k = 11.1 (14.859) is also the closest among all data to that of SCR (9).
Conclusion and future work
This paper presented effective computational methods for particle searching and positioning that are applicable to structured and unstructured grid systems. SCR and CCR were introduced to limit the cells to search. In the former method, the cell numbers of the cells surrounding the central cell are registered with the central cell in advance to limit the cells to search later. In the latter method, the cell numbers of all the target cells on the target grid system having centers within an appropriate distance from the center of the Cartesian grid cell are registered with the Cartesian grid cell. By tracking particles moving with a potential flow around a circular cylinder, as an application of the proposed methods, SCR was demonstrated to be 232 times faster than the method of brute-force. Furthermore, CCR was demonstrated to be 200 times faster with the appropriate parameters. This simple potential flow is enough to study computational speeds of the present methods.
The AC method was introduced to position a target particle and to find the exit edge. It was demonstrated that the AC method can position particles 1.15-1.2 times faster than P2L positioning because the latter has multiple if statements while the former has only one. Moreover, AC method needs neither anticlockwise-ordered vertices of cells nor a vector describing the center position of each edge and edge normal vectors; rather, it requires only the coordinates of the vertices of cells.
The concepts of SCR, CCR, and the AC method are simple enough to apply to three-dimensional grids. In the future, we will first adjust the parameter R according to the density of cells to minimize the computational time for CCR. Secondly, we will perform DSMC and multi-phase flow calculations with unstructured grid systems using SCR, CCR, and the AC method. Thirdly, we will apply these three methods to three dimensions. Lastly, our methods must be applied to the recent study on the static detection of particle positions [18]. It is important to note that the particle size considered in our simulations was infinitesimal. Therefore, an appropriate mesh size will be required to analyze real experimental data of particles of finite sizes.
The author would like to thank Editage for English language editing.
- Bird GA (1970) Direct simulation and the Boltzmann equation. Phys Fluid 13: 2676-2681. Link: https://bit.ly/2OmxpaU
- Bird GA (1994) Molecular gas dynamics and the direct simulation of gas flows, Clarendon Press, Oxford. Link: http://bit.ly/3bgselO
- Shojaee S, Hosseini SH, Razavi BS (2012) Computational Fluid Dynamics Simulation of Multiphase Flow in Structured Packings. Journal of Applied Mathematics 2012: 1-17. Link: http://bit.ly/3uVEvUD
- Florice NM, Andrei K (2019) Modelling and Simulation of Multiphase Flow Applicable to Processes in Oil and Gas Industry. Chemical Product and Process Modeling 20170066: 1-16.
- Parsi M, Kara M, Agrawal M, Kesana N, Jatale A, et al. (2017) CFD simulation of sand particle erosion under multiphase flow conditions. Wear 376-377: 1176-1184. Link: http://bit.ly/2OmxGKY
- Blazek J (2015) Principles of Grid Generation. Computational Fluid Dynamics: Principles and Applications (Third Edition) Chap 11: 357-393. Link: http://bit.ly/388zDC0
- Chen H, Onishi T, Park J, Datta-Gupta A (2021) Computing Pressure Front Propagation Using the Diffusive-Time-of-Flight in Structured and Unstructured Grid Systems via the Fast-Marching Method. SPE J 1-21: SPE-201771-PA. Link: http://bit.ly/2MIxqpc
- Lee J, Lee J, Yun SL, Kim SK (2020) Three-Dimensional Unstructured Grid Finite-Volume Model for Coastal and Estuarine Circulation and Its Application. Water 12: 1-29. Link: https://bit.ly/3uVF151
- Hao D, Haiqing S, Huiying Z, Xiaozhu L (2019) Unstructured mesh generation based on Parallel Virtual Machine in cyber-physical system. EURASIP Journal on Wireless Communications and Networking 62: 1-11. Link: http://bit.ly/3kIMuQk
- Liang J, Yan C, Du BQ (2010) An algorithm study of three dimensional DSMC simulation based on two-level Cartesian coordinates grid structure. Acta Aerodyn Sin 28: 466-471. Link: https://bit.ly/3e79ZRP
- Wang Z, Li L, Zhang B, Liu H (2019) BCP particle positioning techniques for DSMC method.J Aeronaut Astronaut Aviat 51: 225-236. Link:
- Wang C, Cheng J, Ji L, Lu Y, Sun Y, et al. (2015) 2-D DSMC algorithm based on Delaunay triangles. J Tsinghua Univ (Sci Technol) 55: 1079-1086. Link: https://bit.ly/2OmzcwU
- Chorda R, Blasco JA, Fueyo N (2002) An efficient particle-locating algorithm for application in arbitrary 2D and 3D grids. Int J Multiph Flow 28: 1565-1580. Link: http://bit.ly/3beyPgX
- Zhou Q, Leschziner MA (1999) An improved particle-locating algorithm for Eulerian–Lagrangian computations of two-phase flows in general coordinates. Int J Multiph Flow 25: 813-825. Link: http://bit.ly/3rfjpP3
- Vaidya AM, Subbarao PMV, Gaur RR (2006) A novel and efficient method for particle locating and advancing over deforming, nonorthogonal mesh. Numer Heat Transf, Part B: Fundam 49: 67-88. Link: https://bit.ly/3rjG0Kb
- Macpherson GB, Nordin N, Weller HG (2009) Particle tracking in unstructured, arbitrary polyhedral meshes for use in CFD and molecular dynamics. Commun Numer Methods Eng 25: 263-273. Link: https://bit.ly/2PoJKMi
- Reji RV, Lal SA (2017) A new direct simulation Monte Carlo implementation for more efficient simulation of hypersonic flow over arbitrarily shaped bodies using dynamic cells. J Aerosp Eng 231: 82-97. Link: http://bit.ly/3rgCQXH
- Thapa S, Lukut N, Selhuber-Unkel C, Cherstvy AG, Metzler R (2019) Transient superdiffusion of polydisperse vacuoles in highly motile amoeboid cells. J Chem Phy 150: 144901-1-144901-18. Link: https://bit.ly/3sJVHe3
Article Alerts
Subscribe to our articles alerts and stay tuned.
 This work is licensed under a Creative Commons Attribution 4.0 International License.


 Save to Mendeley
