Open Journal of Plant Science
A new method for rapid screening of seed vigority of cereals
Mansour Taghvaei*
Cite this as
Taghvaei M (2023) A new method for rapid screening of seed vigority of cereals. Open J Plant Sci 8(1): 001-004. DOI: 10.17352/ojps.000050Copyright
© 2023 Taghvaei M. This is an open-access article distributed under the terms of the Creative Commons Attribution License, which permits unrestricted use, distribution, and reproduction in any medium, provided the original author and source are credited.Seed deterioration is one of the major problems in agricultural production in arid and semi-arid regions. Seed deterioration reduces seed vigor and seedling establishment in the field. To introduce methods with sufficient sensitivity to more accurately determine the degree of grain deterioration, various methods have been developed under the conventional name of "vigor tests". This study aims to provide a rapid method for assessing seed vigor using the electrical conductivity test. The germination test and emergence test were performed in a completely randomized design with three replications. Treatments included the Tritipyrom line at 13 levels and seed deterioration at two levels. Germination percentage, emergence percentage, and electrical conductivity were significantly affected by seed deterioration. The highest electrical conductivity and the lowest electrical conductivity were respectively related to the lines of (Ka/b)(cr/b)F2 and (St/b)(Cr/b)F4. Although the lines are not significantly different in terms of germination and emergence percentage. Electrolyte leakage in aged seeds increased sharply in the first hours and then had a diminishing, after which it stopped and followed the logarithmic model, But the lines were different in terms of the slope of the first part of the graph (which was exponential).with its help, we can classify the lines or variety in terms of the amount of cell leakage, which indicates the amount of cell permeability. The highest (37.03) and lowest (29.01) slopes in the exponential part of the graph were related to the numbers (Ka/b)(cr/b)F2 and(St/b)(Cr/b)F4 line respectively. Therefore, by using a simple and quick four-hour electrical conductivity test, cultivars can be classified in terms of storage potential and early vigor.
Introduction
After maturity, the seed on the mother plant reached its maximum quality (physiological maturity), gradually wears out and its vigor decreases. This process of seed deteriration will probably accelerate with the increase in temperature in the future due to global warming.The deterioration of the seed causes a decrease in the quality and percentage of seed emergence and establishment. The use of low vigor seeds causes damage to the farmer, so that almost every year 25% of harvested seeds are lost due to deterioration or their quality is greatly reduced [1]. During the deterioration process, the first component that decreases is seed vigor, which appears as a decrease in germination capacity and sprouting power. Electrical conductivity test is suggested as a test to determine the physiological potential of seeds, evaluate seed vigor and estimate seed storage capacity [2] .This biodiversity can be observed in cultivars of the same plant species. Its purpose is to indirectly assess the degree of cell membrane damage or permeability caused by seed deterioration by determining the amount of ions released from the seed in a solution with a constant volume of deionized water. The seeds that release a larger amount of electrolytes have a lower physiological potential and naturally have a lower seed vigor [3]. Many researchers reported a decrease in standard germination after accelerated aging test, along with an increase in electrical conductivity values. Thus, the electrical conductivity test is recommended and used to evaluate crop seed vhgor. This test is more recommended for legumes, especially soybean [4]. Although it has been used for other products due to its simplicity in implementation and fast response. The speed of aging is strongly influenced by genetic characteristics and then environmental factors such as storage temperature, seed moisture content and seed quality [5]. A quick method to evaluate seed storage capacity is to perform accelerated aging (AA) test and germination test under controlled conditions [2]. So that after the AA test, the seeds with higher vigor produce a higher percentage of normal seedlings than the seeds with lower vigor [6]. Another obvious way to evaluate the storage potential of seeds is to ascertain the electrical conductivity (EC), pH level, and cell leakage of solutes during water uptake by seeds after inducing artificial aging and performing controlled deterioration experiments [7]. With increasing age, the seed gradually ages and loses its ability to germinate and survive. Aging in higher plants is a type of programmed cell death that is included in a genetically determined developmental process, so each seed mass has its own lifespan, which may be short or long. The term aging is therefore used for the process that leads to the death of a cell, organ or a whole plant and occurs in the final stage of its life. Although the process of seed aging is very complicated, detecting seed deterioration through accelerated aging and electrical conductivity can be introduced as a simple method to estimate the storage potential for the seed industry. The main challenge for research on seed tests is to introduce simple and fast methods related to seed deterioration, to estimate seed vigor before losing germination capacity and quality during storage, to determine the time of replanting seeds in the gene bank. It seems that by using the equation of the electrical conductivity trend of aged seeds over time, it is possible to evaluate and screen the cultivars from this point of view. The purpose of this investigation is to investigate the process of electrolyte leakage in seeds, in order to achieve a simple, shorter an and quick method to evaluate seed germination during storage.
Materials and methods
Two experiments were conducted in the Seed Science and Technology Laboratory of the Faculty of Agriculture, Shiraz University. Seeds was obtained from the Gen bank of the Plant Prodation and Gentics department of Shiraz University which was prepared by Dr. Hossain Shasavand. Seed moisture content: was measured before and after conducting an accelerated aging test by the oven method [8]. The study was performed in experiments based on completely randomized design in the growth chamber in three replicates. The treatments included deteriurated seeds in two levels [(control (non aged seed) and aged seed)] and trity pyrom line in 13 levels (La/b, (Ka/b) (Cr/b) F5, (Ka /b) (Cr/bF2, La(4B,4D)/b, Ka/b, St/b, (Ma/b)(Cr/b)F3, (Ma/b)(Cr/b)F4, ( St/b)(Cr/b)F4, Cr/b, Az/b, (Ka/b)(Cr/b)F3, (Ka/b)(Cr/b)F6. For the accelerated aging test 25 healthy, homogeneous and undamaged seeds from each line were weighed and placed in plastic boxes (inner chamber) containing 40 ml of distilled water (100% relative humidity) for 72 hours at a temperature of 40 degrees Celsius. For the germination test, three replicates of 25 seeds from each treatment were sown in the peri-dish using the TP (top of paper) method. The seeds were considered to have germinated when the emerging radical wasbeing visible to the naked eye [9]. For the emergance test, three replicates of 25 seeds from each treatment were planted in a plastic box (10 x 13 x 25 x 25 cm) at a depth of 3 cm in the soil. Normal seedlings were counted after 7 days. Germination and emergence percentage was calculated for each treatment according to the following equation.
GP or EP = number of germinated or emerged seed* 100/n
Where, GP is Germination percentage, EP is emergence percentage, and n is the number of seed planted
Reduction percentage (RP)
Reduction percentage (RP) of germination percentage (GP), emergence percentage (EP), compared to control were calculated by the following equation.
Nx is the number of the germinated or emerged of aged seeds and Mc is the number of the germinated or emerged of non aged seeds.
For electrical conductivitiy test, four replicates of 50 seeds were weighed and soaked in 40 ml of distilled water at 20 ºC in the dark. Then, the electrical conductivities (ds/cm.g) of the solutions were recorded with an electrical conductivity device (K220 Consort) at one-hour intervals. In all experiments, the deionized water had conductivity lower than 7 μS/cm. The electrical conductivity of line was plotted against time and then the line of best fit was drown by the logarithmic model.
Statistical analysis
Data were analyzed using the statistical softwater SAS, version 9.3 after the normality test by Kolmogorov–Smirnov normality test, and graphs were plotted using Excel softwater.The means were compared to the LSD test at a 5% level.
Results and discussion
The average germination percentage and emergence percentage were significantly affected by accelerated aging (Table 1). In all lines, germination percentage and green percentage in aged seeds decreased greatly, but the reduction percentage was not the same in the lines, so the highest and lowest percentage decrease in germination percentage and emergence percentage were in line )Ka/b)(cr/b)F2 and (St/b)(Cr/b)F4 was observed (Table 1). Germination ability and germination percentage decrease with increasing seed aging period in Capsicum annuum Linn seeds [10].
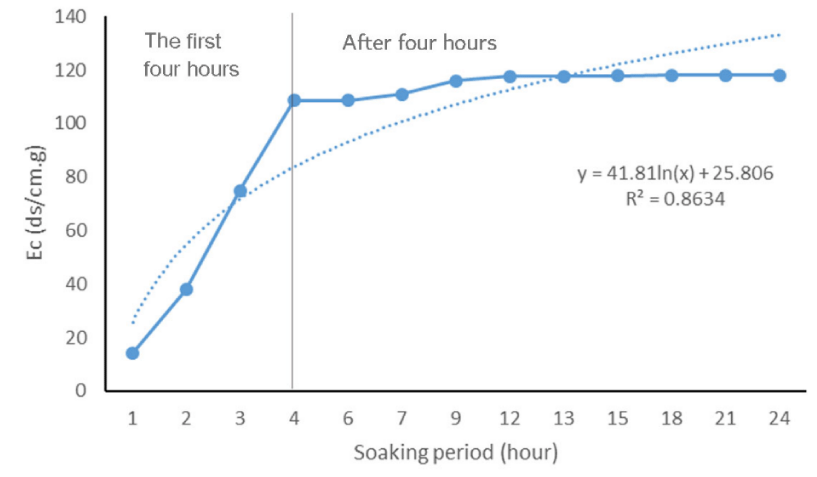
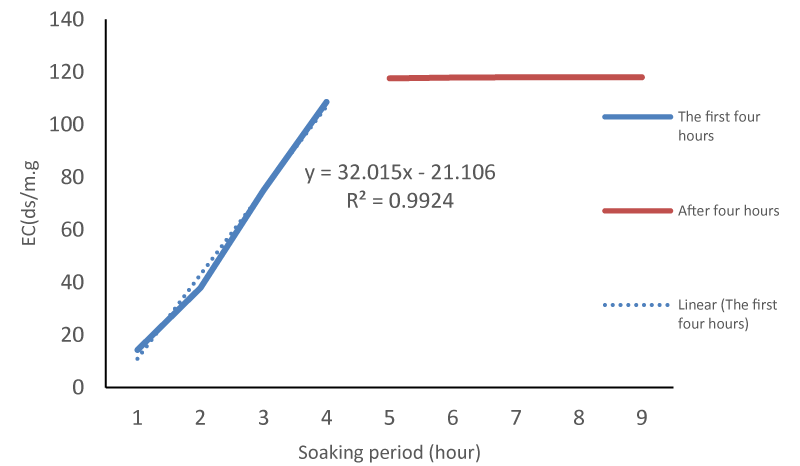
The reactions of Tritipyrum lines are different in terms of storage potential, which indicates genetic diversity in these lines. The average comparison showed that the average electrical conductivity (μS cm-1 g-1) was affected by the lines. The highest electrical conductivity and the lowest electrical conductivity were respectively related to the lines of )Ka/b)(cr/b)F2 and (St/b)(Cr/b)F4 (Table 1). The reactions of Tritipyrum lines are different in terms of storage potential, which indicates genetic diversity in these lines. Similar results have been reported about Alfalfa [11] and Sunflower [12] cultivars by other researchers. Electrolyte leakage in aged seeds increased sharply in the first hours and then had diminishing returns and then almost stopped. In all lines, the highest cell leakage occurred in the first and second three hours, and in almost all lines, cell leakage reached its highest level in the nine hours of soaking. In all lines, after the 9th hour, the process of cell leakage almost decreased. High temperature and humidity causes deterioration and reduction of seed quality, and these parameters are factors for predicting the longevity of seeds [13,14]. Seed deterioration by moisture and high-temperature results in increased mean germination time, slower root and shoot of seedling growth rates, increased abnormal growth, decreased tolerance to adverse conditions, and finally loss of germination ability. The highest (37.03) and lowest (29.08) slopes in the exponential part of the graph were related to the numbers )Ka/b)(cr/b)F2 and (St/b)(Cr/b)F4 line respectively (Table 1).The trend of cell leakage in all lines followed a sigmoid trend Although their slopes were different (Figure 1). Similar results have been reported about corn by other researchers [15,16]. This sigmoid diagram consists of three parts so that in the first four hours, the amount of leakeg from the seed into the solution is high and has an exponential shape, and the electrical conductivity increases rapidly, but in the next four hours, it increases with a low speed, and in the next two hours, It has a very low rate and has come to the asymptotic state with the X axis (Figure 1). If we measure the slope of the first part of the graph, i.e. the first four hours, with its help, we can classify the lines or variety in terms of the amount of cell leakage, which indicates the amount of cell permeability with very high accuracy )R2 = 0.99) (Figure 2).
Conclusion
The accelerated aging process is a good technique for prodict of deteriorating seeds under stress conditions. The seed deterioration rate during storage could be determined by the rate of leakage of the seed. In this study, the seed germination and emergence correlated well with increased electrolyte leakage slope, thus germination ability can be forecasted by leakage slope. The results suggest that early leakages slope in accelerated aging is closely related to membrane damage that can be used for screening seed for vigor and storability. The process of electrolyte leakage from seeds followed the logarithmic model and using this model, the rate of cell leakage can be predicted with very low accuracy (R2 = 0.86). Although the ISTA instructions of the comparison scale of cultivars are the amount of cell leakage after 24 hours after soaking the seeds at a certain temperature. Our results showed that it is possible to use the slope of the electrical conductivity of seeds in the first four hours with high accuracy (R2 = 0.99). This method can speed up the screening of seeds of different cultivars and save time, especially when we want to evaluate large masses of seeds.
- McDonald MB. Seed deterioration: physiology, repair and assessment. Seed Science. 1999.
- Marcos-Filho J. Seed vigor testing: an overview of the past, present and future perspective. Sci Agr. 2015; 72:363–374. 36(1):71-78.
- Ortiz TA, Gomes GR, de Siqueira Vengrus NA, Anschau R, Assari Takahashi LS. Electrical conductivity test for evaluating physiological quality in snap bean (Phaseolus vulgaris L.) seeds. Austrulian Journal of Crop Science. 2018; 12(10):1561-1565.
- Hampton JG, Tekrony DM. Handbook of vigor test methods 3.ed. Zurich: ISTA, 1995; 117.
- Pang SY, Ho PW, Liu HF, Leung CT, Li L, Chang EES, Ramsden DB, Ho SL. The interplay of aging, genetics and environmental factors in the pathogenesis of Parkinson's disease. Transl Neurodegener. 2019 Aug 16;8:23. doi: 10.1186/s40035-019-0165-9. PMID: 31428316; PMCID: PMC6696688.
- Baalbaki R, Elias S, Marcos Filho J, McDonald M. Seed vigor testing handbook. (no. ser. 32), Ithaca, New York: Association of Official Seed Analysts. 2009; 346.
- Association off Official Seed Analysis. 2002. Seed vigor testing handbook. Lincoln 105.
- ISTA. 1996. International Seed Testing Association (ISTA). International rules for seed testing. Seed Sci and Tech 1996; 24:1-335. Supplement.
- Adam NR, Diering DA, Coffelt TA, Wintermeyer MJ. Cardinal temperatures for germination early growth of two Lesquerella species. Industrial Crops and Products. 2007; 25: 24-33.
- Kaewnaree P, Vichitphan S, Klanrit P, Siri B, Vichitphan K. Effect of Accelerated Aging Process on Seed Quality and Biochemical Changes in Sweet Pepper (Capsicum annuum Linn.) Seeds. Biotechnology. 2011; 10: 175-182.
- Sadrabadi R. Comparison of potassium leachate and electrical conductivity tests in alfalfa seed vigor evaluation. Agricultural research in Iran. 2008; 5: 97-108.
- Szemruch C, Gallo C, Murcia M, Esquivel M, García F, Medina J, Magnano L. Electrical Conductivity Test For Predict Sunflower Seeds Vigor. SSRG International Journal of Agriculture & Environmental Science (SSRG-IJAES). 2019; 6.
- Bewley JD, Black M. The Physiology and Biochemistry of Seeds. Berlin, Springer-Verlag. 1982; 375.
- Hartman Filho CP, Goneli ALD, Masetto TE, Martinse EAS, Obe GC. The effect of drying temperatures and storage of seeds on the growth of soybean seedlings. Journal of Seed Science. 2016; 38: 287-295.
- Sivritepe HO, Senturk B, Teoman S. Electrical Conductivity Tests in Maize Seeds. Adv Plants Agric Res. 2015; 2(7): 00075.
- Taghvaei M . A Simple Method for Rapid Screening of Seed Storage Potential (case study Tritipyrum lines) . The first international conference of Iranian seed science and technology. 2021.
Article Alerts
Subscribe to our articles alerts and stay tuned.
 This work is licensed under a Creative Commons Attribution 4.0 International License.


 Save to Mendeley
