Open Journal of Plant Science
Evaluation of tomato (Lycopersicon Esculentum Miller) varieties for nematode and ralstonia diseases resistance and productivity
Alemu Tsega Alene1* and Zelalem G Mariam2
2Department of Biology, Applied Genetics, Hawassa University, Ethiopia
Cite this as
Alene AT, Mariam ZG (2021) Evaluation of tomato (Lycopersicon Esculentum Miller) varieties for nematode and ralstonia diseases resistance and productivity. Open J Plant Sci 6(1): 001-010. DOI: 10.17352/ojps.000025Tomato is one of the most remunerable and widely grown vegetables in the world. The objective of this study was to evaluate tomato varieties for nematode and Ralstonia diseases resistance and productivity. The experiment was conducted under a complete randomized design experiment with three replications at Hawassa University shade house. Four varieties of tomato were inoculated with nematode (Meloidogyne incognita), Ralstonia solanacearum and mixed bacteria (Bacillus subtilis, Pseudomonas) in single and in combination of them with a total of six treatments. The multivariate analysis of variance showed a significant effect both for varieties and treatments for most yield and growth parameters except for unmarketable fruit yield per plant and weight of unmarketable fruit per plant. Tomato var. Venise produced the highest total yield (7556.33g) whereas Galilea variety gave the lowest total yield (2656.4g). Based on the yield performance, nematode and ralstonia resistance rating, Venise was found to be the best tomato variety followed by Awassa for disease resistance and productivity. Variety Galilea was severely affected by Meloidogyne incognita as well as by the Ralstonia solanacearum and produced the lowest marketable fruit percentage. None of the tomato varieties was found highly resistant (0 % disease severity) to Meloidogyne incognita and Ralstonia solanacearum. Therefore, there is a need to develop nematode and Ralstonia-resistant tomato varieties.
Abbreviations
DIP: Disease Incidence Percentage; DSP: Disease Severity Percentage; LR/S: Level of Resistance or Susceptibility; MY: Marketable Yield; MY%: Marketable Yield Percentage; UNMY: Unmarketable Yield; UNMY%: Unmarketable Yield Percentage; MA: Multivariate Analysis of Variance; RCD: Randomized Complete Design; SPSS ver.22: Version 22 Statistical Package for Social Science; HR: Highly Resistant; R: Resistant; MS: Moderately Susceptible; S: Susceptible; HS: Highly Susceptible
Introduction
Tomato is one of the most widely grown vegetables in the world; However the production and productivity of tomato in Ethiopia are often very low as compared to the production in many African countries and the world average. This is because the production is adversely influenced by various biotic factors. The principal biotic constraints in Ethiopia are diseases [1]. Various management practices have been adopted for the control of diseases in tomato varieties such as the application of pesticides, inorganic fertilizers. Although, the application of fertilizers and pesticides have a major role to play for the successful cultivation of tomato crop continuous, excessive and imbalanced use may lead to ill health and ecological hazards resulting depletion of physicochemical properties of the soil and ultimately poor crop yield [2]. Hence, there is a need for alternative sources of safe nutrient fertilizers which may boost crop yield without having adverse effects on soil properties. So far no research has been done to evaluate quantity and quality of fruit grown in the greenhouse and though it was done in open field area, but also no varieties were screened for protected cultivation systems. There has been lack of information regarding resistance to bacterial wilt and root-knot nematode in locally available tomato varieties.
Plant Growth Promoting Rhizobacteria (PGPR) are free - living, soil - borne bacteria, which enhance the growth of the plant either directly or indirectly. The direct mechanisms involve nitrogen fixation, phosphorus solubilization, and production of phytohormones such as auxins, cytokinins and gibberellins and lowering of ethylene concentration. Bacteria belonging to the genera Azospirillum, Pseudomonas, Xanthomonas and Rhizobium as well as Alcaligenes faecalis, Enterobactercloacae, Acetobacter diazotrophicus and Bradyrhizobium japonicum have been shown to produce auxins which help in stimulating plant growth [3]. In view of this study, disease resistance tomato varieties can be screened to solve a disease spread and infection. Cultivation of disease-resistant varieties is effective, economical and safer and it is the most important tool in Integrated Disease Management (IDM). Combining microbial inoculants and resistant varieties are currently becoming well known in the production of healthy seedlings and technology for large-scale production of tomato varieties [4].
Experimental design
Nursery house: Seeds of four tomato varieties were bought from Meki commercial Agriculture Center and grown following standard procedure in a nursery under greenhouse condition. The nursery was made of four beds consisting of 4m2surface areas of each. These corresponded to four varieties of tomato seeds used in this experiment. Seeds were sown in holes of about 2 cm deep in a nursery greenhouse. The distance between neighboring holes was 10cm. The sowing consisted of depositing seeds in the holes and then covered them with soil. The beds were then watered with one watering can full per bed. Care was taken to make sure the nursery was in a good state. This was done by ensuring daily watering two times a day (morning and evening) with 20 L water per bed before germination.
Shade house: A pot experiment was carried out under a shade house. A shade house area of 7×15m (105m2) was prepared in the experiment, with 6 inoculants and four varieties of tomato. All inoculants were applied as single or combined, under experimental conditions. Seedlings were arranged in a Completely Randomized Design (CRD) with three Replicates within a 4×3×6 design (4 Varieties, six inoculants, and three replications). There were four tomato varieties in experiments with two preconditioning factors which were inoculants and varieties of tomato. Each experimental design was contained 24 pots, three replication and 72 total pots.
Treatment procedure: A 1500kg field soil was collected from tomato growing area. A total of Seventy two pots were prepared and filled with 20 kg soil to each pot. Healthy three-week-old seedlings when contained two - four leaves and 12 to 15 cm long were transplanted from the nursery into 15 ml pot until the fruit ripening period. Three tomato seedlings were planted per pot and the pots were leveled according to treatments added. Seedlings were watered daily with water to maintain the moisture water holding capacity of the soil. After two weeks the tomato seedlings were thinned to two plants per pot. A distance of 1m between pots was maintained to avoid cross-contamination during watering and 20cm between seedlings. After transplanting, seedlings of tomato were inoculated with five treatments T2 (nematode: Meloidogyne incognita), T3 (Ralstonia only (Ralstonia solanacearum), T4 (combination of Meloidogyne incognita and Ralstonia solanacearum), T5 (combination of Meloidogyne incognita and Ralstonia solanacearum and mixed bacteria (Bacillus subtilis and Pseudomonas), T6 (mixed bacteria only (Bacillus subtilis and Pseudomonas) and T1 (controlled group). Eighteen days after transplanting, seedlings assigned to T5 and T6 were inoculated with 15ml of mixed bacteria (Bacillus and subtilis, Psedomonas) only per plant [5] and thirty days after transplanted, seedlings which were assigned to T2, T3 and T4 were inoculated with 10 ml of Meloidogyne incognita, Ralstonia solanacearum and Ralstonia solanacearum plus Meloidogyne incognita per assigned plant respectively and seedlings which assigned to T1 were served as a checked. M. incognita were taken after thirty days of M. incognita second stage juveniles (J2) inoculation on tomato roots were washed thoroughly with tap water and count the nematode root galls in the infected roots in water filled clean glass Petri dishes. Nematode egg masses were assessed by gently washing the roots, followed by immersing a 0.5 gm root subsample in 0.015% Phloxine-B for 15 min to stain the egg masses [6] Root Gall Index (RGI) and Egg Mass Index (EMI) were scored on each treatment on a 0-4 basis with 0 = no galls or egg masses, 1= 1 or 2 galls or egg masses, 2= 3-10 galls or egg masses, 3= 11 -30 galls or egg masses, and 4= 31 -100 galls or egg masses.
Data collection
Assessment of growth parameters
The growth parameters considered were:
A number of leaves per plant: The number of mature leaves per plants after transplanting of the seedlings.
Plant height (cm): Plant height measurement was made from the soil surface to the topmost growth points of the above-ground plant part. The measurement was taken as the length from all plants of each pot at the last harvesting time.
Leaf length: The average length of leaves taken from uppermost, at middle and at the lower part of the stem.
Days to 100% flowering: Is the number of days where 100% of all plants started blooming beginning from the days of transplanting.
A number of flowers per plant: The number of flowers of all plants at 100% flowering stage from each plot were counted.
A number of branches per stem: Numbers of primary, secondary and tertiary branches per stem of all plants at final harvest were counted.
Disease assessment
Disease incidence (%) is the percentage of diseased plants or parts in the sample or population of plants. It can be the proportion or percentageofdiseasedleavesina plant, diseased stalks or a tiller or diseased seedlings in a shade house (Table 1).
Disease severity(%), is the relative or absolute areaof plant tissue affected with disease (sometimes called “intensity).
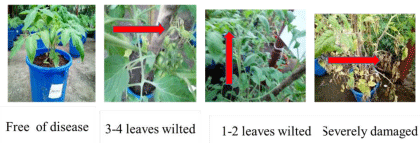
The qualitative data (severity of all treatments on tomato attack) were observed on a damage rating scale ranging 0–4 with 0 = highly resistance (0%), 1=Resistance (1-25 %) 2= moderately resistance (26-50%), 3=Susceptible (51-75), 4= Highly Susceptible (76-100%) [7] Table 1.
Yield assessment
Fruits were harvested from all plants in the experiment. The harvest was progressive as the fruit got ripe (evidenced by the red color) till the plants died off. Fruits were progressivelyharvested from successful plants in the experimentasthey got ripe. All the fruits of one plant were weighed after harvest using an electronic balance with a precision 0.1 g to calculate the yield per plant.
A number of fruits per plant: The number of red ripe fruits of per individual plants.
Marketable fruit weight per plant: The marketable yields of all plants were determined during harvesting by sorting dried fruits according to color, shape, shininess, firmness and size of the fruits. After drying, the dried marketable fruits were separated; the weight of the respective categories was recorded and converted to per plant.
Unmarketable fruit weight: is the yield which was obtained by sorting the diseased, discolored, shrunken shape and small-sized, totally unwanted fruits by consumers from marketable dried pods were recorded at each harvest per plant.
Total fresh fruit yield per plant: Weight of total (marketable and unmarketable) fruits harvested at each successive harvesting from the sample plants were recorded and summed up to estimate yield per plant.
Average fruit weight per plant (g): The mean number of fruits per each tomato plants.
The number of unmarketable fruit per plant: is the number which was obtained by sorting the diseased, discolored, shrunken shape and small-sized, totally unwanted fruit by consumers from marketable was recorded.
The weight of a single fruit per plant: The weight of a single fruit per each plant of tomato varieties.
The number of marketable fruit per plant: The number of marketable fruit per plant of each variety of tomato plants.
Data compilation and analysis
Both descriptive and inferential statistics were done using SPSS ver. 22. Data were subjected to a two factor multivariate analysis (MANOVA) and means of fruit were compared with SPSS version 22 Software [9]. Analysis of variance was performed on data and means were separated by Levene's test (P≤0.05). F tests were done on individual experiments for both the inoculated seedlings and controlled group. Severity and incidence percentage ratings ranged from 0% to 100% and therefore were calculated. Visual disease ratings (incidence and severity leaves, petioles and stems) were made by visually examining each replication from the non-inoculated varieties and assigning each cultivar a descending number based on the severity of early nematode, ralstonia, and mixed bacterial infection, et al. [10]. Growth and yield parameters were evaluated under collected data after inoculation. The yields were harvested 3 months after transplanting and the yield was determined according to the fresh weight of the tomato fruits per plant [11].
Results and discussion
A multivariate analysis of variance was performed using varieties and inoculants as main factors on growth performance, yield performance and disease resistance percentage. The multivariate analysis of variance showed a significant effect for inoculants, varieties and interaction of inoculants and varieties for growth and yield parameters and disease.
Growth parameters
Estimated marginal means of the interaction effect between varieties and inoculants on growth parameters and yield parameters were presented in Table 2. A two way MANOVA on variety and treatments as main factor showed a significant effect (p ≤ 0.05) for most growth parameters (e.g. number of branches, number of flowers, number of leaves and days to 100 % flowering) but indicated a non-significant effect for leaf length and plant height at (p ≤ 0.05). Post-hoc comparisons using Scheffè tests revealed significance difference between Bridget 40 and Galilea. A similar work done by Falak, et al. [12] found a significant effect on growth parameters among the tomato varieties in the battle valley of district Mansehra, Khyber Pakhtunkhwa.
The highest mean number of branches was observed from variety Awassa (Table 2) inoculated with mixed bacteria, whereas the least mean number of branches was recorded from Galilea (Table 2) inoculated with nematode and ralstonia together. A significant difference was recorded among tomato varieties for number of branch per plants (Table 3). This result is in agreement with that of Gebisa Benti [13] who reported significant variation among the cultivars of tomato for the number of branches per plant. The highest leaf length was recorded from Variety Awassa (Table 2) inoculated with Nematode, Ralstonia and Mixed Bacteria together but the least leaf length was recorded variety Awassa (Table 2) without inoculation. With regard to flowering time varieties Awassa and Venise flowered earliest however varieties Briget and Galila flowered late. Variety Galilea had the longest days to 100% flowering inoculated with ralstonia and nematode combined whereas Venise has the shortest days to flowering inoculated by the mixed bacteria. The highest number of flowers per plant was recorded for variety Awassa inoculated with mixed bacteria. However, the least number of flowers per plant was observed for Galilea inoculated with the treatments of ralstonia and nematode. The highest numbers of leaves were observed in the variety Awassa inoculated by mixed bacteria whereas the lowest number of leaves was recorded in variety Galilea inoculated by the combination of nematode with ralstonia treatment. The tallest plant height was recorded from variety Awassa (Table 2) with un-inoculated but the shortest plant height was attained from variety Galilea inoculated with the combination of ralstonia and nematode. In general, the analysis growth parameter indicated a difference between varieties and inoculants. The results of present study showed an increasing tendency in the number of branches per plant with an increase in the plant height. Similarly, Fayaz [14] reported significant variation among the cultivars of tomato for the number of branches per plant. Generally, tomato variety Awassa has better morphological parameters with different inoculants especially inoculated with mixed bacteria acts as bio-fertilizer which enhances plant growth promoting bacteria and produces antibiotic and enzymes for defensive mechanisms of the inoculated diseases.
Disease incidence percentage of varieties of tomato
The results of the present study showed that the tomato varieties have a significant difference in terms of their disease resistance capacity. A various level of disease severity and incidences were recorded for the different inoculants in single and combination (i.e. Ralstonia, nematode, nematode coupled with Ralstonia, a combination of ralstonia, nematode and mixed bacteria) on the different tomato varieties. Zainab [16] reported that the tomato plants are susceptible to disease at all stage of their growth but yield reductions were determined to great extent by the stage at which tomato plants become infected. Average disease incidence of tomato variety of Awassa, Briget40, Galilea and Venise were 44.44% 38.88, % 55.55% and 22.22% respectively. This indicated that variety Galilea had the highest susceptibility, whereas the least incidence was observed for variety Venise. Furthermore, all varieties were not affected by mixed bacteria only. Based the level of the incidence variety Venise had more resistant but variety Galilea is the least resistant. There was a variation on the magnitude of disease incidence among the different varieties, which may be due to different resistance ability during the growth period of the plant. Several factors (e.g. genetic, environmental or genotype environment integration) could contribute to the susceptibility tomato plant to various pathogens. For instance, María [16] proposed plant infection by bacterial spot is favored by frequent rainfall and high temperatures.
The tomato varieties considered in the present study responded differently to the inoculants applied (Figure 1).For instance, variety Awassa was more susceptible to the combined application ralstonia and nematode. This was evidenced by the threefold disease of incidence of by the combined treatment of Ralstonia plus nematode (i.e. 37.5%) compared to that of Ralstonia and nematode together with mixed bacteria (i.e. 12.5%).Similarly variety Briget 40 was highly susceptible to the combined treatment of ralstonia plus nematode (i.e.42.8%) whereas treatments of Ralstonia, nematode together with mixed bacteria and nematode has the lowest (14.3%). Zachee [9] showed that disease parameters were the main indices to characterize the resistance of plant species under natural conditions.
Disease severity percentage of nematode
The nematode resistances ratings of tomato varieties (percentage of tomato plants damaged by nematode) were presented in Table 4. None of the tomato variety was found highly resistant to the nematode inoculation. Tomato var. Galilea had the highest severity (i.e. 66.66%) affected by nematode followed by Briget40 (i.e. 33.33%). The least percentage of plants that were affected by nematodes was observed in variety Venise (i.e. 8.33%). Jaiteh, et al. [17] reported that nematode resistance in host plants was manifested by reduced rates of nematode reproduction, egg masses and consequently, low nematode population densities than that of a susceptible one.
Disease severity percentage of Ralstonia (Ralstonia solanacearum)
The ralstonia resistance degrees of tomato varieties (percentage of tomato plants damaged by Rralstonia) were presented in Table 5. None of the tomato variety under evaluation was highly resistant to Ralstonia. Variety Venise was the least affected (i.e. 16.66%) whereas as variety Galilea was highly affected (i.e. 58.33%) by Ralstonia. Development of disease resistant tomato genotypes is the most efficient and environmentally friendly way to control the diseases when sufficient genetic variation for resistance is available and therefore plant breeders can upgrade the existing tomato varieties through cross-breeding. Jaiteh, et al [17], demonstrated that at moderate to high initial population densities, ralstonia reached their maximum levels on a susceptible cultivar. Whereas on partially resistant cultivars had less damage by the nematodes, the population densities were still increasing.
Disease Severity percentage of Ralstonia solanacearum combined Meloidogyne incognita
The Ralstonia and nematode resistance rating of tomato varieties (percentage of tomato plants damaged by Ralstonia combined nematode) is presented in Table 6. The results of the present study indicated that var. Awassa was resistant whereas Galilea was highly affected by ralstonia plus nematode treatment.
Disease Severity percentage of Bacillus subtilis and Pseudomonas, Ralstonia solanacearum, Meloidogyne incognita
Average nematode, ralstonia and mixed bacteria resistance rating of tomato varieties were given in Table 7. Variety Galileahad highly affected with combined treatment the nematode, ralstonia and mixed bacteria (i.e. 100%). The highest percentage of plants with low damage by nematode, Ralstonia and mixed bacteria (16.66%) was observed in Venise variety and therefore, Venise was found to be the least affected tomato variety.
Yield performance of four tomato varieties
In the present study, significant differences were observed among the varieties of tomato, as revealed by the analysis of variance (Table 9). The varieties had significant effect on the total number of fruit per plant, the total weight of fruit per plant, the weight of a single fruit per plant, the number of marketable fruit per plant, the weight of marketable fruit per plant and average fruit weight per plant but a non-significant difference on number of unmarketable fruit per plant and weight of unmarketable fruit per plant. MANOVA revealed all tomato varieties differ significantly for most yield parameters (p ≤ 0.05), likewise there was a significant effect on inoculants but number of unmarketable fruit per plant and weight of unmarketable fruit per plant were not significantly different between varieties of tomato. Post-hoc comparisons using Scheffè tests showed significantly different between tomato varieties.
The low marketable yield obtained for some tomato varieties used might be due to non-development of flowers into fruits as about 50% only of the flowers developed into fruits. Varieties with high numbers of fruits harvested might have successfully developed more flowers into fruits possibly as a result of better genetic components. Jalloh, et al. [17] indicated that only 50% of flowers produced developed into fruits, therefore sink size (genetically controlled) influences fruit production in tomato and perhaps higher capacities to convey photosyntheticmaterials towards economicyield.
Total fruit weight per plant
Total fresh fruit weight per plant was significantly different (P ≤0.05) among the varieties inoculated by diseases (Table 8). Venise had mean maximum in fresh fruit weight (701.32 g) inoculated with mixed bacteria that promote the growth of the plant by fixing inorganic phosphorus and nitrogen while Galilea tomato variety had a minimum in fresh fruit weight (90.5 g) inoculated with ralstonia (see Figure 2 and Appendix Table 1). The highest weight of fresh fruit obtained from Venise over other varieties investigated may be attributed to the possibility of possession of higher stomatal conductance, better partitioning of photosynthetic materials towards economic yield, better genetic structure and higher potential to transport photosynthetic materials within plants. Similarly, Baliyan and Roa [7] showed six tomato varieties contributed differently to the total yield of tomato. Further, the four tomato varieties do exhibit an adverse effect in terms of the quality of tomato produced. This study is in agreement with Gebisa Benti, et al. [13] indicated that the varietals differences in yield might be attributed to the differences in inoculation of tomato varieties with diseases.
Number of marketable fruits per plant
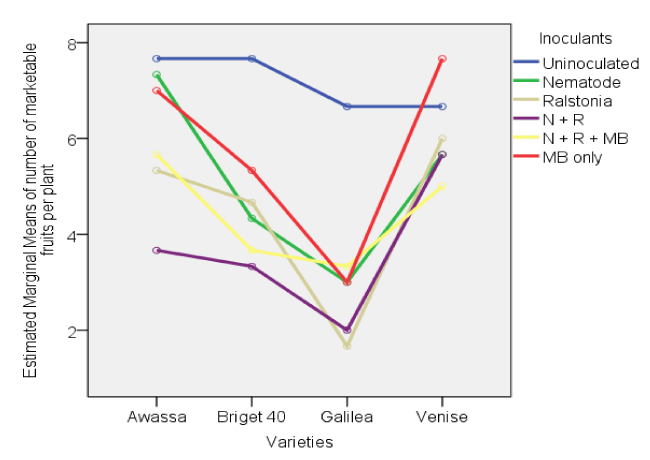
The highest mean number of marketable fruit was obtained from varieties Awassa with uninoculated and Venise inoculated with mixed bacteria (7.667) while the least from Galilea inoculated with nematode plus Ralstonia (see Figure 3. The recorded variations of varieties in marketable yield could be due to their differences in genetic make-up and/or disease resistance.
Unmarketable number of fruits per plant
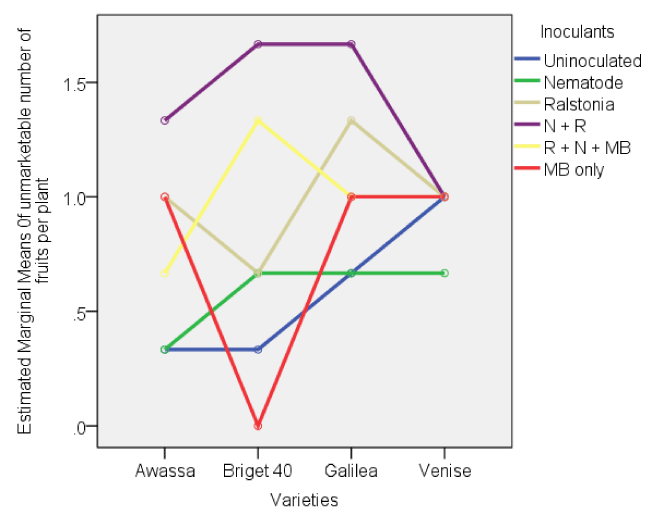
Interaction effect of variety by inoculants showed had no a significant difference (p ≤ 0.05) on unmarketable yield (see Table 8. The highest mean number of unmarketable fruit was obtained from Galilea (1.667) inoculated with Ralstonia and nematode together while the least was obtained from Briget 40 (0.0011g) inoculated with mixed bacteria only (see Figure 4 and Appendix Table 1). This unmarketable number was recorded based on shrunken shaped fruits, small sized, and discolored fruits that were estimated to be due to the differences in the inherent characters of the varieties, those lacked uniformity when drying, and or due to physiological disorders (bleaching)during the fruit set or due to the inoculants effect. Abdulazeez [18] indicated that fertilization influenced the nonmarketable yield in all the years at Samaru and fertilizer produced significantly highest nonmarketable fruit yield than the control treatments in all the years and combined data while at Kadawa.
The weight of unmarketable of fruits per plant
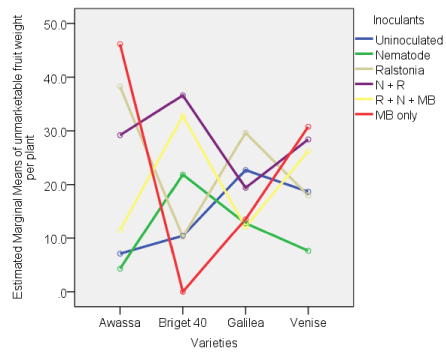
The highest unmarketable mean fruit weight per plant was obtained from Awassa inoculated by ralstonia(46.133g) while the least unmarketablefruit weight per plantwas gained from Briget40 inoculated with mixed bacteria only (0.003553g), see Figure 5 and Appendix Table 1). This unmarketable yield was recordedthrough subjective judgment based on shrunken shaped fruits, small sized, and discolored fruits that were estimated to be due to the differences in the inherent characters of the varieties, those lacked uniformity when drying, and or due to physiological disorders (bleaching)during the fruit set or due to the inoculants effect.The results of this study showed that the yield performance for the varieties wasbelow theaverage productivity of tomato as reported by Meseret, et al. [19], who found variations in theperformance of tomato varieties and heirloom varieties under tropical conditions.
Weight of marketable fruits per plant
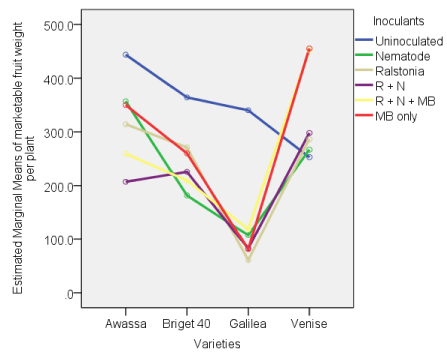
The highest marketable mean yield (455.2 g) was obtained for variety Venise inoculated with mixed bacteria while the least weight of marketable fruit (60.867g) was obtained from Galilea inoculated with nematode plus Ralstonia (Figure 6 and Appendix Table 1).The recorded variations of varieties in marketable yield could be due to their differences in genetic make-up and/or disease resistance ability. This study is in agreement with that of Zishan, et al. [20] who analyzed data for fruit weight (grams) showed that there were significant difference among all the lines at p ≤ 0.05.
Number of fruits per plant
The highest mean number of fruits per plant (8.667) was observed in Venise variety inoculated with mixed bacteria only while the lowest number of fruits per plant (3) was obtained from Galilea variety (Figure 7 and Appendix Table 1). This difference may be attributed to the higher number of flowers that developed into fruits. Unlike other varieties whose 50% of their flowers dried up and fell off or formed tiny fruits which shriveled up and fell off without further development, flowers of variety Venise successfully developed in to more fruits possibly because of the better genetic constitution. Produced Flowers developed into fruits, thus sink size (genetically controlled) influences fruit production in tomato and it may also be attributed to better genetic structure and higher potentials to transport photosynthetic materials towards economic yield. This result is supported by Joyce [21] who worked on combining micro-propagation and AMF inoculation increased the potato seed yield and quality of root colonization signifying that the extent of root colonization did correlate with the benefits of the host plant. Similar results were reported as studies Moustaine [22] who showed that application of Bacillus can stimulate yield and quality parameters in sugar beet, barley, apricot and apple. Inoculation based Bacillus bacterial strains have resulted in more effective results in terms of growth and yield compared to other applications (Mycobacterium) and compared to the control. These results are in agreement with the finding of Nguyen [23] who, indicated that fruit number per plant was also significantly influenced by plant diseases, the low plant diseasesresulting insignificantly more fruit number as compared to high plant density diseases [24-32].
Average fruit weight per plant
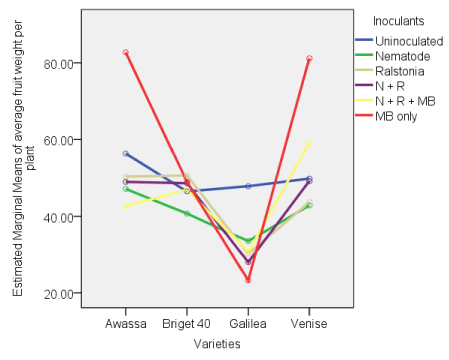
Awassa had maximum (82.731g) fruit mean weight without inoculation while Galilea variety had a minimum (27.981) in fruit weight (Figures 8,9). Fruit weight migt be attributed due to varietal genetic make and attributed poor tomato yieldtonon-developmentof flowers into fruits and foundthat only 50% of the flowers produced developed into fruits and limited the size and weight of fruits. The maximum fruit weight could be varietal differences in growth and yield which might be attributed to the differences in inoculants effect on tomato varieties. Besides the differences in varietal genetic makeup, the low marketable yield obtained for some tomato varieties used might be due to non-development of flowers into fruits as about 50% of the flowers develop into fruits. The result was supported by Zishan, et al. [21] who showed average number of fruits per plant showed significant difference among the lines at p ≤ 0.05.
Total marketable yield of varieties
Variety Venise gave the highest marketable yield (7224.13 g) followed by Awassa (5793.6 g). The percentage of marketable fruit (by weight) varied from 95.6% (Venise) to 802.8% (Awassa). The variety Galilea produced the lowest total yield (2656.4g) as well as the lowest marketable yield (2373g) among the four varieties under evaluation. Variety Venise performed well as it produced a total yield of 7556.33 g and produced the highest marketable percentage (95.6%) fruits. The highest marketable percentage fruits produced by Venise can be attributed to very high resistance to the nematode and Ralstonia disease and therefore, Venise was a good variety (see Table 9). This suggests that this variety was better able to resist the inoculated disease and yield constraints encountered during the growing period than any of the other four varieties evaluated in this study.
Conclusions
The results obtained from this study revealed that tomato varieties performed better at inoculation of mixed bacteria. The study, in general, indicates that diseases and varietal differences affect agro-morphological traits, yield, quality characteristics of tomato fruit and resistance to disease. The results of the experiment indicated that Venise was the best yielding and disease resistance tomato variety followed by Awassa. It was concluded that Venise tomato varieties was highly resistant to nematode, ralstonia or to the combined effect of ralstonia and nematode. Galilea was found to be the most severely attacked variety (55.55%) by nematode and ralstonia where as Venise was least attacked variety by nematode and ralstonia (22.22%). As indicated in the results there were significant differences among the varieties, treatments and the interactions between inoculants and tomato varieties for most parameters growth, disease resistance and severity yield except leaf length per plant. Venise and Awassa were increased fruit yield per plant over the other varieties of tomato. The results obtained showed that variety Venise was superior in yield parameters and disease resistance percentage. Therefore host resistant and bio control agents might be applied both for small scale and large scale production to boosting the production in the future. Therefore Based on the current findings of the study, it was recommended that, Varietal selection for sustainable production and productivity enhancement and A need to develop and evaluate new tomato varieties which are resistant to diseases. Besides, the use of resistant varieties, biocontrol methods shouldalso beadopted for disease control, growth and yield enhancement with respect to being eco-friendly, non-hazardous and non-toxic reducing the cost of tomato production.
- Wondimeneh T, Sakhuja K, Tadele T (2013) Root-knot nematode management using botanicals in tomato. Academia Journal of Agricultural Research 1: 009-016. Link: https://bit.ly/3bnmOGc
- Govind G, Shailendra S, Narendra K, Sunil K, Vinod S (2015) Plant Growth Promoting Rhizobacteria Current and Future Prospects for Development of Sustainable Agriculture. Journal of Microbial & Biochemical Technology 7: 96-102. Link: http://bit.ly/39fcqxF
- Patten CL, Glick BR (2002) Role of Pseudomonas putida Indole acetic acid in development of the host plant root system. Appl Environ Microbiol 68: 3745-3801. Link: http://bit.ly/39jAhfP
- Pavan K, Shruti A (2013) Characterization of Bacillus sp. strains isolated from therhizosphere of tomato plants for their use as potential plant growth promoting rhizobacteria. International Journal of current Micro Biology and Applied Sciences 2: 406-417.
- Ashrafur R, Farjana A, Akhter H, Lutfunnaher L (2011) Screening of different Eggplant cultivars against wilt disease caused by Fungi, Bacteria and Nematodes. Journal of Experimental Sciences 2: 6-10. Link: http://bit.ly/39eEQb8
- Hooper DJ, Hallman J, Subbotin S (2005) Methods for extraction, processing and detection of plant and soil nematodes. Plant parasitic nematodes in subtropical and tropical agriculture, 2nd ed. CABI Publishing, Wallingford 53–86. Link: https://bit.ly/3nwoLT8
- Baliyan S, Rao S (2013) Evaluation of Tomato Varieties for Pest and Disease Adaptation and Productivity in Botswana. International Journal of Agricultural and Food Research 2: 20-29. Link: https://bit.ly/3op5R1Q
- Komahan D, Prasannath K (2017) Screening of Tomato Varieties against Damping-off Disease under the Climatic Conditions of Batticaloa District, Sri Lanka, Scholars Journal of Agriculture and Veterinary Sciences 4: 264-266. Link: https://bit.ly/3s9yKS4
- Zachee A, Sully M, Philippe K, Charles C, Jules P (2016) Assessing the Resistance of Three Tomato Varieties to Bacterial Wilt and Stem Rot. American Journal of Experimental Agriculture 11: 1-13. Link: https://bit.ly/3op605o
- Masinde A, Kwambai T, Wambani H (2011) Evaluation of tomato variety tolerance to foliar diseases at Kenya Agricultural Research Institute Centre-Kitale in Northwest Kenya. African Journal of Plant Science 5: 676-681. Link: http://bit.ly/35p7YLI
- Shahram S (2012) Effects plant growth promoting on growth and nutrients uptake of tomato. International Journal of Advances in Engineering & Technology 2: 27-31. Link: https://bit.ly/35qo9Zf
- Falak N, Ihsan U, Ssyed A, Abdus S, Abdur R (2011) Studies on growth, yield and nutritional composition of different tomato cultivars in the battle valley ofdistrict Mansehra, KhyberPakhtunkhwa, Pakistan. Sarhad J Agric 27: 570-571. Link: https://bit.ly/3hVkAPy
- Gebisa B, Gezu D, Alemayehu B, Fikadu T (2017) Performance Evaluation of Tomato Varieties under Supplemental Irrigation at Erer Valley, Babile District, Ethiopia. Journal of Plant Sciences 5: 1-5. Link: http://bit.ly/3bnLA96
- Fayaz A, Obedullah K, Sair S, Akhtar H, Sher A (2012) Effect of bio-fertilizers on the enhancement of growth and yield on tomato. International Journal of Research in Botany 2: 20-23.
- Zainab H (2006) Field Evaluation of Twelve Tomato Cultivars for Resistance to Leaf Curl and Early Blight Disease in Khartoum State. M.Sc. Thesis, University of Khartoum. Link: https://bit.ly/2MCa4RJ
- María C, Gustavo G, Guillermo A, Alejandra B (2016) New sources of partial resistance to bacterial spot race T2 in processing tomatoes. Journal of Horticulture Brasileira 34: 326-332. Link: http://bit.ly/3bkxEg7
- Jaiteh F, Kwoseh K, Akromah R (2012) Evaluation of tomato genotypes for resistance to root-knotnematodes. Journal of African Crop Science 20: 41-49. Link: http://bit.ly/3qfYUkr
- Abdulazeez S (2014) The productivity of tomato varieties in response to NPK fertilizer and green manure rates. Doctor of Philosophy in Agronomy, Ahmadu Bello University, Zaria. Link:
- Meseret D, Ali M, Kassahun B (2012) Evaluation of tomato genotypes for yield and yield components. African Journal of Plant Science and Biotechnology 6: 45-49. Link: https://bit.ly/3s6pw99
- Zishan G, Mehboob A, Zaheer U, Bilal K, Mazhar I (2016) Evaluation of Tomato Lines against Septoria Leaf Spot under Field Conditions and Its Effect on Fruit Yield. Agricultural Sciences 7: 181-186. Link: http://bit.ly/2K2pu0S
- Joyce A (2013) Evaluate the effect of arbuscular mycorrhizal fungi and rhizobacteria inoculation on the performance of potato. M.Sc. Thesis University of Nairobi, Kenya. Link: http://bit.ly/3s8ei3X
- Moustaine M, Elkahkahi B, Benkirane R, Achban H (2017) Effect of plant growth promoting rhizobacterial inoculation on growth in tomato and characterization for direct PGP abilities in Morocco. International Journal of Environment, Agriculture and Biotechnology 2: 590-596. Link: https://bit.ly/35mhTS0
- Nguyen M, Nguyen T (2015) Effect of Plant density on growth and yield of tomato at Thai Nguyen, Vietnam. International Journal of Plant and Soil Science 7: 357-361. Link: https://bit.ly/3s7l366
- Abida R, Muhammad A, Abdul G (2013) Genetic divergence for Seedling traits in tomato. International Journal Agriculture Biology 15: 451-457. Link: https://bit.ly/2MEhwMa
- Ajenifujah O, Isu N, Ingelbrecht I, Abiade O (2012) Tissue culture regeneration of three Nigerian cultivars of tomatoes. African Journal of Plant Science 14: 370-375. Link: https://bit.ly/3bnHiik
- Attyaf J, Ali H, Muhssin C (2014) Genetic diversity of some tomato varieties in Iraq using Random Amplified Polymorphic DNA Markers. Journal of Pure and Applied Sciences 22: 2342-2351. Link: http://bit.ly/3otjfSH
- Baharullah K, Saifullah N, Muazam S (2008) Effect of some indigenous isolates of Trichoderma harzianumon root-knot nematode, Meloidogyne Javanica Chitwood. Sarhad Journal of Agriculture 24: 285-288.
- Bombiti N, Diana M, Puffy S (2012) Solanum Lycopersicum L. as influenced by Trichoderma harzianum and Glomus Mosseae inoculation, Journal of Scientia Horticulturae 144: 55–59. Link:
- Emana B, Ayana A, Balemi T, Temesgen M (2014) Scoping study on vegetables seedsystems and policy in Ethiopia. Final Report, Asian Vegetable Research, and Development Center, Shanhua, Taiwan. Link: https://bit.ly/39hgFJ0
- Famara J (2010) Screening tomato Genotypes for resistance to root-knot nematodes. Kwame Nkrumah University of science and technology Kumasi, Ghana. Link:
- Ijaz A, Saifullah M, Ahmad L, Aqleem A, Rifat A (2016) Organic management of root-knot nematodes with non-host weed Extracts. Journal of Entomology and Zoology Studies 4: 501-509. Link: https://bit.ly/3nqPYa0
- Jalloh S, Kanneh S, Bah A (2017) Evaluation of Tomato Genotypes for Adaptation and Yield Components on the Njala Upland Soil Southern Sierra Leone. International Journal of Agriculture Innovations and Research 9: 391-395. Link: https://bit.ly/3nqNFn5
Article Alerts
Subscribe to our articles alerts and stay tuned.
 This work is licensed under a Creative Commons Attribution 4.0 International License.



 Save to Mendeley
