Open Journal of Environmental Biology
Arsenic Pollution Measured with an online Monitoring System using Daphnia
Donat-P Häder1* and Gilmar S Erzinger2
2Department of Medicine and Pharmacy, University of Joinville Region – UNIVILLE, Rua Paulo Malschitzki, 10 Campus - Industrial Zone, PO Box 246, Joinville, SC CEP 89219-710, Brazil
Cite this as
Häder D-P, Erzinger GS (2017) Arsenic Pollution Measured with an online Monitoring System using Daphnia. Open J Environ Biol 2(1): 027-034. DOI: 10.17352/ojeb.000005Arsenic is a common pollutant in many water reservoirs around the world and is the cause of human mortality in many countries. The microcrustacean Daphnia can be cultured easily and is sensitive to many toxic substances including As. This bioindicator is the basis of the Daphniatox instrument which uses computerized image analysis of swimming organisms in real time. Fourteen endpoints are evaluated including motility, swimming velocity, orientation with respect to light or gravity as well as several cell size and form parameters. Using automatic track analysis of a large number of organisms warrants high statistical significance. In a vertical swimming flask Daphnia shows pronounced gravitaxis moving upward and downward while in a horizontal flask the organisms swim in random directions. Exposure for up to 72 h to 0 – 10 mg/L NaAsO2 (corresponding to 0 – 77.5 µM As) according to the standard NBR 12713 protocol showed an EC50 value of 5.97 mg/L for motility after an exposure time of 7 h and 4.82 mg/L after 26 h. Comparably, the EC50 value for velocity was 5.32 mg/L after an exposure time of 7 h and after 26 h it was 3.05 mg/L. As expected, the length of the organisms did not change over the exposure time because of their rigid exoskeleton, but the circularity which corresponds to the area divided by the perimeter squared decreased which is interpreted to be due to a release of water. The results indicate that this method provides a reliable, fast and inexpensive test for arsenic toxicity in drinking water from wells and reservoirs.
Introduction
Less than 1 % of the water on Earth is accessible for human consumption since most of the freshwater is bound in glaciers and snow [1]. In addition, the need for fresh water for human consumption, agriculture and industry has increased dramatically over the recent past and further increasing demand is predicted in the face of the growing human population [2,3]. In parallel to the dwindling resources the remaining fresh water is polluted by toxic substances from domestic, agricultural and industrial wastes [4,5], which accumulate in groundwater, freshwater reservoirs and natural aquatic ecosystems such as lakes and rivers [6].
The World Health Organization (WHO) estimates that about 780 million people, mostly in developing countries, fail to have access to clean fresh water [7] and 2.2 billion do not have safe sanitation [8]. In Pakistan and India high concentrations of heavy metals are found in the rivers [9]. Furthermore, inorganic toxicants and organic pollutants accumulate in sediments and thus pose long-term risks for human health and the biota [10].
Arsenic pollution of potable water has become a major problem around the world. Daigle [11] reports that no less than 140 million people are using arsenic-polluted water in Asia. In India the majority of the water for human consumption is retrieved from more than 18 million small wells which have been dug over the past 30 years to avoid surface waters which are often contaminated by bacteria and other pollutants. The World Health Organization (WHO) has set the upper limit for As in drinking water at 10 µg/L, but since the concentrations are much higher in these wells, India has increased the level to 50 µg/L [12]; even though many wells exceed this limit by far.
The problem is due to the rapid increase in the human population. The big streams originating in the Himalayas have eroded the pyrite rocks, leached out As which is contained at high concentrations and deposited this toxic mineral in sediments in India, Bangladesh, China, Pakistan and Nepal. After reaction with oxygen and heavy metals such as iron, As forms granules which are concentrated in the sediments. Pumping fresh water from the wells at moderate levels does not affect the sediments, but the rapidly increasing demand for fresh water results in changes of underwater streams from clean rocks to arsenic-containing sediments. Developed countries have the possibility to filter out As from the water, e.g. by the conventional aluminum-based water treatment, as in the Southwest US, while developing countries do not have this option because of the high costs involved in this cleaning process [13].
Arsenic can be taken up with the drinking water or by consuming vegetables which have accumulated the toxin from polluted irrigation water. It causes serious chronic diseases in animals and humans [14]. Skin scarring is one of the first indications [15]. When accumulating over time in the body it causes brain damage, heart disease and cancer [16,17].
Monitoring and quality assessment of freshwater reservoirs are of high priority because of the increasing demand by a growing population. However, chemical analyses are time consuming, expensive and usually limited to a few classes of chemicals while the number of potentially toxic chemicals counts in the thousands [18]. In addition, chemicals may operate synergistically with other substances or other environmental stress factors, which is not determined in routine chemical analyses [19]. Upper limits for toxins vary between countries and may be altered over time and may not reflect the effective threat for the biota or human consumers of freshwater [20].
As an alternative, the presence of pollutants can be determined by using bioassays which involve organisms as bioindicators. One of the earliest examples was the use of fish which were deployed in potentially polluted water; when they died or showed abnormal swimming behavior this was interpreted as an indication of the presence of lethal or sublethal concentrations of toxic substances in the water [21]. Later on, many other organisms have been utilized in bioassays including bacteria, microorganisms, lower and higher plants as well as invertebrates and vertebrates [22-25]. Different endpoints can be used as indicators for toxicity including mortality, motility and behavior, growth and reproduction as well as physiological parameters such as photosynthesis, protein biosynthsis and genetic alteration of aquatic organisms [26].
By definition bioassays do not provide information on the chemical nature of the pollutant; they rather signal the presence of a toxin which may pose a threat for human health or ecosystem integrity [27]. The toxicity of an individual substance can be characterized quantitatively by determining the EC50 value, which by definition is the toxin concentration which causes a 50 % inhibition of the studied response [28]; but in principle any other value could be used instead.
Many commercially available bioassays have been developed during the recent past such as the Microtox test which measures the intensity of the bioluminescence emitted by genetically modified bacteria of the genus Vibrio which decreases in the presence of toxins [29]. Lemnatox determines the growth and pigmentation of the aquatic angiosperm Lemna [30] and the recently developed Ulvatox determines the release of zoospores from the marginal cells of the marine chlorophyte Ulva pertusa which is delayed under the influence of e.g. municipal or industrial wastewater monitored during a 96-h period [31,32]. Another approach is based on the real time image analysis of motile photosynthetic microorganisms monitoring motility, orientation with respect to light or gravity as well as cell shape [33,34].
Disadvantages of some of the commercial bioassays are low sensitivity or long times required for the analysis. Several species of the microcrustacean Daphnia have been found to be very sensitive toward many toxic substances in the water [35]. Daphnia is a genus of small Cladoceran crustaceans, 0.5 – 5 mm in length, commonly known as water fleas. They dwell in freshwater bodies such as streams, ponds and lakes where they serve as food for secondary consumers such as amphibia and fish [36], but some species of Daphnia and related genera are adapted to brackish or marine waters [37]. The microcrustaceans respond to many organic and inorganic pollutants [38], such as carbamate, pyrethroids and organophosphorous pesticides [39]. Daphnia is accepted as a suitable organism to monitor freshwater, wastewater and sludge toxicity [40] and the biotest is certified by many national and international agencies including the German standard methods (DIN 38412 L-30) and the OECD test 202 [41]. A recently developed automatic bioassay using these organisms is based on the real-time analysis of swimming Daphnia and monitors 14 different endpoints including motility, orientation and form factors [42].
Materials and Methods
Organisms and culture
Cultivation of D. magna was carried out following the standard procedure described in ISO-6342 (ISO-6342, 2012) About 50 animals were kept in 5-L glass containers holding 2 L of culture medium (M4 medium) at pH 7 at 23°C under a light/dark cycle of 12:12 h [43]. The offspring was removed every three or four days and the medium exchanged. After 4 weeks new cultures were started with neonatal organisms. Feeding was performed automatically twice daily using a timer-controlled peristaltic pump. During each feeding 3.5 ml of an algal suspension with the unicellular green alga Raphidocelis subcapitata (previously Selenastrum capricornutum) at 3.6 x 10⁷ cells/mL was dispensed into each culture vessel as described in the ISO-8692 procedure (ISO-8692, 2012).
Bioassay for monitoring arsenic toxicity
The recently developed Daphniatox is based on the analysis of the tracks of swimming organisms under the influence of toxic substances in their environment. The Daphnia were placed in cell culture flasks which were positioned either horizontally or vertically in front of a light table which provided a uniform irradiation. Thus, dark organisms were seen in front of a bright background by a monochromatic USB 3.0 camera (Point Grey, Blackfly BFLY-U3-13S2M-CS) with 1.3 mega pixel resolution (1288 x 964) equipped with a macro zoom objective (Computar 2.8-12 mm, 1:1.3 IR 1/3”)
The tracking software is based on the Fiji software derived from the open source ImageJ [44]. This program can process only recorded video (.avi) sequences; but a software plugin has been developed, which allows direct input of the online video into the imaging software (Phase, Lübeck, Germany) The Daphniatox analysis software is written in the Macro Language of ImageJ. Additional features have been implemented to start the live video and to calibrate the system in real physical units for dimensions and velocities (pixels per mm) In addition, ranges for the size and velocity of objects can be defined to avoid tracking debris or sedimenting organisms. A maximal time frame and an upper limit for the number of tracked objects can be defined for each experiment.
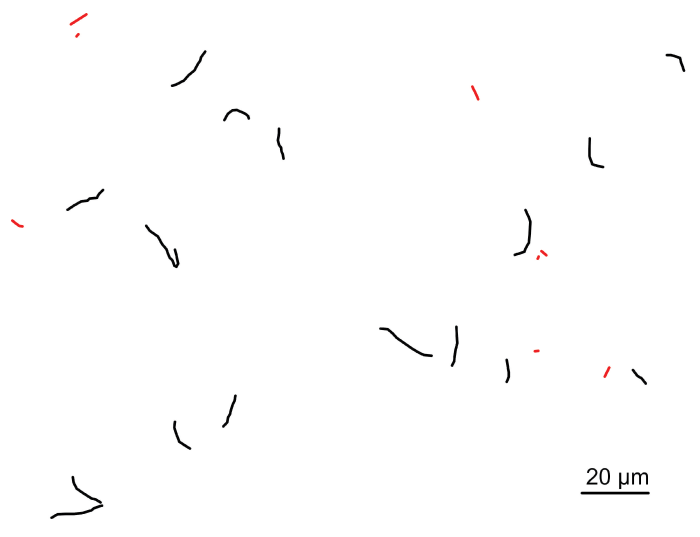
A stack of a previously defined number of frames is recorded from the live video stream and the images are preprocessed by background subtraction, contrast enhancement and binarization [45-47], which results in clear-cut images with bright organisms in front of a dark background or vice versa. Objects are identified in the first recorded frame and then followed through the stack. From these vectors velocity, swimming direction, percentage of motile objects, orientation with respect to light or gravity as well as their length, area and form parameters (such as circularity) are determined [48]. This procedure is repeated with the next stack of frames until the predetermined time or maximal number of tracks is reached. Figure 1 shows the tracks of Daphnia swimming in a horizontally oriented flask. During the tracking analysis the relevant data are shown on screen together with the life image to make sure that no artefacts are recorded. Finally all results are recorded together with an angular histogram of the movement directions, swimming paths and area details.
The swimming direction of each organism is determined as the angular deviation α from the 0° direction (direction of impinging light or gravity vector)
where x1, x2, y1 and y2 are the beginning and end coordinates of each track, respectively [49].
The precision of orientation of the whole population can be characterized by a statistical measure (r-value), which runs between 0 (when the organisms move in random directions) and 1 (when all cells move in the same direction) [50].
Since this value does not indicate the direction in which the organisms move, the mean movement angle of the population is calculated as θ [50].
The swimming speed is determined from the (meandering) total swimming path length divided by the time needed for this. In addition, the linear speed is calculated by dividing the distance from the beginning of each vector to its end divided by the time needed. The percentage of motile organisms is calculated for all objects which fall within the defined size range and velocity range.
The area of each object (within the size limits) is determined and the mean value calculated. The length of the outer boundary (perimeter), the circularity, roundness, solidity and aspect ratio (ratio of the major and minor axes of a particle’s fitted ellipse) are calculated [27]. In addition, the Feret’s diameter is determined which indicates the largest dimension of an object [44].
Experimental procedure and statistical analysis
About 50 neonate Daphnia were transferred into cell culture flasks (Aldrich) holding 80 ml of filtered pond water. Organisms were incubated with increasing concentrations of NaAsO2 (0 – 10 mg/L) 1 mg/L of this salt corresponds to 7.75 µM as. Each flask was analyzed three times by the tracking software. Preliminary experiments have been carried out using As (V) (Na3AsO4); however, in this bioassay the toxicity was lower than for As (III) Therefore the tests were performed using As (III) All experiments were repeated three times. For all parameters mean values and standard deviations (Anova, Student t) are determined. EC50 curves were calculated using Sigmaplot (ver. 12.5)
Results
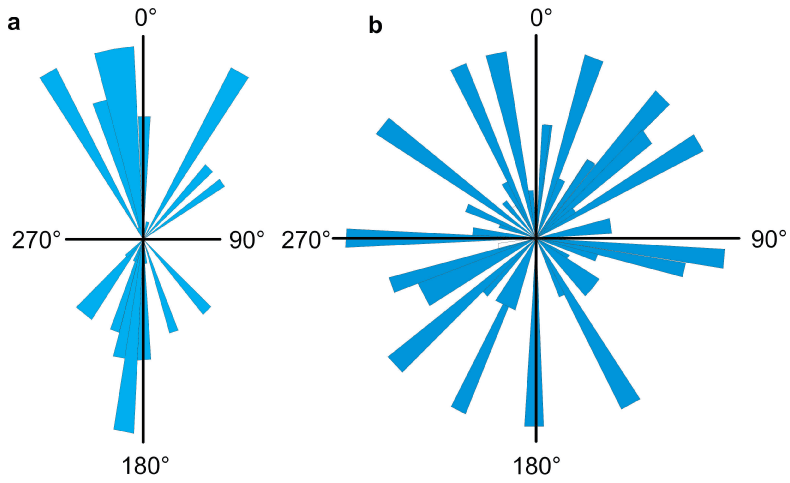
In a vertical flask Daphnia shows vertical migrations which are controlled by gravity [51]; periods of upward movement alternate with those of downward swimming (Figure 2a). The swimming directions of the tracks are binned in 60 sectors. The histogram is based on 84 tracks; 51 % of the organisms were motile. The mean swimming velocity was 0.025 ± 0.013 mm/s and the direct velocity (calculated from the distance between beginning and end of each track was 0.020 ± 0.009 mm/s, from which a mean directedness can be calculated as a ratio between the two velocities as 0.834 ± 0.167. 65.48 % of the organisms swam upward. Since the histogram shows a bidirectional distribution, θ and r-value are not defined. The mean area of the Daphnia neonates was 0.224 ± 0.138 mm2, the mean perimeter 2.766 ± 1.112 mm and the mean organism length was 0.816 ± 0.306 mm. The form of the organisms is described by the mean aspect ratio (1.910 ± 0.540), the mean roundness (0.536 ± 0.151), the mean circularity (0.36 ± 0.127) and the mean solidity (0.737 ± 0.133)
In a vertically oriented flask non-motile organisms sediment to the bottom and drop out of the field of view. In order to determine the percentage of motile Daphnia, the flask was placed horizontally on a light field with the camera pointing downward. In the absence of gravitactic orientation the Daphnia show random movements which results in an r-value of 0.02 (Figure 2b) Non-motile or dead organisms sediment to the bottom of the flask but are seen by the camera, and therefore the percentage of motile cells can be calculated correctly.
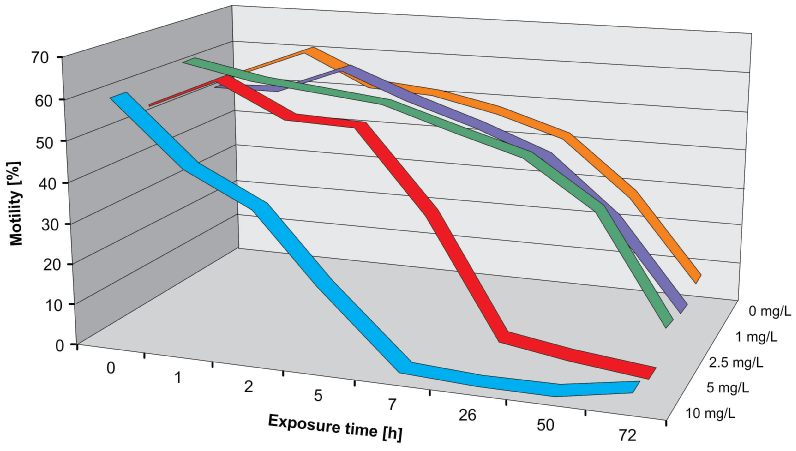
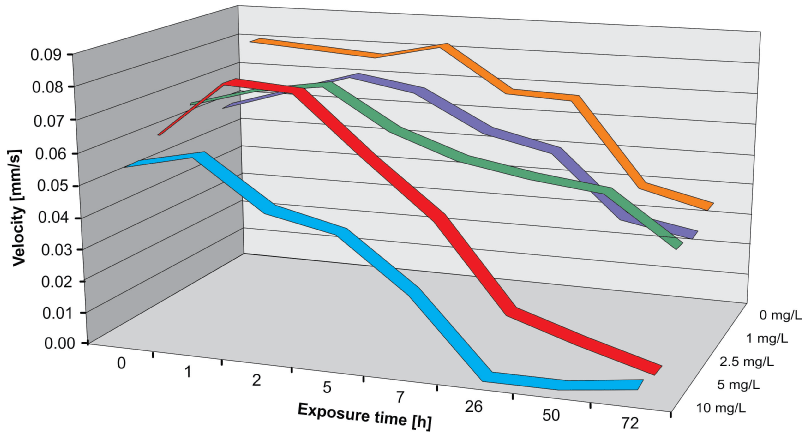
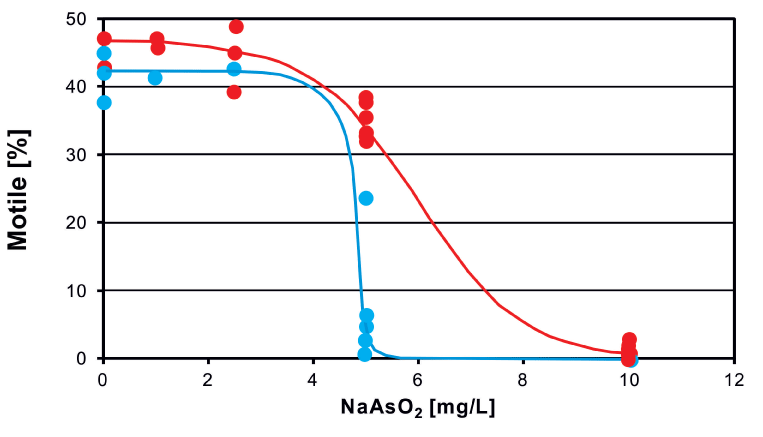
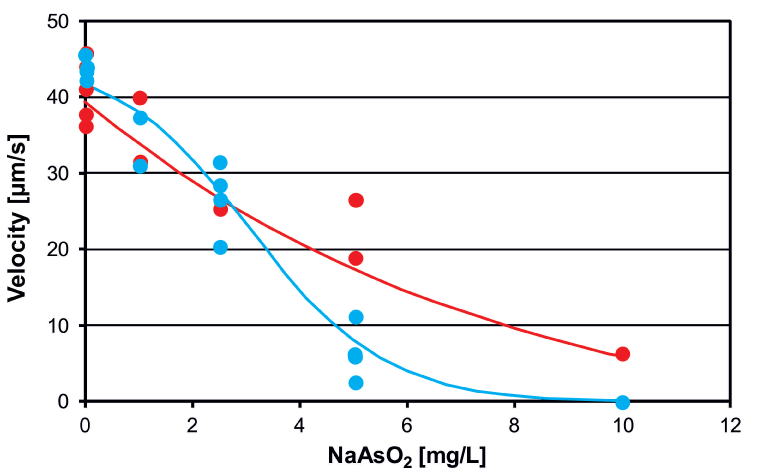
Short-term (acute) tests were performed according to the standard NBR 12713 protocol (ABNT, 2003; EPA, 2002). Neonates of D. magna, 24 h old, were placed in NaAsO2 solutions (0 – 10 mg/L (which corresponds to 0 – 77.5 µM as) for a period of up to 72 h [52]. Control measurements and analyses with different arsenic concentrations were performed in sequence recording a result file for each measurement. Immediately after incubation most organisms were motile at all concentrations of arsenic (Figure 3) However, when tracked after 24 h many organisms incubated at 5 and 10 mg/L were found immotile. Likewise the swimming velocity decreased with increasing incubation times (Figure 4). The effect-concentration curve for motility measured after an exposure time of 7 h showed an EC50 value of 5.97 mg/L; the concentration at which no effect was observed (NOEC) was found at 1 mg/L and the lethal dose (LD) was 10 mg/L (Figure 5). When measured after 26 h the EC50 value was 4.82 mg/L and the lethal dose (LD) was recorded at 5.3 mg/L. Similar values were found for the direct velocity (Figure 6): After an exposure time of 7 h the EC50 value was recorded at 5.32 mg/L; after 26 h it was 3.05 mg/L. The linear velocity indicates the distance between the beginning and end of a track divided by the time required for this. In contrast, the actual swimming velocity is based on the actually covered path length. From these two values a ratio can be calculated as direct velocity divided by the actual velocity. This ratio was about 0.86 for all As concentrations and did not change over the exposure time (data not shown) indicating that the swimming pattern was not affected by the presence of arsenic.
The mean length of the neonate Daphnia was 0.63 mm and did not change significantly with the As concentration and exposure time (data not shown) In contrast, the form varied which can be described by the circularity, roundness or solidity.
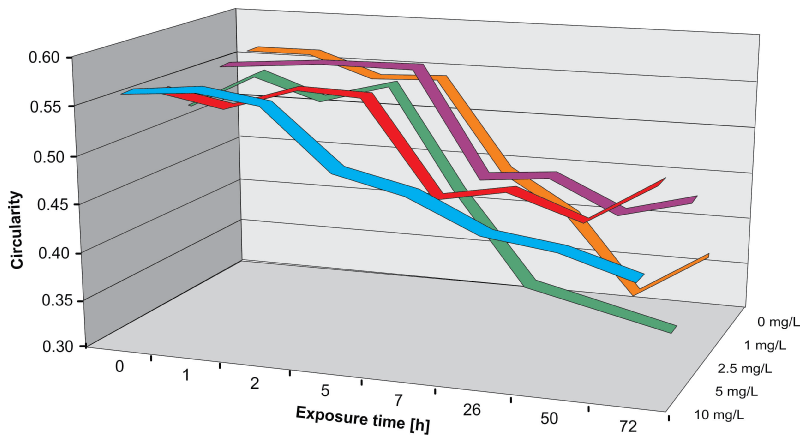
The circularity decreased over time and with higher As concentrations, indicating that the perimeter of the organisms became longer, since the area was nearly constant (Figure 7). Corresponding values were found for roundness and solidity.
Discussion
Arsenic poisoning is a global cause of human mortality. It affects many organs such as the heart, respiratory organs, stomach and intestine, liver, nerves and kidneys [53]. In addition, it is genotoxic since it inhibits DNA repair and DNA methylation [54]. It has also been found to be carcinogenic for the skin and inner organs due to the formation of reactive oxygen species [55]. Biochemically it blocks the citric acid cycle by uncoupling the mitochondrial respiratory chain as well as the β-oxidation pathway, resulting in a lack of ATP synthesis. It causes amino acids degradation and perturbations in creatine levels [56]. These are probably the main mechanisms for the decreasing motility and velocity in Daphnia. During the exposure time the percentage of motile organisms decreased as expected when exposed to increasing concentrations of arsenic because of the reduced ATP synthesis. It is interesting to note that at all concentrations motility is affected more than velocity after extended exposure times which means that a large number of organisms stop swimming while in the remaining swimming organisms the velocity is less significantly affected (cf. Figures 3 and 4) The toxin concentrations in these short-term exposures are well above the thresholds defined for drinking water. It is assumed that long-term incubations of Daphnia with as will result in much lower EC50 values. This hypothesis is confirmed by the EC50 curves (Figures 5 and 6) showing less inhibition after 7 h exposure than after 26 h for both motility and velocity. Long-term monitoring of As toxicity is in progress to quantify this notion. Over time motility also decreased in the controls and organisms exposed to low As concentrations since they were not provided with food. The same reasons hold for the decreasing velocity. Since the Daphnia were not fed during the experimental procedure no growth in length was visible. Since the organisms have a rigid exoskeleton changes in their form were not expected. However, increasing exposure times at increasing As concentrations indicated changes in solidity, circularity and roundness. These can only be due to the uptake or release of water from the organisms changing the outer silhouette. These suble changes in the form parameters of the organisms can only be detected by computer-aided image analysis and not by a human observer indicating another advantage of the new bioassay instrument increasing the number of observable endpoints. This is also only possible due to the large number of trackings increasing statistical significance. The organisms show gravitactic orientation [57]. While they swim in random directions in a horizontal flask, in a vertical flask half of the population swims upwards and the other half downward while considerably less Daphnia swim sideways. This result is also only possible due to the high number of tracks being analyzed. Human observers often have a personal bias which may be in contrast to the real behavior.
Modern bioassays need to provide a number of features such as short analysis time, high sensitivity, accuracy and reliability. It is preferable to use bacteria, algae, plants or invertebrates as bioindicators in order to avoid ethical considerations. Daphniatox allows to analyze a sample in about 2 min, tracking up to 100 organisms in real time using computerized image analysis [42]. Analysis by a human is both subjective and error prone which is avoided by the automatic tracking software. High statistical significance and precision of analysis are warranted by the high number of evaluated tracks which is achieved by parallel analysis of multiple organisms. The system is user friendly and does not need intensive personal training. Investment costs are small and running costs of the instrument are minimal. Keeping a culture of Daphnia and their food is simple and does not require extensive lab facilities [58]. The instrument measures 14 different parameters which can be used as endpoints. The Ecotox system which analyzes the motility, orientation and form parameters of the unicellular green flagellate Euglena gracilis evaluates a similar number of endpoints [59].
Daphnia is known as a very sensitive bioindicator organism and has been found to be more sensitive than other bioindicator organisms employed in different bioassays including algae (growth), fish (mortality) and bacteria (bioluminescence) [60]. Daphnia is an accepted bioindicator; the biomonitoring protocol is standardized and established in many countries [61]. EC50 values for motility and velocity have been found to be less than 2 mg/L when exposed for 2 h to potassium dichromate and even less after an exposure time of 24 h. After oral application of potassium dichromate to rats the EC50 value is 25 mg/kg and 14 mg/kg for rabbits after transdermal application [62,63]. The organism is also very sensitive to arsenic as shown in this report. In humans the lethal dose is 1.4 mg/kg body weight; death occurs within a few hours or days by renal or heart failure. In contrast, metallic As has a low toxicity because of its poor solubility; the LD50 is 763 mg/kg in rats after oral application [64].
By definition bioassays are not capable of identifying the chemical nature of a toxic substance but indicate a biohazard when a critical level of toxicity is exceeded. Therefore, when a potential threat for ecosystem safety or human health is indicated by the bioassay, chemical analysis needs to identify the pollutant in order to remedy the water reservoir. One strong feature of bioassays is that they monitor the potential toxicity of combined pollutants which may operate additively or synergistically. In addition, the toxicity of polluting substances may be increased by solar radiation or other environmental factors [65]. In addition to short-term analysis of single toxins such as As in wells and drinking reservoirs, a wide variety of pollutants such as heavy metals, herbicides, pesticides, fertilizers, detergents, wastewaters and many other organic and inorganic pollutants [59,66], can be monitored. The bioassay can also be employed for long-term (chronic) toxicity and can be used as an early warning system for potential pollution in groundwater, municipal and industrial wastewater and determining the efficacy of water treatment plants [59,67].
Conclusion
The bioassay Daphniatox is based on a standardized biomonitoring protocol established in many countries [61]. The microcrustacean Daphnia is a sensitive bioindicator for many pollutants such as heavy metals, municipal and industrial effluents, pesticides and fertilizers as well as cyanobacterial toxins [68-73]. In the new bioassay up to 14 different endpoints are tested including motility, swimming velocity, orientation with respect to light or gravity as well as several size and form parameters. Computer-controlled image analysis increases statistical significance by analyzing large numbers of tracks. The precision of video analysis allows to detect fine details and subtle differences in the size and form parameters which increases the number of observable endpoints.
In a vertical swimming flask the organisms show gravitaxis swimming preferentially upward and downward. Using this fully automatic, computerized instrument the toxicity of arsenic was tested for up to 72 h. Work is in progress to conduct these tests in long-term exposure for weeks and during several reproductive cycles which is expected to show toxicity at much lower As concentrations.
Increasing As concentrations and exposure times reduced both motility (percentage of motile organisms) and swimming velocity. The EC50 value for motility was found to be 5.97 mg/L (which corresponds to 46.3 µM As) The EC50 value for swimming velocity was 4.82 mg/L corresponding to 37.4 µM as, respectively. In addition, the form of the organisms changed and became more rounded which is interpreted as a result of water uptake since the length of the organisms did not change due to their rigid exoskeleton.
The instrument is a low-cost option to determine toxicity of various water pollutants. This feature makes it applicable for monitoring water toxicity in developing nations which do not have the means of using expensive analytical instrumentation. It has the advantage of automatic and on-line monitoring and can be used as an early warning system for the occurrence of biologically hazardous toxins.
The technical help of Aline Scheller is gratefully acknowledged. This work was partially supported by the National Council of Technological and Scientific Development (CNPq).
- Gleick PH (2014) The World's Water Volume 8: The Biennial Report on Freshwater Resources: Island Press. Link: https://goo.gl/doXqPx
- Hoekstra AY, Mekonnen MM, Chapagain AK, Mathews RE, Richter BD (2012) Global monthly water scarcity: blue water footprints versus blue water availability. PLoS One 7: e32688. Link: https://goo.gl/9MZOag
- Kasei RA, Barnabas A, Ampadu B (2014) The nexus of changing climate and impacts on rainfed water supply and fresh water availability for the inhabitants of Densu Basin and parts of Accra-Ghana, West Africa. Journal of Environment and Earth Science 4: 84-96. Link: https://goo.gl/0BTuzo
- Azizullah A (2011) Ecotoxicological assessment of anthropogenically produced common pollutants of aquatic environments. (PhD thesis), Friedrich-Alexander University, Erlangen, Germany. Link: https://goo.gl/LJKrVV
- Jones JAA (2014) Global hydrology: processes, resources and environmental management: Routledge. Link: https://goo.gl/snGEb5
- Stauffer J (2013) The water crisis: Constructing solutions to freshwater pollution: Routledge. Link: https://goo.gl/UjDfpf
- WHO/UNICEF (2012) Progress on Sanitation and Drinking-Water. Joint Monitoring Programme (JMP) for Water Supply and Sanitation, 2012 Update. Link: https://goo.gl/KoLIaj
- WHO (2014) Progress on Drinking Water and Sanitation – 2014 update. Link: https://goo.gl/qLHJ19
- Muhammad S, Shah MT, Khan S (2011) Health risk assessment of heavy metals and their source apportionment in drinking water of Kohistan region, northern Pakistan. Microchemical Journal 98: 334-343. Link: https://goo.gl/Bgdmcl
- Kukučka P, Audy O, Kohoutek J, Holt E, Kalábová T, et al. (2015) Source identification, spatio-temporal distribution and ecological risk of persistent organic pollutants in sediments from the upper Danube catchment. Chemosphere 138: 777-783. Link: https://goo.gl/Iuwb6U
- Daigle K (2016) Death in the Water. Sci Am, 314: 42-51. Link: https://goo.gl/SXc3Bw
- Berg M, Winkel L, Amini M, Rodriguez-Lado L, Hug S, et al. (2016) Regional to sub-continental prediction modeling of groundwater arsenic contamination. Paper presented at the Arsenic Research and Global Sustainability: Proceedings of the Sixth International Congress on Arsenic in the Environment (As2016), June 19-23, 2016, Stockholm, Sweden. Link: https://goo.gl/fHvK7p
- Gregor J (2001) Arsenic removal during conventional aluminium-based drinking-water treatment. Water Research, 35: 1659-1664. Link: https://goo.gl/h6W5Dc
- Bamberger M, Oswald RE (2012) Impacts of gas drilling on human and animal health. New solutions: a journal of environmental and occupational health policy 22: 51-77. Link: https://goo.gl/yiolhO
- Guadanhim LR, Gonçalves RG, Bagatin E (2016) Observational retrospective study evaluating the effects of oral isotretinoin in keloids and hypertrophic scars. International Journal of Dermatology 55: 1255-1258. Link: https://goo.gl/sZLPn9
- Ibeto LK, Love PB (2016) Squamous Cell Carcinoma Clinical Cases in Skin of Color (pp. 89-97) Springer. Link: https://goo.gl/2d1S1C
- Naujokas MF, Anderson B, Ahsan H, Aposhian HV, Graziano JH, et al. (2013) The broad scope of health effects from chronic arsenic exposure: update on a worldwide public health problem. Environmental Health Perspectives 121: 295-302. Link: https://goo.gl/LIgvnu
- Ginebreda A, Kuzmanovic M, Guasch H, de Alda ML, López-Doval JC, et al. (2014) Assessment of multi-chemical pollution in aquatic ecosystems using toxic units: Compound prioritization, mixture characterization and relationships with biological descriptors. Sci Total Environ 468: 715-723. Link: https://goo.gl/TNM2MN
- Chen C, Wang Y, Qian Y, Zhao X, Wang Q (2015) The synergistic toxicity of the multiple chemical mixtures: Implications for risk assessment in the terrestrial environment. Environ Int 77: 95-105. Link: https://goo.gl/NZJ9uq
- Häder DP (2013) A grand challenge for environmental toxicity: What are the permissive limits of toxic pollutants in the environment? Frontiers in Environmental Sciences: Environmental Toxicology 1: 1-2. Link: https://goo.gl/bR1KTQ
- Little EE, Finger SE (1990) Swimming behavior as an indicator of sublethal toxicity in fish. Environmental Toxicology and Chemistry 9: 13-19. Link: https://goo.gl/MF9BHl
- de Castro-Català N, Kuzmanovic M, Roig N, Sierra J, Ginebreda A, et al. (2015) Ecotoxicity of sediments in rivers: Invertebrate community, toxicity bioassays and the toxic unit approach as complementary assessment tools. Science of the Total Environment 540: 2097-2396. Link: https://goo.gl/0uirXq
- Hafner C, Gartiser S, Garcia-Käufer M, Schiwy S, Hercher C, et al. (2015) Investigations on sediment toxicity of German rivers applying a standardized bioassay battery. Environ Sci Pollut Res Int 22: 16358-16370. Link: https://goo.gl/LlKJ30
- Kottuparambil S, Kim YJ, Choi H, Kim MS, Park A, et al. (2014) A rapid phenol toxicity test based on photosynthesis and movement of the freshwater flagellate, Euglena agilis Carter. Aquat Toxicol 155: 9-14. Link: https://goo.gl/JHoha6
- Ma XY, Wang XC, Ngo HH, Guo W, Wu MN, et al. (2014) Bioassay based luminescent bacteria: interferences, improvements, and applications. Sci Total Environ 468: 1-11. Link: https://goo.gl/Fe9i72
- Davies JC, Mazurek J (2014) Pollution Control in United States: Evaluating the System: Routledge. Link: https://goo.gl/qUR8mj
- Häder DP, Erzinger GS (2015) Advanced methods in image analysis as potent tools in online biomonitoring of water resources. Recent Patents and Topics on Imaging 5: 112-118. Link: https://goo.gl/8XGQ5c
- Sebaugh J (2011) Guidelines for accurate EC50/IC50 estimation. Pharm Stat 10: 128-134. Link: https://goo.gl/PxVOsU
- Fernández-Piñas F, Rodea-Palomares I, Leganés F, González-Pleiter M, Muñoz-Martín MA (2014) Evaluation of the Ecotoxicity of Pollutants with Bioluminescent Microorganisms Bioluminescence: Fundamentals and Applications in Biotechnology 2: 65-135. Link: https://goo.gl/bgRpzD
- Newman JR, van Valkenburg JL (2013) Macrophytes for aquatic toxicology testing: some alternatives for consideration (what's wrong with Lemna) Paper presented at the SETAC Europe 23rd Annual Meeting, Glasgow 12-16. Link: https://goo.gl/iB9iKV
- Han T, Choi GW (2005) A novel marine algal toxicity bioassay based on sporulation inhibition in the green macroalga Ulva pertusa (Chlorophyta) Aquat Toxicol 75: 202-212. Link: https://goo.gl/mqXdCb
- Kim YJ, Han YS, Kim E, Jung J, Kim SH, et al. (2014) Application of the Ulva pertusa bioassay for a toxicity identification evaluation and reduction of effluent from a wastewater treatment plant. Frontiers in Environmental Science.
- Azizullah A, Murad W, Adnan M, Ullah W, Häder DP (2013) Gravitactic orientation of Euglena gracilis - a sensitive endpoint for ecotoxicological assessment of water pollutants. Front Environ Sci. Link: https://goo.gl/3gE97w
- Azizullah A, Richter P, Häder DP (2011) Ecotoxicological evaluation of wastewater samples from Gadoon Amazai Industrial Estate (GAIE), Swabi, Pakistan. International Journal of Environmental Sciences 1: 959-976. Link: https://goo.gl/59FXPy
- Struewing KA, Lazorchak JM, Weaver PC, Johnson BR, Funk DH, et al. (2015) Part 2: Sensitivity comparisons of the mayfly Centroptilum triangulifer to Ceriodaphnia dubia and Daphnia magna using standard reference toxicants; NaCl, KCl and CuSO4. Chemosphere 139: 597-603. Link: https://goo.gl/4UFdcC
- Leibold M, Tessier AJ (1991) Contrasting patterns of body size for Daphnia species that segregate by habitat. Oecologia 86: 342-348. Link: https://goo.gl/La1tcy
- Sakshaug E, Andresen K, Myklestad S, Olsen Y (1983) Nutrient status of phytoplankton communities in Norwegian waters (marine, brackish, and fresh) as revealed by their chemical composition. Journal of Plankton Research 5: 175-196. Link: https://goo.gl/ZFjrwa
- Knops M, Altenburger R, Segner H (2001) Alterations of physiological energetics, growth and reproduction of Daphnia magna under toxicant stress. Aquat Toxicol 53: 79-90. Link: https://goo.gl/tCvSiW
- Ren Z, Zhang X, Wang X, Qi P, Zhang B, et al. (2015) AChE inhibition: one dominant factor for swimming behavior changes of Daphnia magna under DDVP exposure. Chemosphere 120: 252-257. Link: https://goo.gl/fUMH8K
- Chen L, Fu X, Zhang G, Zeng Y, Ren Z (2012) Influences of temperature, pH and turbidity on the behavioral responses of Daphnia magna and Japanese Medaka (Oryzias latipes) in the biomonitor. Procedia Environmental Sciences 13: 80-86. Link: https://goo.gl/VYB9xF
- GSM (1989) Examination of water, waste water and sludge, bio-assays (group L), Determining tolerance of Daphnia to toxicity of waste water by way of a dilution series German Standard Methods.
- Häder DP, Erzinger GS (2017) Daphniatox–Online monitoring of aquatic pollution and toxic substances. Chemosphere 167: 228-235. Link: https://goo.gl/XFCXkY
- Erzinger G., Souza SC, Pinto LH, Hoppe R, Del Ciampo LF, et al. (2015) Assessment of the impact of chlorophyll derivatives to control parasites in aquatic ecosystems. Ecotoxicology 24: 949-958. Link: https://goo.gl/OP1F9o
- Schindelin J, Arganda-Carreras I, Frise E, Kaynig V, Longair M, et al. (2012) Fiji: an open-source platform for biological-image analysis. Nature Methods 9: 676-682. Link: https://goo.gl/4VzVDW
- Pratikakis I, Gatos B, Ntirogiannis K (2013) ICDAR 2013 document image binarization contest (DIBCO 2013) Paper presented at the Document Analysis and Recognition (ICDAR), 2013 12th International Conference. Link: https://goo.gl/KcJfeH
- Sobral A, Vacavant A (2014) A comprehensive review of background subtraction algorithms evaluated with synthetic and real videos. Computer Vision and Image Understanding 122: 4-21. Link: https://goo.gl/YJphUI
- Soille P (2013) Morphological Image Analysis: Principles and Applications: Springer Science & Business Media. Link: https://goo.gl/3UukkN
- Häder DP, Erzinger GS (2015) Ecotox – Monitoring of pollution and toxic substances in aquatic ecosystems. Journal of Ecology and Environmental Sciences 3: 22 – 27. Link: https://goo.gl/OQu1jg
- Häder DP, Lebert M (2000) Real-time tracking of microorganisms. In D.-P. Häder (Ed.), Image Analysis: Methods and Applications (pp. 393-422) Boca Raton: CRC Press. (Reprinted from: IN FILE) Link: https://goo.gl/HySUC9
- Batschelet E (1981) Circular Statistics in Biology. London, New York: Academic Press. Link: https://goo.gl/1ddhk7
- Ringelberg J (1999) The photobehaviour of Daphnia spp. as a model to explain diel vertical migration in zooplankton. Biological Reviews 74: 397-423. Link: https://goo.gl/8OmLa6
- Flohr F, Brentano DM, Carvalho-Pinto CRS, Machado VM, Matias WG (2005) Classificação de resíduos sólidos industriais com base em testes ecotoxicológicos utilizando Daphnia magna: uma alternativa. Biotemas 18: 7–18. Link: https://goo.gl/KxJdt3
- Gunduz O, Bakar C, Simsek C, Baba A, Elci A, et al. (2015) Statistical analysis of causes of death (2005–2010) in villages of Simav plain, Turkey, with high arsenic levels in drinking water supplies. Archives of environmental & occupational health 70: 35-46. Link: https://goo.gl/vg5WZa
- Bach J, Peremartí J, Annangi B, Marcos R, Hernández A (2015) Reduced cellular DNA repair capacity after environmentally relevant arsenic exposure. Influence of Ogg1 deficiency. Mutation Research/Fundamental and Molecular Mechanisms of Mutagenesis 779: 144-151. Link: https://goo.gl/ZIVI4h
- Ferreccio C, Steinmaus C (2016) Levels of arsenic in drinking water and short and long-term health effects in northern Chile, 1958–2010. Paper presented at the Arsenic Research and Global Sustainability: Proceedings of the Sixth International Congress on Arsenic in the Environment (As2016) June 19-23, 2016, Stockholm, Sweden. Link: https://goo.gl/o43Z38
- García-Sevillano MA, García-Barrera T, Navarro F, Montero-Lobato Z, Gómez-Ariza JL (2015) Shotgun metabolomic approach based on mass spectrometry for hepatic mitochondria of mice under arsenic exposure. BioMetals 28: 341-351. Link: https://goo.gl/NpwxSK
- Gonçalves RJ, Barbieri ES, Villafañe VE, Helbling EW (2007) Motility of Daphnia spinulata as affected by solar radiation throughout an annual cycle in mid-latitudes of Patagonia. Photochemistry and Photobiology 83: 824-832. Link: https://goo.gl/P6zk5y
- Vijverberg J (1989) Culture techniques for studies on the growth, development and reproduction of copepods and cladocerans under laboratory and in situ conditions: a review. Freshwater Biology 21: 317-373. Link: https://goo.gl/uDbUxL
- Azizullah A, Richter P, Häder DP (2014) Effects of long-term exposure to industrial wastewater on photosynthetic performance of Euglena gracilis measured through chlorophyll fluorescence. Journal of Applied Phycology 27: 303-310. Link: https://goo.gl/RlJySl
- Ahmed H, Häder DP (2011) Monitoring of waste water samples using the ECOTOX biosystem and the flagellate alga Euglena gracilis. Journal of Water, Air and Soil Pollution 216: 547-560. Link: https://goo.gl/BFrSt3
- Asghari S, Johari SA, Lee JH, Kim YS, Jeon YB (2012) Toxicity of various silver nanoparticles compared to silver ions in Daphnia magna. Journal of Nanobiotechnology 10: 1-14. Link: https://goo.gl/0VrCaZ
- Gumbleton M, Nicholls P (1988) Dose-response and time-response biochemical and histological study of potassium dichromate-induced nephrotoxicity in the rat. Food and Chemical Toxicology 26: 37-44. Link: https://goo.gl/ZG6QEJ
- Tandon SK (1982) Organ toxicity of chromium in animals. Biological and environmental aspects of chromium 5: 209. Link: https://goo.gl/EmGPiz
- Aylward GH, Findlay TJ (2014) Datensammlung Chemie in SI-Einheiten: John Wiley & Sons. Link: https://goo.gl/6S5pJt
- Zepp R, Erickson Iii D, Paul N, Sulzberger B (2011) Effects of solar UV radiation and climate change on biogeochemical cycling: interactions and feedbacks. Photochem Photobiol Sci 10: 261-279. Link: https://goo.gl/x4KS5M
- Danilov R, Ekelund N (2000) Applicability of Growth Rate, Cell Shape, and Motility of Euglena gracilis as Physiological Parameters for Bioassessment at Lower Concentrations of Toxic Substances: An Experimental Approach. Environ Toxicol 16:78-83 Link: https://goo.gl/BbOhJA
- Ahmed H (2010) Biomonitoring of aquatic ecosystems. (PhD thesis), Friedrich-Alexander-Universität, Erlangen-Nürnberg. Link: https://goo.gl/Nea8ey
- DeMott WR, Zhang QX, Carmichael WW (1991) Effects of toxic cyanobacteria and purified toxins on the survival and feeding of a copepod and three species of Daphnia. Limnology and Oceanography 36: 1346-1357. Link: https://goo.gl/JDRwqQ
- Kim DB, Choi WS, Hong YK, Kim SO, Lee SW, et al. (2016) Evaluating ecotoxicity of surface water and soil adjacent to abandoned metal mines with Daphnia magna and Eisenia fetida. Korean Journal of Soil Science and Fertilizer 49: 81-86. Link: https://goo.gl/oXWx2G
- (2003) Ecotoxicologia Aquática - Toxicidade crônica - Método de ensaio com Ceriodaphnia spp. (Crustacea, Cladocera).
- (2002) Short-term methods for estimating the chronic toxicity of effluents and receiving waters freshwater organisms. Link: https://goo.gl/cYcoHq
- (2012) Water quality – Determination of the inhibition of the mobility of Daphnia magna Straus (Cladocera, Crustacea) Acute Toxicity Test. Link: https://goo.gl/MCpLfW
- (2012) Water Quality – Fresh Water Algal Growth Inhibition Test with Unicellular Green Algae. Link: https://goo.gl/yIO3eK

Article Alerts
Subscribe to our articles alerts and stay tuned.
 This work is licensed under a Creative Commons Attribution 4.0 International License.
 Save to Mendeley
