Open Journal of Biological Sciences
Studying of genetic differentiation among clupisoma sinensis, ompok bimaculatus, puntius sophore & labeo rohita species into vishnupuri & jaikwadi dams in godavari river of the system utilizing mtDNA Gene
Rabeeha Mankhi Jebur*
Cite this as
Jebur RM (2020) Studying of genetic differentiation among clupisoma sinensis, ompok bimaculatus, puntius sophore & labeo rohita species into vishnupuri & jaikwadi dams in godavari river of the system utilizing mtDNA Gene. Open J Biol Sci 5(1): 047-052. DOI: 10.17352/ojbs.000025Throughout this research, twenty specimens (Puntius sophore , Clupisoma sinensis, Labeo rohita, and Ompok bimaculatus) in both different locations ( Vishnupuri & Jaikwadi Dams) in Rivers of Godavari were collected in the network. DNA isolation & specific cytochrome b gene amplification primes were planned, followed by DNA Technical quantification of PCR where the cytb gene for (C. sinensis & O. bimaculatus ) was amplified by (1066 bp) in length while the long of (L. rohita and P. sophore) was (1252 bp), For each species, after the cytb gene sequencing phase was completed, then sequences were eventually analyzed on all species. Current study indicated that 14 samples for (Clupisoma sinensis) were explored for nucleotide composition at the Vishnupuri dam while 16 samples for (O. bimaculatus) at Jaikwadi [C (28.5%) , G (14.5%), T (U) (27.7%), A (29.4%)] &[ A (29.0%), G (14.4%), C(30.1%), T(U) (26.5%)], respectively. Diversity of nucleotides, Pi(t) between the Nanded and Paithan populations was 0.09309. One Clupisoma sinensis haplotype was formed while two Ompok bimaculatus haplotypes were established, which refers to a low genetic variability of (O. bimaculatus), where the analysis of UPGMA cluster found sequence differentiation only within (O.bimaculate) but none any variance in (C.sinensis). Unluckily, due to certain technical reasons, the other species (Puntius sophore & Labeo rohita) unacquired their cytb gene sequences, consequently we reached for our aim in the present study to determine the genetic variation among out of 2 species from total 4 species of fishes in two different regions.
Introduction
Genetic diversity determines genetic differences that naturally occur between individuals of the same species, and this variability allows a population to have versatility and function in adapting to changing climatic conditions.
Once a species mates, there are periods when non-random mating occurs because one individual wishes to match another according to those features In this event, vary behavior decisions made by organisms of the community, and those choices form the genetic combinations which occur in successive generations [1].
A geographically dispersed population is influenced by the physical distribution of individuals, which never have the same genetic structure in the whole domain [1]. Individuals residing in a community at one end of the scale will be having to live at higher altitudes & experience different climatologic environments than people who reside at lower altitudes on the other edge.The relative abundance of allles at this more extreme border will differ greatly from that at the opposite border. As organisms at either end of the continuum merge and advance towards reproduction, the resultant genetic intermix will result in a larger total genetic variability. Nonetheless, because the distribution becomes sufficiently large that there is less and less likelihood of interbreeding between opposite ends, so the various forces working at each end become more dominant, then the people at either end of the population spectrum may gradually become genetically distinct. Distribution is one means of maintaining genetic diversity Distribution is one way for vast populations to preserve genetic diversity across wide geographic ranges, since opposing factors at both ends can change relative allele frequencies in various ways.
Extrinsic obstacles to migration exerted by landscape factors are especially significant in deciding the genetic makeup of communities of organisms consisting of large numbers of migrating individuals.In recent years, new knowledge on the genetic diversity in wild and cultured populations of many species of fish utilizing. Nuclear and mitochondrial DNA (mtDNA) was given by specific molecular techniques [2]. Without the hereditary recombination DNA of mitochondria is transmitted maternally. Both the evolved rate and the genetic differentiation of mitochondrial DNA across populations are assumed to be around (5-10) times greater than those of nuclear genes [3].
DNA of Mitochondrial provides an important set of markers for phylogenetic and population studies. A comprehensive study was presented on the benefits of mt DNA as a method for genetic study of species [4]. Cytochrome b has been successfully used among many mitochondrial genes to recognise genetic diversity in several fish species of fish [5].
The gene of cytochrome b indicates is intra-specific variability primarily in 3rd location codon and that can be used in stock identification. Studies of Cyprinidae fish populations had also found variances with in cytochrome b gene for mtDNA [6]. Malakars team had studied (Ompok bimaculatus) genetic diversity”. This study aimed to provide an analysis of the genetic variability caused by the impact of extrinsic barriers. Four species (Puntius sophore, Clupisoma sinensis, Labeo rohita & Ompok bimaculatus) of two dam reservoirs (Vishnupuri & Jaikwadi) was chosen, most of the biggest irrigation projects on The River of the Godavari in Maharashtra Indian state. From the hierarchical analysis of genetic variance, four species chosen from the hierarchical study of genetic variability showed that indeed distinction had been relatively large in recognizing the impact of extrinsic boundaries on genetic diversity and community structure in fish.
The study of molecular variation within community and within population accounted for the regional pattern of differentiation. Comprehending the genetic diversity of species (O.Bimacula, L.rohita &P.sophore) will play a crucial role in species survival and development. However, recognizing these obstacles and forecasting their effect in influencing intraspecific genetic differences remains a key obstacle in population genetics. Study examines the impact of environment on population structure formation had concentrated primarily on the results of ecosystem degradation induced via recent anthropogenic disruption. Though clearly significant, these studies commonly exclude context of historical upon this effect of landscapes on temporal changes of genetic connection between naturalistic communities [7]. Accordingly, detailed empirical studies are needed that simultaneously quantify the impact on different geographical scales of individual landscape features [8].
Methods and material
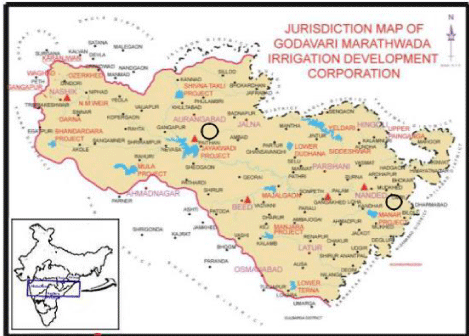
India’s second-largest river native to the Western Ghats Trimbakeshwar is the Godavari River, at a catchment area of 312,812 km2 and an annual long-term average surface runoff of 110 km3 flowing east through Deccan Plateau across the Maharashtra states. Dam of Jayakwadi is among the biggest earthen dam in India (Height 41,30 m & catchment area 21,750 km2) near Paithan. This dam was built to resolve the Marathwada area drought issue and flood issue along the river bank. Whereas one of Asia’s biggest lift irrigation projects is Vishnupuri dam near Nanded (Figure 1).
Four species of fish were obtained from two samples collected (Table 1), & fin clip tissue samples of appropriate size (1-4 sq. cm) had been taken from the left side of the Pectoral or caudal fin or pelvic fine without affecting phenotype. Within 1,5ml microtubes, these tissues were collected were then stored within 100 percent ethanol with correct coding as marked on specimens.The collections were conserved in 70 % ethanol.
Processing specimens
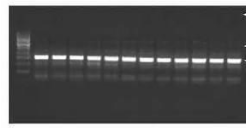
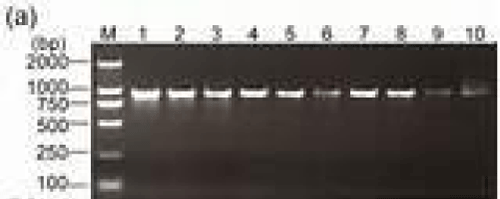
Then sub-sampled the tissue samples and further analyzed for genomic DNA extraction, at -20c tissue stock was retained, after morphological investigations at room temperature in fresh 70 percent ethanol, permanently stored the specimens after it washed in glass jars. The genomic DNAs were extracted using the C-TAB method / DNA isolation kit of the Promega wizard. The isolated DNA’s were further examined for quantification utilizing a spectrophoto-meter for 20 specimens in each species also for quality assurances through agarose gels for those samples of fish & handled by (1 percent) agarose gel as illustrated in Figures 2 (a, b, c, d).
Extracted Genome(DNAs)
Genomes of DNAs were removed of ethanol-conserved fin clips utilizing (CTAB) procedure.
Quantification of DNA
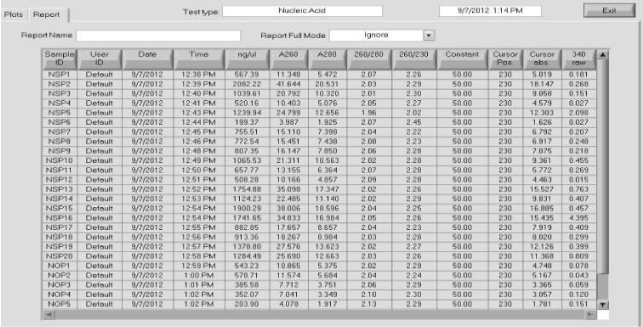
It quantifies the extracted DNA using Nanodrop (proportion 260/280). Test accumulation of nucleic acids (RNA) or Phenolic residues were detected, and then specimens were further examined for PCR amplification (Figure 3).
For the PCR process, primer pairs were used to evaluate the fragment of DNA that will be amplification via the polymerase chain reaction. The choice of the oligonucleotide primers is also a vital step for progress with PCR. Priming pairs for the cytochrome b gene were selected and constructed utilizing Primer 3 as well as Oligocalc software which generated a limited number of priming units .The unique primer selected via attempting all probable combinations from its location, length & relationship to the other primers that fulfill particular terms. Consequently, primers with reasonable accuracy capability achieved a strong rate of performance in the retrieval of barcodes. Constructed primers were illustrated in Table 2.
An attempt was made to amplify the Cyt b gene utilizing sorts-particular primers (Table 2). Used in 96-well plates for PCR reactions using the Kappa biosystems kit. The master reaction combination composed of [(9.6 μl 10% of trehalose), (MgCl2 was added 0.8 μl0), (2.5 μl of 10X PCR buffer, ‘B’), (2 μl 2.5 mM dNTP), (0.1μl Taq polymerase (5units)) added, (H2O to complete volume was 7μl) finally, primordial forward & primordial reverse was added “1 μl 10 mM” for both].
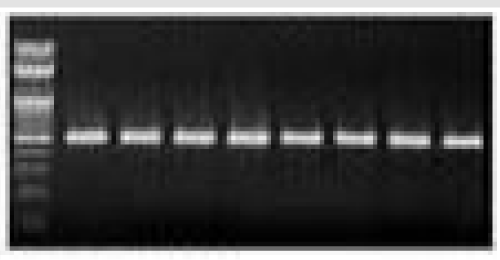
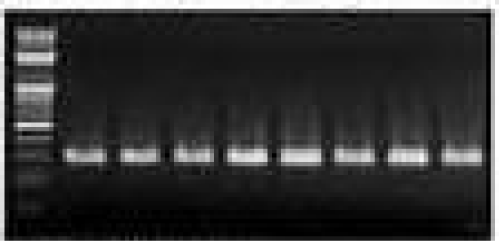
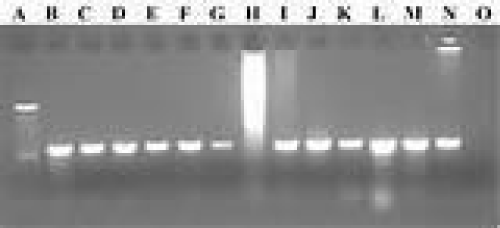
Profile of a PCR amplification consisted of [an elementary “2” min phase at 95C] & [35 cycles of 30 sec at 94C denaturation], [30 sec at annealing range (52-49)C to all fish species] & [extension level of 30 sec. at 72C]expansion final at 10 min at 72C. Representation of amplicons in (1.2 percent) agarose gel, as shown in figures 4(a, b, c, d).
PCR products done to extract unincorporated nucleotide and resultant primers for cleanup. Sequencing reactions utilizing the “BigDye Terminator v.3.1 Process Sequencing Package” (Applied Biosystems, Inc.) using PCR forward and reverse primers as it has reliable sequencing technique. It typically provides lengthy reads of “750’ bp furthermore at templates rich in GCs. The process profiles composed of a previous 3 min stage at 960C and 35 cycles of 30 sec at 960C, 15 sec at 550C, and 4 min at 600C. The sequencing cycle process was preceded via cleanup sequencing through the ethanol deposition process which was then accompanied with a resolving hidi formamide base. In capillary sequencer genetic analyzer ABI 3130 these samples were prepared for sequencing. This tool is bi-directionally sequenced to support full-length barcode sequences thus preventing commonly occurring issues of signal distortion at the end of a read.
Analyzing sequences
Varieties of software packages for the DNA analysis are widely used.
1) Arlequin is a program for community genetic information study, with a broad variety of tools and predictive methods to derive genetic and demographic details from a selection of population samples.
2) Codon technology Aligner is a pioneering DNA sequence research software application. It is widely used in research and biogeography on nature and provides several features including the capacity to compare sequences via ClustalW & muscle, trace sharpening, PHRED, and basic characteristics such as alignment, track, and contiguous editing, end tracing.
3) DNA Star (Lasergene) offers another medium for analysis data of sequence, designing of primer and DNA map drawing, etc.
4) Mega5 is the [Molecular Evolutionary Genetics Analysis program] that utilizes the highest probability (ML) interprets to deduce evolutionary trees, = choosing best-fit replacement templates (amino acid / nucleotide), conclude ancestor’s states and sequences and calculating site-by-site ancestral levels. MEGA user interface has also been updated to be powered by operation and make things easy for both newcomers and seasoned scientists to use.
Results
In this sample, the long of the mitochondrial amplified gene of (Clupisoma sinensis & Ompok bimaculatus) was “1066 bp” long, for cytochrome b analysis, (O. bimaculatus & C. sinensis) was sequenced. But regrettably, the remaining species (Labeo rohita & Puntius sophore) during the sequencing cycle was unsuccessful due to certain technological reasons.
The mean proportion of nucleotides between all of “40”specimens with two populations was studied. In Dam of Vishnupuri for (Clupisoma sinensis) fourteen specimens were analyzed to composition of nucleotide displaying C (28.5%) /T (U) (27.7%)/ G(14.5%)/ A(29.4%) but 16 specimens indicating nucleotide composition C(30.1%) / T(U) (26.5%) / G(14.4%)/ A (29.0%) in Jaikwadi for (Ompok bimaculatus). Gene cytochrome b recorded “100” of variable sites for 1066 bp long regions and 100 parsimonic informative sites. For nucleotide diversity, Pi(t) among Nanded and Paithan populations was 0.09309. A total of three distinct cytb mtDNA haplotypes were identified in two Ompok bimaculatus populations, where detected a haplotype in 4 individuals and the second one observed in 10 individuals at Dam of Vishnupuri whereas reported, just one haplotype in all of 16 individuals at Jaikwadi dam as illustrated in (Table 3).
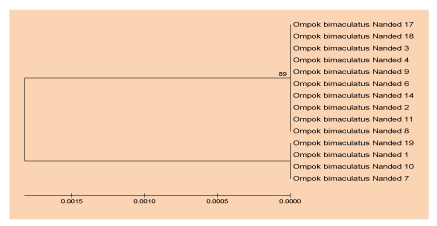
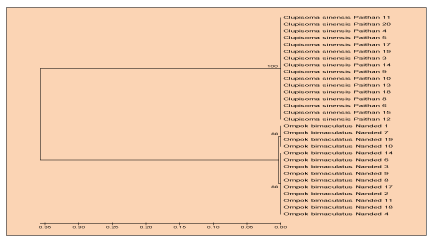
The polymorphism of DNA among populations of Ompok bimaculatus in Vishnupuri dam was measured, where haplotype diversity was 0.44, Variance of Haplotype diversity (0.01254), and the nucleotide diversity obtained (0.00159) as apparent in table 4. for Clupisoma sinensis the genetic variation was unnoticed inside of species from Dam of Jaikwadi whereas genetic diversity was reported in (Ompok bimaculatus) by diversity methods of haplotype and diversity of nucleotide. UPGMA Dendrogram centered on sequences of mitochondrial cytochrom b gene indicates that the two separate clusters of (Ompok bimaculatus) were formed, Figures (5&6). An average genetic space between the populations detected was,”0.01823” thereby suggesting very few genetic variability within individuals of the same species of Nanded dam.
Discussion
The outcomes of this methodology revealed a genetically diverse of Aurangabad, Maharashtra’s Jayakwadi dam (Ompok bimaculatus) & Vishnupuri dam (Clupisoma sinense). One (Clupisoma sinensis) haplotype was established, whilst two (Ompok bimaculatus) haplotypes. The indices of diversity represent a low genetic variation in (O. bimaculatus). Although an analysis of the UPGMA cluster revealed sequence divergence, just in (O. bimaculatus) populations whereas none any divergence in the populations of (Clupisoma sinensis). Species (Puntius sophore & Labeo rohita) had yet to be sequenced and evaluated for their indices of diversity. Consequently, the recent work determined a low diversity of (Ompok bimaculatus) whilst no diversity for (Clupisoma sinensis) amongst these Jaikwadi & Vishnupuri dam populations.
In terms of preserving genetic exchequer, we would assume advantages to be extracted from sustaining the full level of genetic diversity in a strain beside to safeguarding multiple strains using by hybridization as additional sources of genetic information. It follows that the lack of genetic diversity for some cause (e.g., excessive selection, inbreed, seclusion) would lead to a decline in a population’s possible adaptability where it has been found that individuals with greater genetic diversity have better, permanence rates or higher relative development rates. During growth, comparatively heterozygous individuals tend to be more resistant to ecological disturbances. Genetically diverse populations thus have plentiful beneficial traits which absent from genetically poor ones Soule and Wilcox, 1980 [9-11].
- Aldrich PR, Hamrick JL, Charvarriaga P, Kochert G (1998) Microsatellite analysis of demographic genetic structure in fragmented populations of the tropical tree Symphonia globulifera. Mol Ecol 7: 933–944 . Link: https://bit.ly/2F5Vluw
- Was A, Wenne R (2002) Genetic differentiation in hatchery and wild sea trout (Salmo trutta) in the Southern Baltic at microsatellite loci. Aquaculture 204: 493-506. Link: https://bit.ly/2QSMZsZ
- Birky CW, Maruyana T, Fuerst P (1983) An approach to population and evolution genetic theory for genes in mitochondria and chloroplasts and some results. Genetics 103: 513-527. Link: https://bit.ly/3hYhtFH
- Avise JC (1991) Ten unorthodox perspectives on evolution prompted by comparative population genetics findings on mitochondrial DNA. Annu Rev Genet 25: 45-69. Link: https://bit.ly/2QS8PNp
- McVeigh HP, Bartlett SE, Davidson WS (1991) Polymerase chain reaction/direct sequence analysis of the cytochrome b gene in Salmo salar. Aquaculture 95: 225–233. Link: https://bit.ly/3gXdLeg
- Fayazi J, Moradi M, Rahimi G, Ashtyani R, Galledari H (2006) Genetic differentiation and phylogenetic relationships among Barbus xanthopterus (Cyprinidae) populations in south west of Iran using mitochondrial DNA markers. Pak J Biol Sci 9: 2249-2254. Link: https://bit.ly/3boLcp7
- Fahrig L, Merriam G (1994) Conservation of fragmented populations. Cons Biol 8: 50-59. Link: https://bit.ly/3jPdvjd
- Shaw PW, Carvalho GR, Magurran AE, Sheghers BH (1991) Population differentiation in Trinidadian guppies: patterns and problems. J Fish Biol 39: 203-209. Link: https://bit.ly/31YJ9ox
- Soule ME, Wilcox BA (1980) Conservation Biology. An Evolutionary-Ecological Perspective 55. Link: https://bit.ly/2Z7sHjV
- Sah S, Barat A, Pande V, Sati J, Goel C (2011) Population Structure of Indian Hill Trout(Barilius bendelisis) Inferred from Variation in Mitochondrial Dna Sequences Advances in Biological Research 5: 93-98. Link: https://bit.ly/3brdCP6
- The Genetic Variation in a Population Is Caused by Multiple Factors. Link: https://go.nature.com/3jLoudH
Article Alerts
Subscribe to our articles alerts and stay tuned.
 This work is licensed under a Creative Commons Attribution 4.0 International License.




 Save to Mendeley
