Open Journal of Analytical and Bioanalytical Chemistry
Dissolution testing of prolonged-release tablets using experimental design approach
Blagica Manchevska*, Filip Smilcevski, Maja H Gigovska, Packa Antovska and Sonja Ugarkovic
Cite this as
Manchevska B, Smilcevski F, Gigovska MH, Antovska P, Ugarkovic S (2020) Dissolution testing of prolonged-release tablets using experimental design approach. Open J Anal Bioanal Chem 4(1): 034-039. DOI: 10.17352/ojabc.000022Dissolution testing is an essential tool in the pharmaceutical industry and is used in formulation and process development, in monitoring of the manufacturing process, as a quality control test, to predict the in vivo performance. The purpose of this study is to evaluate the behaviour of the test and reference products using conventional dissolution apparatus basket and paddle, with tendency to evaluate the dependence of the in vitro dissolution of the dissolution test conditions (dissolution apparatus, medium, agitation, pH). Experimental design (ED) approach has been employed for assessment of the discriminatory properties of different dissolution conditions. The responses statistically evaluated were: f2 similarity factor and the difference in the dissolution rate between the test and reference product, expressed in percentage, at every time point. Furthermore, this study focusses on developing a statistically reliable mathematical model for predicting discriminatory experimental conditions.
Introduction
A logical, systematic approach taking into consideration both scientific and regulatory principles, should be followed when developing a dissolution method. Properly designed dissolution tests will guide and accelerate drug development, assess batch to batch quality of a drug product, compare new or generic formulations with an existing product, assess the stability of the drug product, ensure the product quality in case of certain scale-up and post approval changes and provide a basis for achieving an in vitro/in vivo correlation. The method should also be challenged to discriminate between batches of material with different quality attributes.
Recently, Experimental Design (ED) have been widely used to understand the effects of multidimensional and interactions of input factors on the output responses of pharmaceutical products and analytical methods [1]. ED is a systematic approach to dissolution method development that begins with predefined objectives, emphasizes product and process understanding and sets up process control based on sound science. The knowledge obtained during development may be used to support the establishment of an operable design space with suitable process controls during the life cycle of the product. These principles are now being considered for application to analytical methods through what is being termed Analytical Quality by Design (AQbD) [2].
In this study, the experimental condition parameters for dissolution testing of the drug product have been evaluated. In order to characterize the release from the dosage form adequately, it is recognized that a drug release profile should be generated, in which release (dissolution) values are determined as a function of time [3]. The experimental test conditions should be discriminating enough (“mild” conditions) to detect formulation and manufacturing variables that may affect pharmaceutical product performance. The following independent variables have been considered: media volume, different pH media, use of apparatus (basket and paddle) and different rotation speed. The purpose of this dissolution study is to evaluate the behaviour of the test and reference products to determine the dependency of the in vitro dissolution of the dissolution test conditions [4]. The objective is to assess the discriminatory potential of the dissolution method dependent from all the regulatory permitted parameters. The responses statistically evaluated are: f2 similarity factor and the difference in the dissolution rate between the test and reference product, expressed in percentage, at every time point.
Experimental
Materials and methods
Chemicals and reagents: Analytical grade acetonitrile, methanol, sodium heptansulfonate, phosphoric acid, sodium hydroxide, sodium chloride, hydrochloric acid, sodium acetate, acetic acid and potassium hydrogen phosphate were purchased from Merck (Darmstadt, Germany). Water was purified by a Werner water purification system, obtained in-house at Alkaloid AD Skopje, Skopje, Republic of North Macedonia.
Dissolution method: Dissolution testing was performed using 708-DS Dissolution Apparatus. Media used were: Simulated gastric fluid without enzymes (SGF), pH 4.5 acetic and pH 6.8 phosphoric prepared according to current Ph. Eur. requirements (5.17.1 Recommendations on dissolution testing). The temperature of the dissolution medium maintained at 37 ± 0.5 °C. In all experiments, the evaluated time points are the following: 15’, 30’, 60’, 90’, 2h, 4h, 6h, 8h, 10h and 12h.
Experimental design: Experimental runs were designed using software MODDE Go ver.12.0.1.3948 (Umetrics, Sweden). D-optimal quadratic design was applied for examining 4 independent variables (factors) at different levels within 24 runs. All the parameters from the dissolution method have been included: media volume, different pH media, use of apparatus (basket and paddle) and different rotation speed. The levels of the independent variables include the entire working spectrum from regulatory aspect. Summary of the design, the coded and actual experimental levels based on two-factorial three-level approach and the experimental matrix are given in Tables 1-3 respectably. The selection of the input factors was performed with intention for the design space to include all the regulatory permitted dissolution parameters. In order to gain more information, the design was enabled with “centre points” option to include mid values of each factor in the experimental design to check for lack of fit and curvature. Thus, a total of 24 runs were arrived for experimentation including 3 centre points.
Chromatographic method: Quantification was performed using HPLC method. HPLC studies were carried out on Agilent 1200 Series liquid chromatograph (Agilent Technologies Inc., Santa Carla, USA) equipped with a Photo diode array detector and UV detector. The mobile phase was comprised of 1.1 g/l sodium heptansulfonate solution adjusted to pH 2.0, acetonitrile and methanol in ratio 70:10:20 (v/v/v) at a flow rate of 0.8 ml/min. Kromasil C18 150 mm x 4.6 mm i.d; 5 µm column was used, maintained at 55°C. Detection was at 230 nm wavelength. Run time of 12 minutes is utilized with injection volume of 50 μl from the sample and the standard solution. Standard solution was prepared in final concentration of 0.08 mg/ml. Dissolution sample solutions at predefined intervals were withdrawn and filtered through 0.45 μm regenerated cellulose membrane filter.
Results and discussion
In order to predict the variability of the results for response variables in relationship with the independent variables within proposed acceptance criteria, the results from the experiments were evaluated. Partial least squares technique (PLS) has been used as a nonlinear regression method for fitting a model to the data. This type of analysis has two objectives: to approximate the response variables and independent variables and to maximize the correlation between them in the projected space. Quadratic mathematical model that best describes the relationship for each of the output factors.
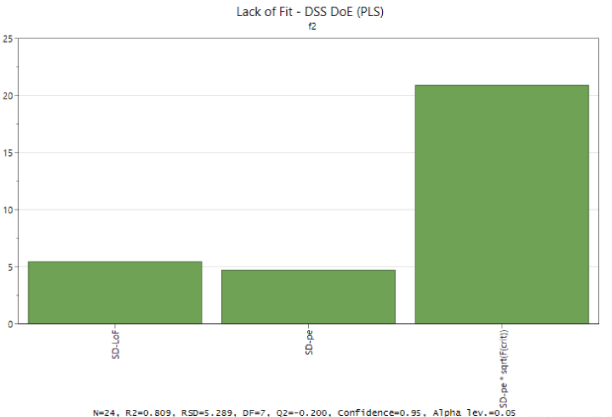
Evaluation of the validity of the model was performed with ANOVA lack of fit (Figure 1). The lack of fit plot compares the Lack of Fit (LoF) component to the pure error component and displays a graph with 3 bars. The critical F is the value of the F-distribution over which SD LoF is statistically significant at the 95% confidence level. Since the first bar is smaller than the third, the lack of fit is not significant at the 5% level, thus the model fits the data.
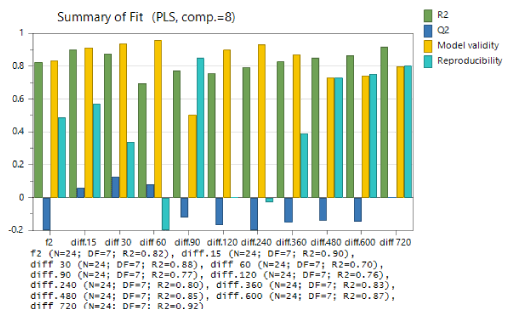
Adequacy of the used model was evaluated using summary of fit. Summary of the basic model statistics for four indicators R2; Q2; model validity and reproducibility are presented for all the response variables (Figure 2). R2 shows the model fit. The values (0.70-0.92) are close to 1 and indicate that the model fits the data very closely. Q2 represents an estimate of the future prediction precision. Model validity is a measure of the validity of the model and a test of diverse model problems. The model validity column (>0.5) is larger than 0.25, hence there is no Lack of Fit of the model (the model error is in the same range as the pure error). Reproducibility presents the variation of the replicates compared to overall variability. Summary statistics for these indicators in relation to concerned response variables: apparatus, medium, rotation speed and volume shows that the model is significant and fits the data, since the model performance indicators comply with the above presented reference values.
The qualitative contribution of each factor on the responses were analysed by Pareto chart (Figure 3). Pareto charts establish critical value of the effect. Coefficients with value of effect above 1 are designated as certainly significant. In this case all investigated effects are considered as insignificant. Nevertheless, most influential input factors on the similarity factor response are the rotations per minute and the volume of the media.
Evaluating output functions, it was taken into consideration that the guidelines have requirements for assessment of similarity of the dissolution profiles. Since none of the factors is statistically significant for the output factors - differences in different time points, the interactions have been evaluated only for f2 as a response (Table 4). Interactions are evident only between apparatus type and volume. The coefficients for this interactions are 0.2096 and -0.2096 for apparatus (basket)*volume and apparatus (paddle)*volume, respectably. The apparatus is a qualitative factor, which means that the value of the coefficients origins from the influence of the volume, increasing the volume contributes to increasement of the similarity factor f2. Furthermore, the volume has different effect on different type of apparatus.
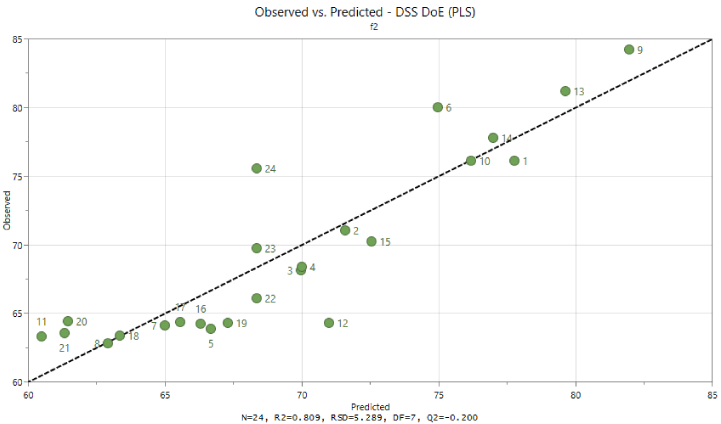
Additionally, observed versus predicted values have been evaluated (Figure 4). Plot with points close to a straight line indicate good model.
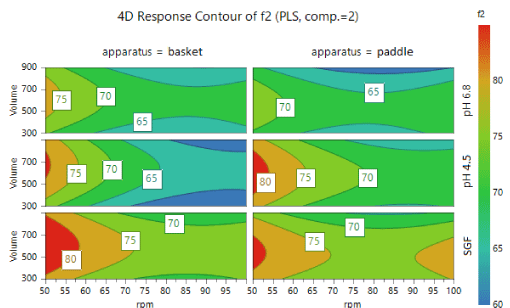
The Response Contour Plot displays the predicted response variables values for the selected response variables, spanned by two factors, in a response surface contour plot. It is used to determine where a maximum (red colour) or minimum (blue colour) response is expected taking in account the independent variables. The 4D response contour of f2 is displayed with the response variables: media volume, apparatus basket or paddle, medium type and rotation speed (Figure 5).
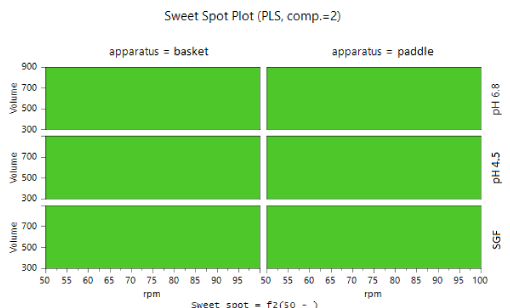
Sweet Spot Plot highlights the areas where the responses are within specified ranges (Figure 6).
Response variables are given in Table 5. An f2 value between 50 and 100 suggests that the two dissolution profiles are similar3. The f2 similarity value is between 62.84 and 84.22. The difference of the percent released in the time points up to 2 hours is less than 5%, which confirms the similarity of the dissolution profiles of both products.
Conclusions
The goal of a well-characterized method development effort is to characterize and develop a reliable method that can be demonstrated with a high degree of assurance to consistently produce data meeting predefined criteria when operated within defined boundaries.
From the above data it can be concluded that all the variable conditions of the dissolution testing with conventional apparatus basket and paddle result in similar dissolution profiles of the test and reference product. According to the sweet spot plot, design space of the analytical method can be defined where the results are independent from the test conditions. In vitro dissolution of both drug products is independent of the dissolution test conditions. The proposed experimental design approach was able to identify critical factors and the gained information could aid in general decision making.
- Fakuda IM, Pinto CFF, Moreira CS, Saviano AM, Lourenco FR (2018) Design of Experiments (DoE) applied to Pharmaceutical and Analytical Quality by Design (QbD). 54: e01006. Link: https://bit.ly/2GAgm1j
- Borman P, Nethercote P, Chatfield M, Thompson D, Truman K (2007) The application of quality by design to analytical methods,Pharmaceutical Technology 31: 142-152. Link: https://bit.ly/3ixHueM
- EMA (2010) Guideline on the Investigation of Bioequivalence. CPMP/EWP/QWP/1401/98 Rev.1/Corr**. Link: https://bit.ly/3ixHCuM
- FDA, CDER (1997) Guidance for Industry: Extended Release Oral Dosage Forms: Development, Evaluation, and Application of In Vitro/In Vivo Correlations. Link: https://bit.ly/3jzVDJF

Article Alerts
Subscribe to our articles alerts and stay tuned.
 This work is licensed under a Creative Commons Attribution 4.0 International License.

 Save to Mendeley
