Journal of Addiction Medicine and Therapeutic Science
What proportion of ever smokers quit? Analysis of information from CAMH from 1996-2016
LL Pederson1*, J Koval2, AR Ialomiteanu3, M Chaiton4 and RE Mann5
2Department of Epidemiology and Biostatistics, Kresge Building Room 201, University of Western Ontario, London, Ontario N6A 5C1, Canada
3Institute for Mental Health Policy Research, Centre for Addiction and Mental Health, Dalla Lana School of Public Health, University of Toronto, 33 Russell Street, Toronto, Ontario M5S 2S1, Canada
4Ontario Tobacco Research Unit, Toronto, Ontario, Canada
5Senior Scientist, CAMH Institute for Mental Health Policy Research, Toronto, Ontario, Canada
Cite this as
Pederson LL, Koval J, Ialomiteanu AR, Chaiton M, Mann RE (2020) What proportion of ever smokers quit? Analysis of information from CAMH from 1996-2016. J Addict Med Ther Sci 6(1): 021-025. DOI: 10.17352/2455-3484.000032Objectives: The purpose of this research is to examine trends in the rates of reported quitting (for more than twelve months) among regular and occasional smokers in the Province of Ontario for over twenty years. In addition to the overall trends, we examine trends for males and females, and for different age groups.
Methods: A range of legislative measures have been implemented in the province. Data are derived from the CAMH Monitor survey, a continuously-fielded (since 1996) cross-sectional telephone survey of the general adult population (ages 18 years or older) of Ontario.
Results: Overall rate of quitting among ever smokers is increasing significantly over time, from 46.5% in 1996 to 65.8% in 2016. The slopes for males and females are significantly different; compared to men, the rate of quitting for women is significantly greater. Three age groups were analyzed: 18-34, 35-54, 55 and over. The rate of quitting is greatest for the oldest group and smallest for the youngest group. The increase in the rate is the same for the youngest and oldest groups; for the middle age group, the increase is about twice that of the other two.
Discussion/Conclusions: The rate of quitting smoking has increased. There is a need to investigate the potential impact of quit smoking messages that focus on the benefits of quitting and provide information on available pharmacological ways to promote quitting. Further investigations could lead to the development of messages and strategies that target individuals who are less likely to quit.
Objectives
In the past two decades rates of cigarette smoking have declined; in some countries the declines have been dramatic [1-3]. “In the United States, more than three out of every five adults who were ever cigarette smokers have quit smoking” [4]. Several possible explanations for the declines can be put forth: increased information about the adverse health effects of cigarette smoking [5,6] and exposure to environmental tobacco smoke [7], fewer public places where smoking is permitted, often supported by legislative restriction [8,9], lower levels of smoking initiation and past year use among adolescents and teens [9], increased availability of smoking cessation aids, although less than one-third of people who quit report using FDA approved aids or behavioural counseling [4], and availability of nicotine delivery devices such as electronic nicotine delivery systems (ENDS) (see https://www.fda.gov/tobacco-products/products-ingredients-components/vaporizers-ecigarettes-and-other-electronic-nicotine-delivery-systems-ends) which purport to have fewer health risks [4,10-12].
Information is available about rates of quitting smoking among people who have been regular smokers. Some recent evidence indicates that the rate of quitting in the general population and among ever smokers may have increased in the past two decades [1,12].
As a result, there are fewer cigarette smokers and more individuals who report quitting in the general population than in the past [13]. However, what is not known is whether the rates of quitting among those who have ever been regular or occasional smokers smoked have remained stable over an extended period of time or whether the rate of quitting among ever smokers has increased over time. In addition, little information is available on whether there have been changes in quitting over time among those with different demographic characteristics, such as age and sex. The purpose of this research is to examine trends in the rates of reported quitting (for more than twelve months) among regular and occasional smokers in the Province of Ontario for over twenty years. In addition, we examine trends in the rates of quitters among the general population, including those who have smoked and the population overall, and examine the trends for males and females, and for different age groups.
Methods
Data are derived from the CAMH Monitor survey, a continuously-fielded (since 1996) cross-sectional telephone survey of the general adult population (ages 18 years or older) of Ontario, conducted by the Centre of Addiction and Mental Health (CAMH) and administered by the Institute for Social Research (ISR) at York University (www.camh.ca/camh-monitor).
The main purpose of the survey is to provide epidemiological surveillance of indicators related to alcohol, tobacco, and other drug use, as well as physical and mental health. The survey uses list-assisted random-digit-dialing methods via Computer Assisted Telephone Interviews. The sampling frame is comprised of commercially available lists of telephone numbers as well as telephone numbers between or on either side of listed numbers. In essence, each randomly selected number from a telephone directory serves as a seed for additional random selections that are not restricted to published landline numbers. For example, if the selected number xxx-xxx-8513 is published in a directory then all numbers from xxx-xxx-8510 through xxx-xxx-8519 are included in the sampling frame even if they are cell phone numbers or unlisted numbers. A computer is then used to generate a random sample of telephone numbers from this frame from which each monthly or quarterly sample is drawn. Because unlisted numbers, cell phone numbers and newly activated numbers are potentially interspersed among published numbers in the sampling frame, this strategy provides a superior sample than one restricted to published landline (or equivalently, line phone, fixed line) numbers alone.
From 1996 to 2010, each annual cycle included monthly samples of between 170 and 215 completions, while for 2011 through 2016, each annual cycle consisted of four independent quarterly samples with approximately 750 completions each. The information from the 2017 survey is not included. The sampling procedure changed in 2017 from a “landline/list-assisted” sampling frame to a “dual-frame” sampling (landline + cell phone sampling frame).
The design employs a two-stage probability selection procedure. Within each regional stratum, a random sample of telephone numbers is selected with equal probability in the first stage of selection (i.e., households). Within households of selected telephone numbers, one respondent aged 18 years or older who could complete the interview in English is usually selected according to the last birthday method. For each calendar year, the monthly or quarterly samples were combined to provide a single annual dataset. Across years, response rates ranged from 69% to 41%, [14], which is consistent with other surveys of this nature [15,16]. The data were weighted to adjust for varying selection probabilities, regional representation and a final post-stratification adjustment to restore the age by gender distribution based on the most recently available census Figures. The weighted sample is considered representative of the non-institutionalized Ontario adult population (48% males, mean age 47.7 years (SD= 17.1), 84% urban).
The institutional research ethics committees at CAMH and York University have approved the survey annually. For the purpose of our study, the 21 annual cycles of the survey (1996-2016) were merged, resulting in a data set with N=56,663 respondents.
Definitions (Table 1): Current cigarette smoking was measured by responses to three items: (tc1) “At the present time, do you smoke cigarettes daily, occasionally or not at all?”; (tc2) “Have you smoked 100 cigarettes in your life?”; and (tc5) “How long ago was it that you last smoked?” Current smoking is defined as someone who responded “daily smoker” or 1) responded “occasional smoker”, 2) has smoked over 100 cigarettes in lifetime, and 3) has smoked within the past 30 days. Former smoking was measured in the following way: the individual responds that they are smoking “not at all” but 1) have smoked 100 cigarettes in their lifetime and 2) have not smoked for the past year or more. Duration of quitting beyond the one year point was not taken into account in the analysis. Individuals who do not fit into one of the two categories of current smoker and former smoker are not included in the denominator when former smoking among ever smokers is calculated. Ever smoking was measured as the combination of Current cigarette smoking and former smoking. Never Smoking was measured by those who responded “not at all” when asked about smoking and indicated that they had not smoked 100 cigarettes in their lifetime. The Other group includes individuals who do not fit into one of the clearly defined categories: 1) those who report they are occasional smokers but have not smoked 100 cigarettes, 2) those who say that they are occasional smokers, have smoked 100 or more cigarettes but have not smoked in the past month, and 3) those whose respond they are not currently smoking, but have smoked more than 100 more cigarettes and have quit less than 1 year ago. Because of the skip patterns in the surveys, it may be difficult to accurately categorize everyone. Finally, some individuals did not respond or refused to respond to at least one of the three smoking questions so their response was counted as Missing.
For each year from 1996 to 2016, weighted frequencies and proportions of both all participants and ever smokers were calculated. Weighted linear regression analyses of the percentages of former smokers were calculated for the years 1996 through 2016, for (1) all ever smokers and (2) for ever smokers by sex and age group categories [17].
Results
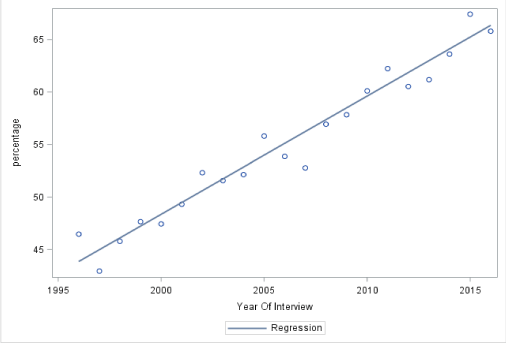
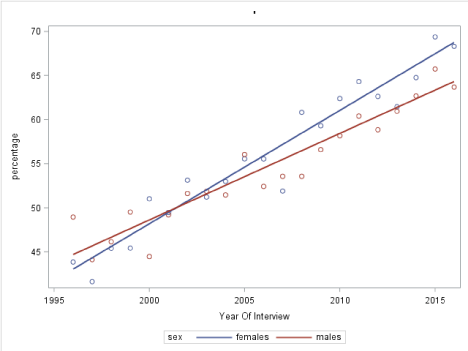
In Table 2 we present the frequency and percentages of each smoking category over the years 1996 to 2016 (with the denominator being the total sample). In Table 3 we restrict our analyses to ever smokers and we present the prevalence of current and former smokers among ever smokers (current and former smokers). Figure 1 shows a plot of former smokers, as a percentage of ever smokers, and the linear regression line over years. This line has slope 1.125 and is statistically significant (p<0.001). Thus, the overall rate of former smoking is increasing significantly over time. Figure 2 shows the plot of former smokers separately for males and females. The slope for the males is 0.959 (increase in percentage per year) and for the females is 1.271; these slopes are significantly different (p= 0.0049), that is, although the rate of former smokers for ever smokers has been increasing over time, compared to men, the rate of former smokersfor women is significantly greater.
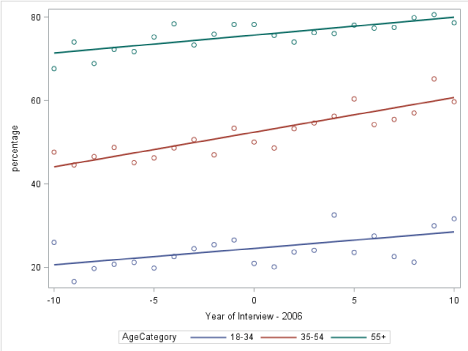
Figure 3 shows the plot of former smokers separately for the 3 age groups: 18-34, 35-54, 55 and over. For ease in interpretation, the independent variable has been centered, that is, the value of the middle year, 2006, has been subtracted from the Year of Interview. The intercept of the regression lines (i.e., the predicted value of the percentage in year 2006) are 75.602 for those age 55 and over (the baseline level of the age category variable), 52.042 for those age 35 to 54 and 23.854 for those aged 18 to 34. The difference in these intercepts are statistically significant (p<0.001); hence the three regression lines are different from each other Although the slopes for 55+(0.4349) and 18-34 (0.3740) are not different (p= 0.673), the slope for 35-54 (0.7959) is significantly different from that of the baseline level, 55+ (p= 0.0148). The rate of former smokers is greatest for the oldest group and smallest for the youngest group. In addition, although the increase in the rate is the same for the youngest and oldest groups, for the middle age group, the increase is about twice that of the other two.
Discussion
It is interesting to note that the rate of former smoking among the general population has remained stable over time, while the rate of former smoking among ever smokers has increased dramatically over time. The difference in the percentages is due to the fact that there has been a marked decline in the per cent of the population who report ever smoking. Possible explanations for the trend in ever smokers is that public health messages and quit smoking strategies have become more accessible and available over time. Quit smoking messages focus on the benefits of quitting, such as avoidance of the detrimental health effects of continued smoking and provide information on available pharmacological ways to promote quitting.
Males appear to be increasingly likely to quit in recent years – it is not clear what the explanation for this finding would be. Perhaps investigation that includes open ended questions might serve to clarify what is happening.
Age is related overall to quitting among ever smokers and could be explained by age related increasing risk of disease among long term smokers [18]. Collection of qualitative information about quitting and aging could provide the basis for interventions and messaging. What is unclear at this point is how much the availability of alternative types of tobacco use are impacting the behaviour of younger smokers [19-21]. In the future, questions concerning substitution of products contingent upon quitting would certainly be in order. One interesting finding from CAMH 2013-2016 is that over 50% of individuals in all three age groups who are categorized as quitters report using e cigarettes in the past 30 days (unpublished findings). In addition, there is more reported past 30-day e cigarette use among quitters than among current smokers in all three age groups.
There are some limitations to the findings that should be mentioned. First is the problem of faulty memory in reporting information on the timing of collisions and of quitting smoking. Second is the issue that may arise when individuals are hesitant to report both of these factors and as a result may misrepresent both of these factors in responses to survey questions. Third it is important to note that the response rates to telephone surveys have been declining over time. Rates of 50% or less are not uncommon.
There is a need to investigate the use of alternative products, as well as reasons for smoking and quitting among all subgroups. Further investigations could lead to the development of messages and strategies that target individuals who are less likely to quit. In addition, cell phone and landline lists have been separated since the 2017 survey. This situation provides the ability to compare information collected from landline and cell phone respondents and may lead to different conclusions.
- Reid JL, Hammond D, Tariq U, Burkhalter R, Rynard VL, et al. (2019) Tobacco Use in Canada: Patterns and Trends, 2019 Edition. Waterloo, ON: Propel Centre for Population Health Impact, University of Waterloo. Link: https://bit.ly/3cqEbDC
- Centers for Disease Control and Prevention CDC (2018) Burden of Tobacco Use in the U.S. Current cigarette smoking among U.S. Adults aged 18 years and older. Link: https://bit.ly/2WAyL2h
- World Health Organization (WHO) Tobacco Key Facts. Link: https://bit.ly/3cgyNmv
- U.S Department of Health and Human Services USDHHS (2020) Smoking Cessation: A Report of the Surgeon General. U.S. Link: https://bit.ly/2xOuy2Q
- Kirst M, Mecredy G, Chaiton M (2013) The prevalence of tobacco use co-morbidities in Canada. Can J Public Health 04: e210-e215. Link: https://bit.ly/3fub8B3
- U.S. Department of Health and Human Services. USDHHS (2006) The Health Consequences of Involuntary Exposure to Tobacco Smoke: A Report of the Surgeon General. Link: https://bit.ly/2SIBfuf
- Centers for Disease Control and Prevention CDC (2016) Health Effects of Secondhand Smoke. Link: https://bit.ly/3biDjzz
- Non Smokers Rights Association (2017) NSRA’s Smoke Free Laws Database. Link: https://bit.ly/2A7ljeJ
- Smoke Free Ontario (2016) Link: https://bit.ly/2SMnVFp
- Beard E, West T, Michie S, Brown J (2016). Association between electronic cigarette use and changes in quit attempts, success of quit attempts, use of smoking cessation pharmacotherapy, and use of stop smoking service in England: time series analysis of population trends. British Medical Journal35: i4645. Link: https://bit.ly/2LceyKQ
- Edwards SA, Bondy SJ, Callaghan RC, Mann RE (2014) Prevalence of unassisted quit attempts in population-based studies: A systematic review of the literature. Addict Behav 39: 512-519. Link: https://bit.ly/3cec6j7
- US Public Health Service and the National Cancer Institute (2012) Monograph 12: Population Based Smoking Cessation Proceedings of a Conference on What Works to Influence Cessation in the General Population. Tobacco Control Monograph Series, Monograph 12. Link: https://bit.ly/3b9ppjf
- Cancer Trends Progress Report. Quitting Smoking (2019) Link: https://bit.ly/2WeaDUg
- Ialomiteanu AR, Adlaf EM, Mann RE (2017) CAMH Monitor 2017: Metadata User’s eGuide. Centre for Addiction and Mental Health. Link:
- Fan W, Yan Z (2010) Factors affecting response rates of the web survey: A systematic review. Comput Human Behav 26: 132-139. Link: https://bit.ly/2La6URl
- Graham W (2015) An empirical examination of the relationships between response rate and nonresponse bias. Statistical Journal of the IAOS. Journal of the International Association for Official Statistics 31: 305-315.
- SAS Institute Inc (2017) Base SAS® 9.4 Procedures Guide, Seventh Edition. Cary, NC: SAS Institute Inc. Link: https://bit.ly/2WzIfLq
- U.S. Department of Health and Human Services USDHHS (2014) The Health Consequences of Smoking-50 Years of Progress: A Report of the Surgeon General. Atlanta: U.S. Link: https://bit.ly/2yG9CeL
- Dinert L, Bayoumy D, Pelletier H, Schwartz R, O’Connor S (2019) E-cigarette use for smoking cessation: Scientific evidence and smokers’ experiences. Ontario Tobacco Research Unit. Link: https://bit.ly/3cjpdiU
- Ialomiteanu AR, Hamilton H, Adlaf EM, Mann RE (2016) CAMH Monitor eReport: Substance Use, Mental Health and Well-Being Among Ontario Adults, 1977-2015 (CAMH Research Document Series No. 45). : Toronto, ON: Centre for Addiction & Mental Health Link: https://bit.ly/3cfIO3y
- Ialomiteanu AR, Hamilton HA, Adlaf EM, Mann RE (2018) CAMH Monitor e-Report: Substance Use, Mental Health and Well-Being Among Ontario Adults, 1977–2017 (CAMH Research Document Series No. 48). Toronto, ON: Centre for Addiction and Mental Health. Link: https://bit.ly/3dxv9oR
Article Alerts
Subscribe to our articles alerts and stay tuned.
 This work is licensed under a Creative Commons Attribution 4.0 International License.


 Save to Mendeley
