International Journal of Veterinary Science and Research
A perspective on household dairy farming in district Naushahro Feroze, Sindh Pakistan
Israr Yasin*,Talha, Hira, Warisha, Sajid Hussain
Cite this as
Yasin I, Talha, Hira, Warisha, Hussain S (2019) A perspective on household dairy farming in district Naushahro Feroze, Sindh Pakistan. Int J Vet Sci Res 5(2): 071-075. DOI: 10.17352/ijvsr.000044A household (HHs) survey was conducted to collect the information on household dairy farming with special reference to management of livestock, milk production and marketing as well as role of livestock in household income in Naushahro Feroze district of Sindh Province of Pakistan. Six hundred households were selected from 40 villages in four out of nine Talukas (administrative units) using multistage clustering method. Estimates of the study revealed that 54% of the households possessed buffaloes. Average number of buffaloes was estimated at 4.28 while 376 (63%) of the household reported cattle with average number of 4.38 heads per household. Small number of buffalo and cattle bulls were recoded. Average number of 5.55 goats per households was reported by 35% of all the households. On an overall basis, 2,365 liters of buffalo milk was computed from 600 households, while 1,033 liters (43.7%) was used in households and 1,332 (56.3%) liters was sold. About 1,868 liters of cow milk were computed from 600 households, while 915 liters (49%) of milk used in households and 953 (51.0%) liters were sold. Majority of houses supply milk to milk collection agents (72.0%), while the most prevalent mode of payment was recorded on weekly basis (73%). About 66.0% of the respondents reported that they contact veterinary doctors. Relatively more proportion (39.0%) of abortion was estimated for the households who used Oxytocin before milking of animals. Using chi-square statistic, the relationship between use of Oxytocin and abortion in large animals was found highly significant (p<0.01). On an average basis, 3.0% growth rate in livestock was estimated. The highest growth rate (5.0%) was recorded in buffaloes. Livestock contributed about 21.0% to household income (sale of milk 11% and sale of animals 10%). Relatively more proportion of females was recorded in livestock rearing (44.6%); followed by skilled labor (handicrafts: 28%), and agriculture (12.1%).
Introduction
Like other developing countries, dairy farming plays a pivotal role in providing food security in Pakistan. Majority (70%) of the farmers are dairy holders possessing up to 10 animals [1]. Livestock provides livelihoods to around 33 million people and majority of them are living in rural settlements. Livestock contributes a share almost equal to agricultural crops in national GDP, which is collectively about 23% [2]. Milk marketing is gaining importance in Pakistan due to attractive prices of milk, especially after induction of food companies viz. Nestle, Engro-foods and Haleeb. Pakistan is producing 42.199MT of milk (buffalo 26.223 and cow 14.437MT), out of that 34.06MT (cow 11.55, buffalo 20.99) is available for human consumption. The value of total milk production is much higher than that of major crops of the country viz. wheat and cotton [3]. Since agriculture is a risky business and vulnerable to weather, therefore, income of farmers varies dramatically from seasons to season and bankruptcy is a common phenomenon especially during cropping season in developing countries. However, livestock provides an economic-safety shield to farmers from poverty menace [4].
Naushahro Feroze district is one of the poor districts of Sindh province of Pakistan in terms of development indicators. Being a lower riparian, the district is facing water shortage, hence, natural livelihood options have depleted during the last many years. In this situation, livestock is one of the major economic sources of livelihood of the people. The study was conducted to estimate the number of animals, milk production, domestic consumption and sale, record management and facilities in livestock farming, estimate contribution of livestock income to total household income, and explore the female contribution in household dairy farming in the district.
Materials and Methods
Research design
The design of this research was descriptive survey and the purpose was to collect in-depth information about livestock and its contribution to total income of the households of rural settlements of Naushahro Feroze district. According to Cohen and Manion and Trochim [5.6] a descriptive survey design is appropriate for obtaining people’s perceptions on social issues and facts concerning the current status of phenomena and/or for describing the nature of existing conditions in a situation.
Target population: The targeted population of the study was rural settlements of Naushahro Feroze district. Hence, the estimates reflect the information about livestock in rural settlements of Naushahro Feroze district. A randomization technique was adopted, while selecting villages and households.
Study population and representative sample size: Out of nine (9), four (4) talukas were purposively selected covering the agroecological zones. The randomly selected talukas were Bhiria City, Moro, Kandiaro and Mehrabpur. Description of agro-ecological zoning of the selected talukas can be reported as Moro being coastal area, Bhiria City having advantage of main highway to Karachi, Bhiria taluka representing rocky area (Jalbani side) and Mehrabpur as agriculture based taluka. A sample of 600 households was selected from four (4) talukas as mentioned above with equal number of households (150) from each taluka. A multistage-cluster sampling was applied to select households. In the first stage, 40 villages were selected (10 villages from each taluka) and in second stage, 600 households were selected from 40 villages (averagely 15 households from each village). Randomization was done to select villages and households using systematic sampling whereby every k item is selected.
Data collection and analysis: Personal interviews were conducted to collect required information on a structured questionnaire. Data were collected during June and July 2010 by 4 Enumerators. Total time taken to interview a respondent was estimated 45 minutes. About 30 questionnaires were filled in a day. Thus, the survey was completed in about 20 days. Statistical Package for Social Sciences (SPSS, Version 17) was used to analyze the data. Descriptive and inferential statistical methods were used to analyze the data. Descriptive methods included arithmetic mean, frequencies, percentages and totals while using inferential statistics multiple linear regression models was used to explore determinants of milk production. Stepwise regression method was applied to select significant independent variables. Before running regression, traditional level of significance at 5% was decided to include the variables in the proposed model.
Results and Discussion
Households possessing livestock
Table 1 reveals the households possessing buffaloes. On an overall basis, 323 households (54%) possessed buffaloes. Average number of buffaloes was estimated at 4.28. Thus total number heads of buffaloes was recorded at 1,383. Average number of adult buffaloes was recorded at 2.72 per household in 306 households (51%) while the average number of milking buffaloes was estimated at 1.73 in 259 households (43%). Thus, total number of buffaloes was estimated at 831 while milking buffaloes were 448, which is equivalent to 54% while rest of the buffaloes (46%) were attributed as dry. Cattle were reported in 376 (63%) households with average number of 4.05 heads per household. Like buffaloes, a small number of bulls were recorded. Total number of buffalo bulls was only 13. Number of adult cows was estimated 808, while milking cows were 503; which is equivalent to 62% of adult cows.
Total number of goats was estimated at 1,165 with average number of 5.55 heads per households as reported by 210 household, equivalent to 35% of all the households surveyed (Table 2). Only 146 sheep were recorded in 15 households (2.5%). Segregated data reflected that only 7 rams were enumerated in only 3 households and 96 ewes were observed in 14 households, while 43 lambs were recorded in 9 households. The average number of ram, ewe and lambs per household was estimated at 2.33, 6.86 and 4.78, respectively.
Table 3 presents the buffalo milk production, consumption and sale. About 2,365 liters of buffalo milk was computed from 600 households while 1,033 liters (44%) was used in household while 1,332 (56%) liters was sold. Likewise, 1,868 liters of cow milk was computed from 600 households while 915 liters (49%) were used in household while 953 (51%) liters were sold [7], suggested that higher milk production can be obtained by providing clean and good housing to animals. The animal should be facilitated with drinking water. Sheds of the animals should be well ventilated with protection of the animals from extreme temperatures and strong winds. There should be proper drainage system to keep hygiene at the farm. It consists of a built up animal shed, a brick soling paddock for animals, calving pens in which pregnant animals are kept separated from other animals before calving, one room for milk storage, one room for storing farm equipment and one for compound feed storage.
Distribution (%) of milk sale of households
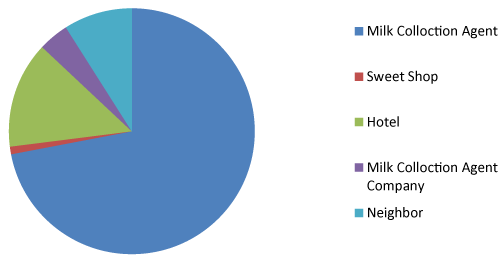
Figure 1 depicts the distribution of milk sale by households. On an overall basis, majority of houses supply milk to milk collection agents (72%), followed by hotels (14%), neighbours (9%), milk collection agents of companies (4%) and sweet shops (1%).
Mode of payment by purchaser
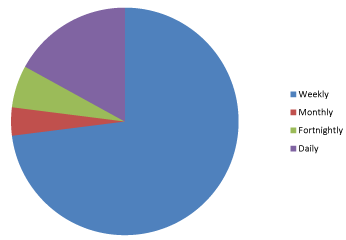
Figure 2 represents the mode of payment of various purchasers of milk in Naushahro Feroze district. On an overall basis, the most prevalent mode of payment was documented on weekly basis (73%), followed by daily (17%), fortnightly (6%) and monthly (4%). Majority of sweet shops (63%) preferred to clear payments on daily basis. All milk companies make payment on weekly basis. Barring sweet shops, all the purchasers of milk pay their dues on weekly basis.
Livestock sheds
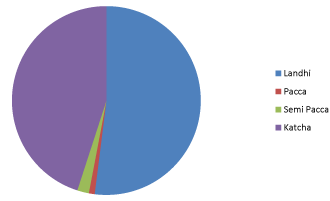
About one third (34%) of the households reported the livestock shed facility. Figure 3 reveals the distribution of livestock sheds by type. Landhi (made of wood and straw) was reported as more than one-half (52%) of all the livestock sheds. Proportion of katcha sheds (made of mud) was estimated 45%, whereas pacca and semi pacca sheds were 1 and 2%, respectively. Table 4 shows the area of livestock sheds. Average uncovered area of livestock sheds was reported to be 1,655 sq feet while average covered area was 1956 sq feet with minimum and maximum shed area of about 50 and 60,000 sq feet, respectively. Majority of the respondents reported that the livestock is tethered by chain under trees outside their houses.
Basic Information about vaccines
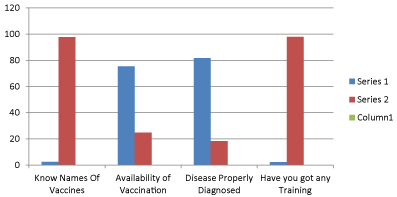
Figure 4 summarizes information regarding respondents’ perceptions about vaccines. A very small number (2.4%) of the respondents knew the names of vaccines. Majority (75.3%) of the respondent shared information that vaccines are available in the market. Likewise, quite a large proportion (81.7%) of the respondents reported that diseases are properly diagnosed. However, quite a small number (22%) of the respondents agreed that proper rates are charged. Only 2.2% of the respondents reported that they have got any training in livestock vaccination.
Source of treatment of sick animals
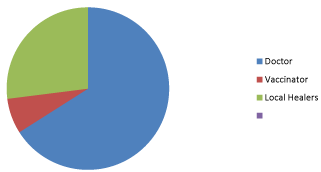
Figure 5 unveils the source of treatment of sick animals. About 66% of the respondents reported that they contact veterinary doctors while 27% with local healers and only 7% with vaccinators. Local healers were found active in Moro where almost half (47%) of the respondents nominated local healers as a source of treatment for their sick animals.
Livestock farmer’s perceptions regarding use of oxytocin
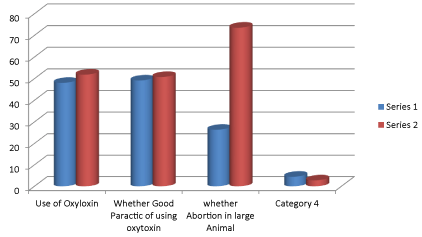
Less than half (48.1%) of the respondents reported that they use oxytocin before milking (Figure 6). Trend of using oxytocin was relatively higher in Moro where 49.2% of the respondents reported use of this milk letdown hormone. Almost half of the respondents called it (i.e use of oxytocin) a good practice. About one fourth (26.4%) of the respondents reported abortion in large animals.
Association of use of oxytocin with abortion table 5 shows association of use of oxytocin and abortion. On an overall basis, 26.5% of the respondents reported abortion in large animals. Relatively more proportion (39.0%) of abortion was estimated for the households who used oxytocin before milking of animals. Using chi-square test, the relationship between use of oxytocin and abortion in large animals was found highly significant (p<0.01).
Livestock farmers’ perceptions (%) about feed
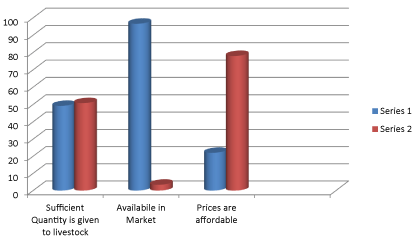
Summarized information concerning livestock farmer’s perceptions (%) about feed has been displayed in Figure 7. About half (49.2%) of respondents were of the opinion that sufficient quantity of feed is given to livestock. On the other hands, quite a large proportion (96.6%) of the respondents reported that feed is available in the market. However, only 22.0% of the respondents stated that prices are affordable. It was concluded that in certain cases livestock feeds are available, but beyond the purchase of an ordinary livestock farmers due to lack of money.
Growth trends in livestock during one year
Growth trends in livestock during one year are shown in table 6. On an average basis, 3.0% growth rate in livestock has been estimated. The highest growth rate (4.9%) was recorded for buffaloes, followed by cows (3.10%) and goats (1.10%) while sheep are decreasing at 3.90%. Highest mortality rate was reported for goats (10.60%), followed by buffalo (6%), cow (5.5%) and sheep (2.6%).
Contribution of livestock in household income
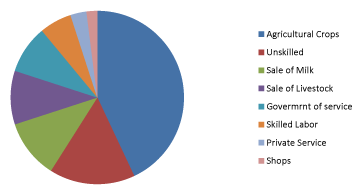
Average monthly income of a household was about Rs. 19,000 with standard error of the mean of about Rs 960. Figure 8 reveals the distribution of income by profession. About 43% of the income was estimated form agricultural crops. Income of unskilled labor contributed about 16% and was ranked as the second major source of income. Income earned from “sale of milk” and “sale of livestock” was ranked as the third and fourth source of income accounting for about 11% and 10%, respectively. Collectively, livestock contributed about 21% to household income. Share of income from government services was 9% followed by skilled labor (6%), private service (3%), and business and shop (2%).
Labor force by gender
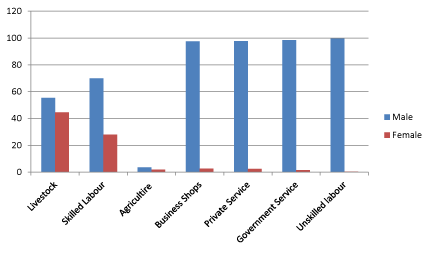
Figure 9 shows the labor force by gender. Very small contribution of females was recorded in service and business professions. However, relatively more proportion (44.6%) of females was recorded in livestock rearing followed by skilled labor (handicrafts: 28%) and agriculture (12.1%).
Suggestions
Based upon estimates collected through this study and observations recorded during survey, the following suggestions are furnished. Milk processing companies should be encouraged to install chillers and purchase milk from remote areas of Naushahro Feroze district. Veterinary department of Provincial Government and NGOs should facilitate each other in the development of livestock, diagnosis of disease, supply of vaccines, and awareness campaigns. There should be district wise epidemiological units, so they can predict and estimate the actual magnitude of disease threats and prepare a proper strategy to combat contagious and zoonotic diseases. Awareness campaigns should be started against the use of oxytocin in milking buffaloes.
Conclusion
It is a matter of fact that dairy farming plays a significant role in moving the economy wheel of rural households. In this regard, this study was conducted in Naushahro Feroze district of Sindh province of Pakistan to estimate the contribution of small dairy farming in household incomes. Estimates of this study were inferred to whole districts computed from a sample of 600 farmers selected from 40 villages in four out of nine talukas based upon agro-ecological zones. Cattle and Buffaloes were preferred and possessed by 63 and 53% of households. Milk from cattle and buffaloes was major source of food and income generation since half of the milk produced was used as household consumption while the remaining half was sold in local market. Livestock contributed about 21% to household income (sale of milk 11% and sale of animals 10%). Milk collection agents (73%) were reported to be major milk selling channel of these small dairy farmers. Negative impact of oxytocin was recorded since 39% of abortion was estimated for the households who used oxytocin before milking of animals.
- Ali T (2006) Pakistan. A case study of milk production and marketing by small and medium scale contract farmers of Haleeb Foods Ltd, Markets Innovative Practice series, IIED, London. Link: https://tinyurl.com/y6fdxpxa
- GoP (2009) Economic Survey 2008-09. Islamabad. Ministry of Finance. Link: https://tinyurl.com/yyxdnhj s
- Ali I, Tariq MM, Bajwa MA, AbbasF, Isani GB, et al. (2011) A study on performance analysis of Holstein-Friesian cattle herd under semi-intensive management at Pishin dairy farm Balochistan. Igdir University. J Inst Sci and Tech 1: 53-57. Link: https://tinyurl.com/y4j78qlg
- Ahmad Z, Khan M, Khan MS, Ahmad MD (1989) Effect of season on postpartum fertility parameters in Sahiwal cows. Pak. J Agric Sci 26: 118-124. Link: https://tinyurl.com/y3url8gs
- Cohen L, Manion L (1980) Research methods in education. Croom Helm: London. Link: https://tinyurl.com/y3o3aad6
- Trochim W (2000) The research method knowledge base, 2nd edition. Atomic Dog Publishing, Cincinnati, OH. Link: https://tinyurl.com/y55g725t
- Zia U (2007) Improved market access and smallholder dairy farmers’ participation for sustainable rural development. Asia Dairy Farming 5: 234-240.
Article Alerts
Subscribe to our articles alerts and stay tuned.
 This work is licensed under a Creative Commons Attribution 4.0 International License.

 Save to Mendeley
