Global Journal of Obesity, Diabetes and Metabolic Syndrome
Comparison of Resting Metabolic Rates: Calculated using predictive equation and measured using Portable Indirect Calorimeter
Yue Deng1* and Barbara J Scott2*
2School of Medicine, University of Nevada, Reno, Reno, Nevada, United States, 89557, USA
Cite this as
Deng Y, Scott BJ (2019) Comparison of Resting Metabolic Rates: Calculated using predictive equation and measured using Portable Indirect Calorimeter. Glob J Obes Diabetes Metab Syndr 6(1): 010-016. DOI: 10.17352/2455-8583.000036Objective: The aim of this research was to examine differences between measured RMR from a portable indirect calorimetry device and calculated RMR from the predictive equation.
Methods: Seventy-nine participants were recruited for the study. RMR measures with the portable IC device were compared with RMR values calculated using Mifflin-St. Jeor Equation (MSJE). Subjects were divided base on body fat %: Group A included 35 lean/normal participants; Group B included 44 overweight participants.
Results: Group A (r2=0.947): The mean RMR by IC was 49 kcal/day higher than MSJE (p=0.44). Considering a cut-off difference (calculated RMR-measured RMR) of ±200kcal/day, the RMR by IC was lower than MSJE for 28% of subjects and higher for 43%. Differences ranged from -890 to +670 kcal/day. Group B (r2=0.943): The mean RMR by IC was 147 kcal/day lower than MSJE (p=0.02). Considering a cut-off difference of ±200kcal/day, RMR by IC was lower than MSJE for 39% of subjects and higher for 20.5%. Differences ranged from -660 to +950 kcal/day.
Conclusion: The analyses indicated no significant differences between the calculated and measured RMR for the groups. However, the individual RMR results support the use of the mobile IC to provide more accurate and personalized measurements of RMR.
Introduction
Resting metabolic rate (RMR) refers to the sum energy needed for all chemical reactions or processes that occur within a living organism in order to maintain basic life [1,2]. It assesses an individual’s daily energy expenditure at rest, and provides useful information for patients with a variety of health concern [3-5].
Methods to measure RMR have been reported in the past decades. Lavoisier and Paulze first brought up direct calorimetry (measurement of heat production) for measuring metabolic rates [6]. Later on, the indirect calorimetry (IC) method was developed to measure RMR by using O2 consumption rate and CO2 production rate [7,8]. Currently, there are many IC instruments used primarily in hospitals for diagnostic purposes. However, these IC instruments are usually bulky (not portable outside of the hospital) and expensive, and their operation requires professionally trained staff. Newer handheld portable IC devices provide convenience, ease of use, and affordability for measuring RMR in the outpatient setting.
Because of the limitations of the traditional IC equipment described above, predictive equations for RMR have been developed [9-11]. These equations typically use physical parameters such as age, height, weight and gender to predict the RMR value. Among those equations, Mifflin-St Jeor Equation (MSJE) is one of the most widely recommended and used [11]. This equation was developed from IC measurements with traditional equipment on a large sample of healthy normal weight and overweight subjects.
However, due to the wide variability between individuals in factors affecting RMR (such as body composition) [12], RMR will vary even for subjects with the same physical parameters. In this study, RMR obtained from measurement by a portable IC instrument is compared with RMR calculated with the MSJE predictive equation. The aim of this study is to evaluate the agreement between these two methods and assess the difference.
Methods
Participants
A total of 79 adults (32 males) participated in the study. Participants were recruited in the greater Phoenix area in 2016. To be included in the study, participants could have no health conditions or be taking any medications that might affect metabolic rate, they could not use tobacco, and female subjects could not be pregnant and/or lactating. The Arizona State University Institutional Review Board approved the study protocol (IRB protocol # STUDY00004264) and all participants provided written informed consent before participating in the study.
Measurements
Participants were required to adhere to the following pre-test conditions: no food or caffeine intake in the past 4 hours, no strenuous exercise performed for the past 12 hours, and no moderate exercise performed 4 hours before the test. Participants were introduced to the testing procedure in the beginning. Physical parameters were then recorded. Three RMR measurements were done in the same morning once the resting state was assured. All participants adhered to testing instructions.
Resting metabolic rate (RMR) was measured using a portable indirect calorimeter Breezing®. The Breezing® device evaluates energy expenditure (EE) by detecting the rate of oxygen consumption and carbon dioxide generation in breath. It is based on a flow meter for breath flow rate detection and a chemical sensing cartridge for breath oxygen and carbon dioxide measurement, which uses a cell-phone camera for optical detection. As reported previously [13,14], figure 1 shows the testing configuration of the Breezing® device. The device connects wirelessly to an iOS/Android mobile device, via Bluetooth®. A QR code with pre-calibrated sensor information is applied on the single-use sensor cartridge, which can be scanned and recognized by the mobile application.
During the measurement, participants breathed through a disposable mouthpiece attached to the Breezing® device. The data received on the mobile device was processed and displayed on the user interface. The Weir equation was used to determine RMR from the measured oxygen consumption rate and CO2 production rate [8]. Validation of this device has been previously described [13]. Three RMR measurements were completed by each participant to ensure the precision of the test.
Physical parameters, including height, weight, gender, age, and body fat percentage (BF%) were recorded. Body compositions was determined by Tanita bio-impedance scale (model: BC-554 IRONMAN® Body Composition Monitor). Height was measured with a wall-mounted stadiometer. Based on their body fat % [15,16], participants were divided into two groups: Group A included 35 participants whose body fat % was under the lean/normal range (BF%<19% for male and <33% for female) while Group B included 44 participants whose body fat % was in the overweight to obesity range (BF%>19% for male and >33% for female). It needs to be mentioned that one male subject’s body fat percentage was 19.6%, although his Body Mass Index (BMI) was 26.7 kg/m2. Thus, he was included in the lean/normal group. These parameters were used to calculate RMR from the MSJE. Summary of all participants has been included in table 1.
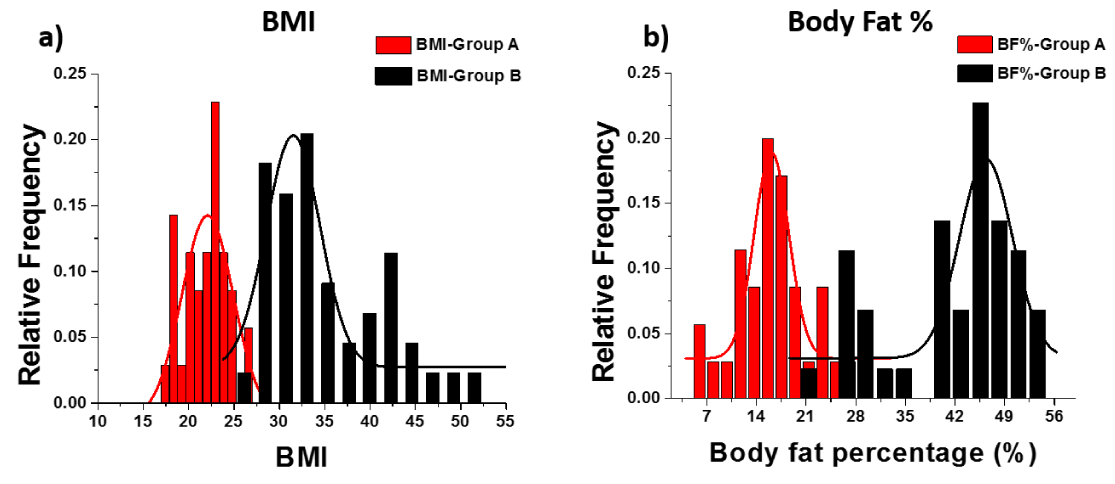
Participants’ body mass index (BMI) and body fat percentage (BF%) distribution
BMI and BF% distribution of Group A and B are compared in figure 2. The red and black curves represent the fitted normal distribution (Gaussian fitting) of each group accordingly. The overlap of BF% is due to different cut points used for males and females.
Mifflin-St Jeor Equation (MSJE) has been used in this study to predict the participants’ RMR from their age, gender, weight and height. The regression equation from 498 healthy individuals is [11]:
RMR (kcal/day) = 9.99×weight (kg) + 6.25×height (cm) – 4.92×age (y) + 166×sex (males, 1; females, 0) – 161
Statistical analysis
Agreement between the indirect calorimetry measured RMR and predicted RMR in Group A, Group B and Group A+B has been analyzed using Bland-Altman method [17]. Differences in IC measured and predicted RMR were calculated both as absolute value (kcal/day) and as the percentage difference. Paired t-test was performed on the groups to determine whether there was a significant difference between the two methods. An α level was set at 0.01 to indicate statistical significance.
Results
RMR measured using pIC and calculated using MSJE
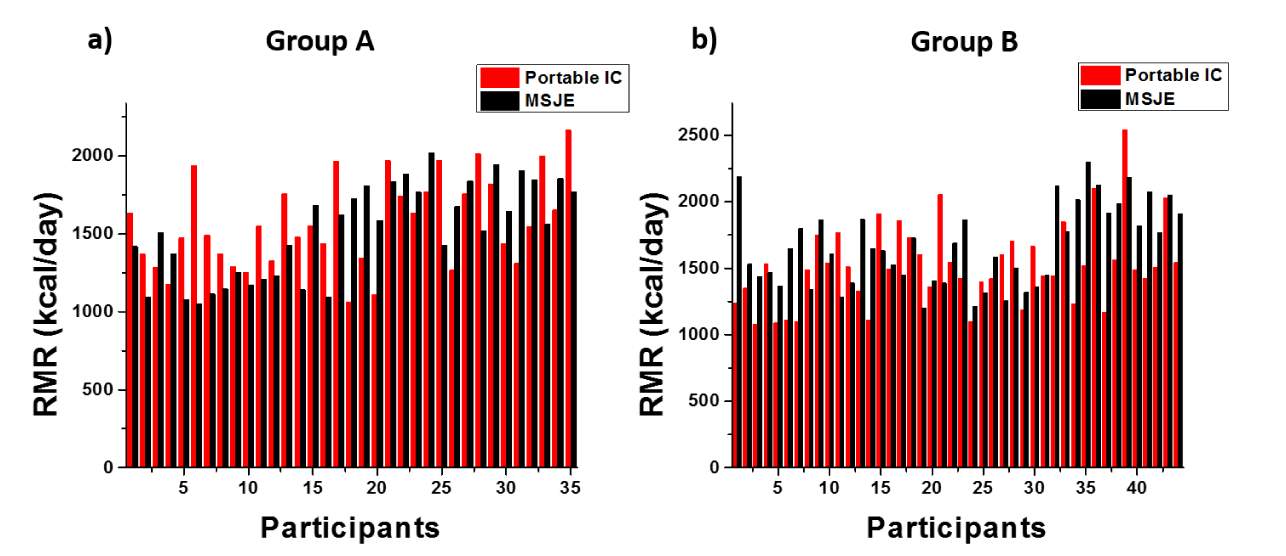
The RMR of every participant was measured three times using the portable indirect calorimeter and averaged, and RMR value was calculated using the MSJE. A comparison of measured RMR from portable IC method and MSJE predicted RMR is shown in figure 3.
RMR differences between two methods
Group A: The absolute RMR difference between MSJE and the portable IC (MSJE - IC) and the magnitude of difference (percentage) are shown in figure 4. Considering the portable IC precision and system error, a range of ± 200 kcal/day was used to determine agreement of measured versus calculated RMR. The RMR measured by portable IC was lower than MSJE for 28.6% of participants (n=10) and higher for 42.9% (n=15). Differences ranged from -887 to +665 kcal/day. An equivalence value for magnitude of difference was set at ± 10%. The RMR measured by portable IC was lower than MSJE for 31.4% of participants (n=11) and higher for 42.9% (n=15). No significant difference was noted for either group for either of these comparisons.
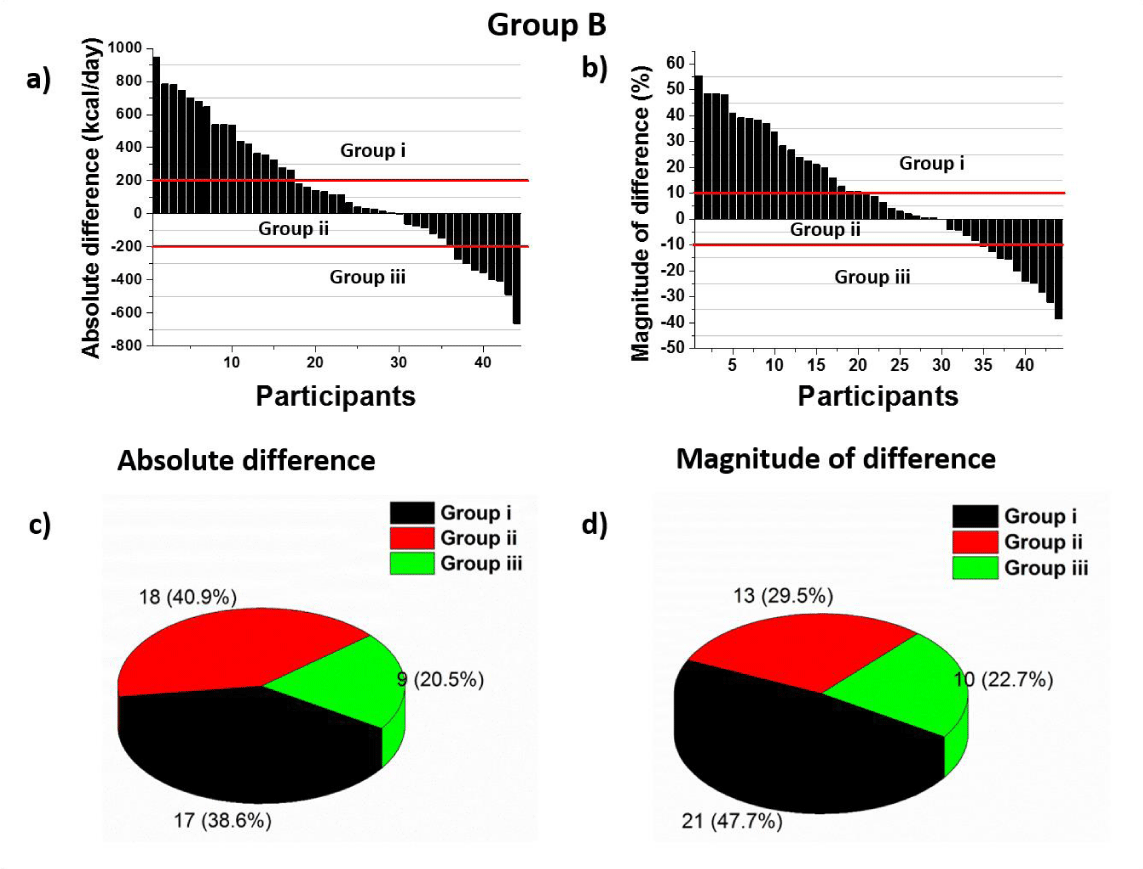
Group B: Similarly, the individual RMR differences between MSJE and the portable IC (MSJE – IC) are shown in figure 5 in both absolute value (kcal/day) and percentage difference. The RMR measured by portable IC was lower than MSJE for 38.6% of participants (n=17) and higher for 20.5% (n=9). Differences ranged from -664 to +949 kcal/day. The RMR measured by portable IC was lower than MSJE for 47.7% of participants (n=21) and higher for 22.7% (n=10). These differences were not significant.
Bland-altman analysis
In order to evaluate the whether the RMR differences between the portable IC and MSJE were significant, the Bland-Altman method was applied [17, 18] to examine both correlation and bias between the two methods.
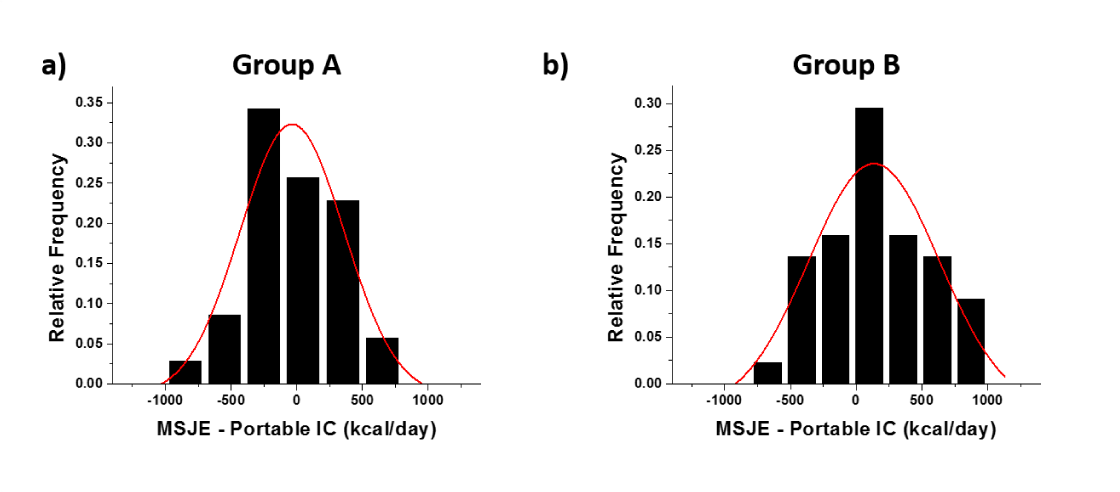
Before analyzing the bias, normal distribution of the differences was verified [18]. The histogram of differences between MSJE and portable IC was plotted, and Gaussian distribution was fitted to the histogram to verify the normal distribution is shown in figure 6, and the statistics are shown in table 2. The agreement limits are calculated as d-1.96 SD to d+1.96 SD
Average value of different groups and p values are summarized in Table 3. Two-tailed paired t-test has been run. α=0.01 and p<0.01 is considered to reject the null hypothesis. All the p values are higher than 0.01, indicating no significant difference between predicted/calculated and measured RMR for any of the groups. It might be noticed that the P value of females in group A is 0.01, which is just above the cut-off value. However, if we consider the standard deviation of this set of data and system error mentioned in previous part, we could still conclude that there is no significant difference between the two methods on this population.
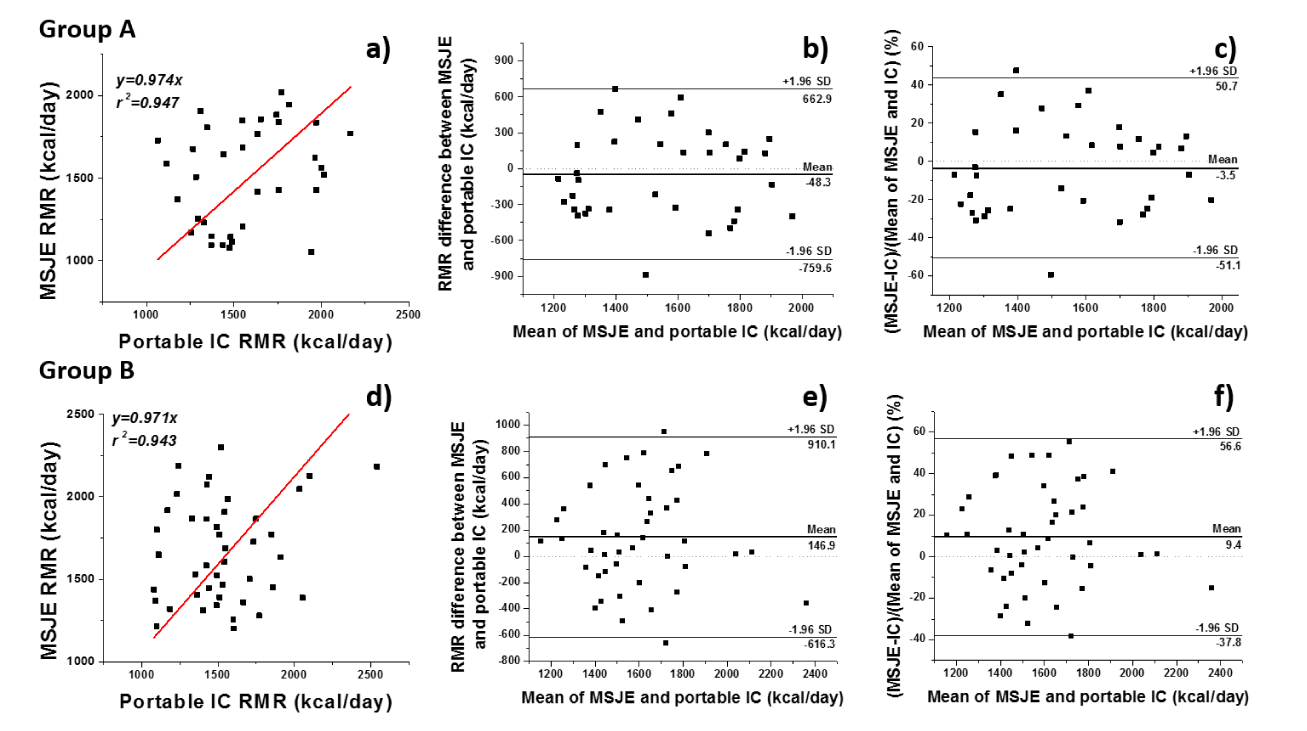
Regression analysis between RMR results from portable IC versus MSJE for Group A and B is shown in Figure. 7 a and d. For both groups, the regression coefficient (r2) reached over 0.94 and the slopes are close to1, indicating a good correlation and agreement between the two methods.
According to Bland-Altman method, the difference between two methods (MSJE – portable IC) was plotted against the mean value of two methods (Figure 7b and 7e). Figures 7c and 7f present the Bland-Altman plot in terms of percentage. Based on the CIs, it was observed that for Group A, the equality line (y=0%) is within the confidence interval of the mean difference indicating that the RMR difference between these two methods for Group A was not significant using this analysis method. For Group B, the line of equality also fell into the CI of the mean difference. In other words, there is no significant bias between the two methods. Indicating that the RMR difference between these two methods for Group B is also not significant.
For Group A, 1 out of 35 data points fell outside the agreement interval (2 out of 35 in terms of percentage), and for Group B, 2 out of 44 data points fell outside the agreement interval (1 out of 44 in terms of percentage). For both groups, over 95% of the differences are included in the agreement interval, as expected for a normally distributed data set.
From Bland-Altman plot, the difference scatters and no obvious pattern is observed, indicating no relationship between the difference and the mean value from two methods.
Discussion
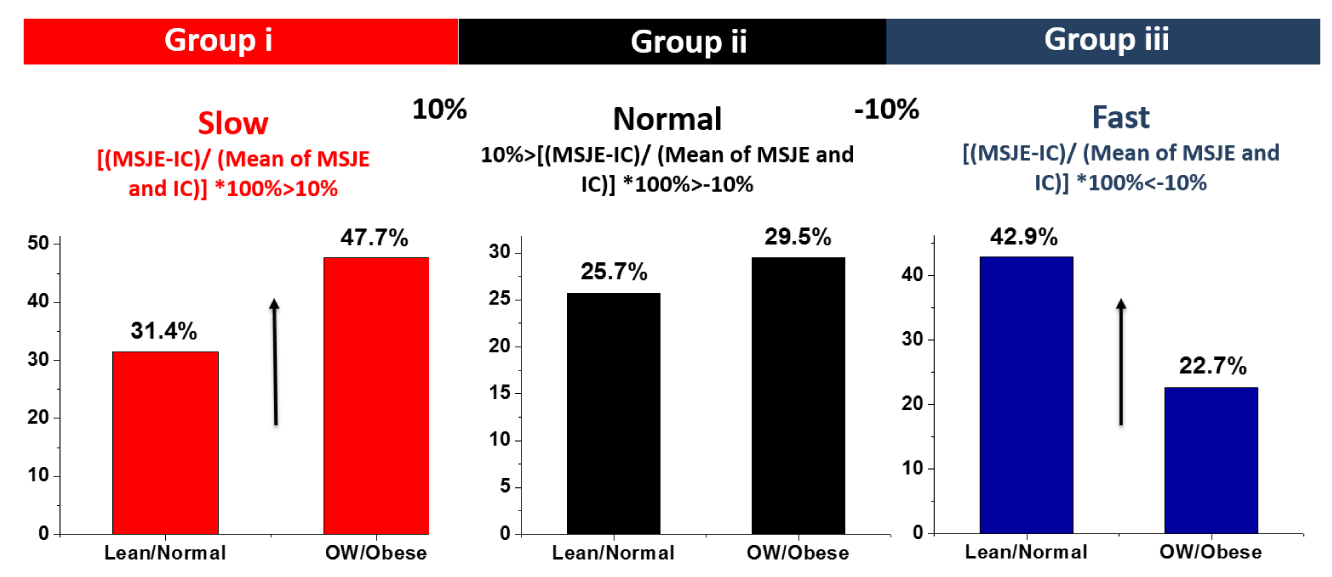
All of the analyses indicate that there is no statistical difference for RMR results from portable IC versus predictive MSJE for either the lean/normal group or the OW/Obesity group. However, individual differences (Figures 3-5) varied between these two methods from -660 kcal/day to 950 kcal/day, indicating that they could have significant clinical implications. In addition to the different contributions of fat and muscle tissues, energy expenditure can be affected by other numerous factors such as stress levels, sleep, diet, medications, physical activity, and exposure to chemical pollutants [1]. Certainly the contribution from different kinds of tissue or organ (as expressed by body composition) is an important variable [12]. For example, for a reference female with 17 kg of muscle and 19 kg of adipose tissue, 16% of her metabolic rate comes from muscle while only 6% from adipose tissue. For a reference male with 28 kg of muscle and 15 kg of adipose tissue, 22% of his metabolic rate come from his muscle mass, while the adipose tissue contributes only 4%[19]. Thus we might expect metabolic rate to be relatively lower for people with higher body fat percentage (group B). In fact, if we compare the differential percentage results from this study (Figure 4d, and Figure 5d) for subgroups defined with values higher, lower and within ± 10% (Figure 8), it is clearly seen that measured RMR values indicating slower RMR by more than 10% differential percentage are more probable to be found in Group B 47.7% (OW/Obesity) vs. 31.4% (Lean/Normal), while measured RMR values indicating faster RMR by more than 10% differential percentage are more probable to be found in Group A 42.9% (Lean/Normal) vs. 22.7% (OW/Obesity).
Similar observations have been found on some previous studies: Liu et al. [20] has observed the differences between MSJE and metabolic cart measured RMR ranges from -879 kcal/day to 664 kcal/day, which is also in the range of our observed differences. Spears et al. [21] reported similar results on overweight female population.
Therefore, as confirmed by this and other similar studies, the predictive MSJE is most useful in characterizing average values in populations. In fact, differences between the predictive value and the true value of just 200 kcal/day can lead to excess of intake that accumulated over a year period of time can produce a weight gain of 20 pounds (assuming 3500 kcal/day = 1 pound) [2]. With the development of mobile technologies, such as the portable IC used in this study, the individual’s “true” RMR value can now be more practically and accurately measured [22,23]. Performing individual measurements provides more accurate and detailed information to guide treatment and evaluate progress with weight management or other health conditions.
Conclusion
In conclusion, this study compared the RMR results from a portable indirect calorimeter with the RMR predicted using the Mifflin-St Jeor Equation for normal weight and OW/Obesity males and females. As MSJE was established from indirect calorimetry measurements using reference metabolic carts in a large population of subjects, the non-significant difference found between MSJE averages and the average measurements from the mobile IC indicate the validity of the mobile IC device. Given the easier method to assess RMR with mobile IC devices, and the observed individual differences between measured RMR and estimated RMR values, the use of the measurement should be practiced for clinical use.
The authors would like to acknowledge Dr. Sachiko St. Jeor for her support and advice in this work. The authors would also appreciate support of Entrepreneur Professor Award from Ira A Fulton Schools of Engineering, Arizona State University.
Author contributions
Deng conducted the data collection and analysis, and drafting the manuscript.
Scott contributed in providing guidance in data analysis and drafting the manuscript.
- Manore M, Meyer NL, Thompson J (2009) Sport nutrition for health and performance. Human Kinetics. Link: https://tinyurl.com/yyu2zs2x
- McArdle WD, Katch FI, Katch VL (2010) Exercise physiology: nutrition, energy, and human performance. Lippincott Williams & Wilkins. Link: https://tinyurl.com/yy6hc7qc
- Frankenfield D, Roth-Yousey L, Compher C (2005) Comparison of Predictive Equations for Resting Metabolic Rate in Healthy Nonobese and Obese Adults: A Systematic Review. J Am Diet Assoc 105: 775-789. Link: https://tinyurl.com/y3d9czl5
- Conn VS (2007) Metabolic effects of interventions to increase exercise in adults with type 2 diabetes. Diabetologia 50: 913-921. Link: https://tinyurl.com/y3dml7rk
- Friedman JM (2009) Obesity: Causes and control of excess body fat. Nature 459: 340-342. Link: https://tinyurl.com/y394av9f
- Morris RJ (1972) Lavoisier and the caloric theory. The British Journal for the History of Science 6: 1-38. Link: https://tinyurl.com/y35p8eh9
- Ferrannini E (1988) The theoretical bases of indirect calorimetry: a review. Metabolism 37: 287-301. Link: https://tinyurl.com/y2y995qt
- Weir J (1989) New methods for calculating metabolic rate with special reference to protein metabolism. 1949. Nutrition (Burbank, Los Angeles County, Calif.) 6: 213-221. Link: https://tinyurl.com/y6xnln7y
- Frankenfield DC, Rowe WA, Smith JS, Cooney RN (2003) Validation of several established equations for resting metabolic rate in obese and nonobese people. J Am Diet Assoc 103: 1152-1159. Link: https://tinyurl.com/yyoyvn6r
- Harris JA, Benedict FG (1918) A biometric study of human basal metabolism. Proc Natl Acad Sci 4: 370-373. Link: https://tinyurl.com/y3xz99dt
- Mifflin MD (1990) A new predictive equation for resting energy expenditure in healthy individuals. Am J Clin Nutr 51: 241-247. Link: https://tinyurl.com/y23kdw29
- Kinney JM (1992) Energy metabolism: Tissue determinants and cellular corollaries. Hepatology 17: 347-347. Link: https://tinyurl.com/yy8l5kqw
- Xian X, Quach A, Bridgeman D, Tsow F, Forzani E, et al. (2014) Personalized indirect calorimeter for energy expenditure (EE) measurement. Glob J Obes Diabetes Metab Syndr 2: 004-008. Link: https://tinyurl.com/yxot3mzh
- Zhao D (2014) A pocket-sized metabolic analyzer for assessment of resting energy expenditure. Clin Nutr 33: 341-347. Link: https://tinyurl.com/y3lhlp3n
- Gallagher D, Heymsfield SB, Heo M, Jebb SA, Murgatroyd PR, et al. (2000) Healthy percentage body fat ranges: an approach for developing guidelines based on body mass index. Am J Clin Nutr. 72: 694-701. Link: https://tinyurl.com/y4pjg5ok
- Heo M1, Faith MS, Pietrobelli A, Heymsfield SB (2012) Percentage of body fat cutoffs by sex, age, and race-ethnicity in the US adult population from NHANES 1999–2004. Am J Clin Nutr 95: 594-602. Link: https://tinyurl.com/y4vsnqmb
- Bland JM, Altman D (1986) Statistical methods for assessing agreement between two methods of clinical measurement. Lancet 327: 307-310. Link: https://tinyurl.com/yydtbtty
- Giavarina D (2015) Understanding bland altman analysis. Biochemia medica: Biochem Med 25: 141-151. Link: https://tinyurl.com/y47prkr3
- Snyder W (1974) Report of the task group on reference man. Pergamon Press; Oxford. Link: https://tinyurl.com/y6797m8m
- Liu NY (2018) Evaluation of a Thermal-Based Flow Meter for Assessment of Mobile Resting Metabolic Rate Measures. Journal of Sensors, 2018. Link: https://tinyurl.com/y5e6nxje
- Spears KE (2009) Hand-held indirect calorimeter offers advantages compared with prediction equations, in a group of overweight women, to determine resting energy expenditures and estimated total energy expenditures during research screening. J Am Diet Assoc 109: 836-845. Link: https://tinyurl.com/yxdwqdaj
- Stump C (2017) Study of the effect of mobile indirect calorimeter on weight management. Glob J Obes Diabetes Metab Syndr 4: 044-050. Link: https://tinyurl.com/y3adbypz
- Jackemeyer D, Forzani E, Whisner C (2017) Study of resting energy expenditure and weight changes during pregnancy. Glob J Obes Diabetes Metab Syndr 4: 16-23. Link: https://tinyurl.com/y5pvbr59
Article Alerts
Subscribe to our articles alerts and stay tuned.
 This work is licensed under a Creative Commons Attribution 4.0 International License.



 Save to Mendeley
