Global Journal of Infectious Diseases and Clinical Research
Spatial distribution of COVID-19 in Ethiopia - geospatial analysis
Kaleab Tesfaye Tegegne1*, Eleni Tesfaye Tegegne2, Mekibib Kassa Tessema3, Geleta Abera1, Berhanu Bifato1, Kebebush Gebremichael1, Alelign Tadele Abebe4, Abiyu Ayalew Assefa1, Andualem Zenebe1, Wosenyeleh Semeon Bagajjo5, Musie Rike6, Belayneh Feleke Weldeyes7 and Argaw Getachew Alemu8
2College of Medicine and Health Science, School Of Nursing, University of Gondar, Gondar, Ethiopia
3Leishmania research and Treatment Center, University Of Gondar, Gondar, Ethiopia
4Department of Medical Laboratory Technology, Hawassa College of Health Science, Hawassa, Ethiopia
5Dean of Hawassa College of Health Science, Hawassa, Ethiopia
6Research and Publication Directorate, Hawassa College of Health Science, Hawassa, Ethiopia
7Department of Mid Wifery, Hawassa College of Health Science, Hawassa, Ethiopia
8Tenta Gashena Road Project Coordinator, Ethiopia
Cite this as
Tegegne KT, Tegegne ET, Tessema MK, Abera G, Bifato B, et al. (2022) Spatial distribution of COVID-19 in Ethiopia - geospatial analysis. Glob J Infect Dis Clin Res 8(1): 001-007. DOI: 10.17352/2455-5363.000050Copyright
© 2022 Tegegne KT, et al. This is an open-access article distributed under the terms of the Creative Commons Attribution License, which permits unrestricted use, distribution, and reproduction in any medium, provided the original author and source are credited.Background: COVID-19 was the devastating worldwide public health problem in recent years. COVID19 disease affecting large populations in different continents of the world starting on 11 March 2020.
This study will be useful to give information on geographical surveillance of COVID-19 in Ethiopia, to know regions of high or low rates of COVID 19, to give evidence as baseline data for future research on COVID-19 in Ethiopia, and to predict the prevalence of COVID-19 from the untested population in different regions of Ethiopia using the art geospatial techniques.
Methods: We have used secondary data collected from March 13, 2020, to November 23/ 2021 From COVID19 – Ethiopia - Ethiopian Health Data. ArcGIS 10.3 and SaTscan software were used for spatial analysis and geographical analysis respectively.
Results: A high prevalence of COVID-19 was found in Addis Ababa (67.36%) and Oromia (13.85%).
Spatial autocorrelation analysis indicated that the spatial distribution of COVID-19 is nonrandom (Moran’s Index: 0.134297, P-value: 0.052384).
In spatial scan statistical analysis, eight clusters were identified and the higher rates of COVID-19 were observed in the Afar (RR= 1.80, p<0.001) and Addis Ababa (RR= 50.33, p<0.001) regions.
Conclusion: The spatial distribution of COVID-19 cases in Ethiopia was not random.
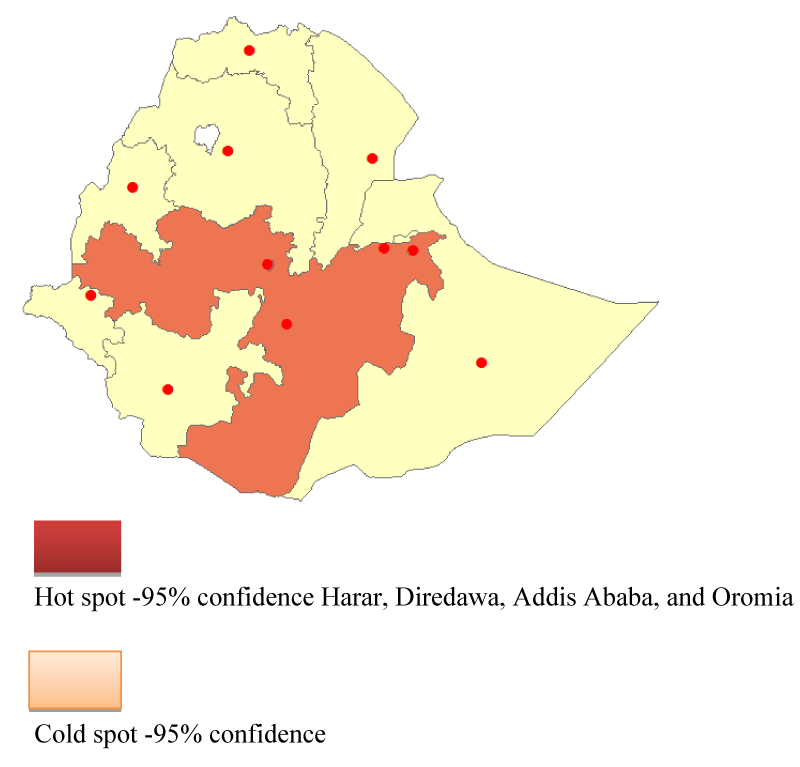
Hot spot research revealed a significant prevalence of COVID-19 patients in the Addis Ababa, Dire Dawa, Harari, and Oromia regions. For the reduction of COVID-19 infections in Ethiopia, preventative and control activities should be extended to high-risk locations.
Introduction
COVID-19 has been a devastating worldwide public health problem in recent years [1].
The World Health Organization notified COVID-19 as a disease affecting a large population in different continents of the world on March 11, 2020 [2]. There were 17.6 million COVID-19 disease cases and 680 000 deaths worldwide in August 2020 [3].
The COVID-19 disease spread through China, Europe, and the United States in the first half of 2020 before reaching the rest of the world.
Brazil was severely impacted, with 92,000 people dying as a result of COVID-19 by August 2020. Mexico and Indonesia had each recorded 47,000 and 5100 deaths by that time.
On the other hand, countries in Sub-Saharan Africa, such as Nigeria and Ethiopia, recorded 880 and 274 deaths, respectively [4].
Although the frequency of COVID-19 has dropped, the number of morbidity and mortality has continued to climb [5].
The COVID-19 index case in Ethiopia was notified in Addis Ababa on 13 March 2020, but currently, all regions of the country were affected by COVID-19 [6].
The disease burden in Ethiopia is still low; this could be due to a lack of testing and a lack of compliance in reporting confirmed cases.
Socio-demographic, mobility, behavioral, climatic, and concomitant illness were the key characteristics identified for disparities in transmission, severe illness, and death among the countries [7,8].
SARS COV2 IS transmitted from an infected person through exhalation, talking, coughing, and sneezing by aerosol transmission travel via airflow that suspended for a long time or droplet transmission through direct contact by direct deposition in short-range or contact transmission by indirect contact [9].
Individual variations in protective immunity can occur due to genetic differences.
A recent study showed robust and highly functional T cell-mediated response (even in antibodies-seronegative individuals) elicited by SARS-CoV-2, which accord long-term protection Realistically, herd immunity to SARS-CoV-2 can be achieved through vaccination instead of natural infection [10].
Thus, there is an urgent need to expand genome sequencing to better track, understand and control emerging and more transmissible SARS-COV-2 variants in various states of India [11].
Ethiopia is a big country with diverse socio-demographic features, resources, and geographic areas, resulting in variance in the risk of COVID-19 infection among Ethiopian regions.
This study will be useful for providing information on COVID-19 geographical surveillance in Ethiopia, identifying regions with significantly high or low COVID-19 rates, providing evidence as baseline data for future COVID-19 research in Ethiopia, and predicting COVID-19 prevalence from an untested population in different regions of Ethiopia using state-of-the-art geospatial techniques.
Methods
Study design, period, and setting
We have used secondary information collected from March thirteen, 2020, to November 23/ 2021 from COVID19 – Ethiopia - Ethiopian Health Data [12].
Ethiopia covers 100,000 square kilometers and is located between 3° and 15° north latitude and 33° and 48° east longitude.
Afar, Amhara, Benishangule Gumuz, Gambela, Harar Oromia, Somalia, Southern Nation Nationalities and Peoples Region (SNNPRS), and Tigray are Ethiopia’s nine regions and two administrative towns (Addis Ababa and Dire Dawa). The executive regions of Ethiopia country that’s their shapefiles were found from the info for international body areas [13].
Source and Study Population. The source population was the entire population of Ethiopia. The study population was populations tested for COVID nineteen from March thirteen, 2020, to November twenty-three/2021.
Data assortment Tools and Procedures. We were used secondary information from the Ethiopian Health Data of COVID nineteen that is public accessible [12].
The data were according from totally different regions of Ethiopia country.
Variables
Outcome variables: COVID nineteen cases.
Management of data
For spatial and geographical analysis, ArcGIS 10.3 and SaTscan software were utilized, respectively.
Analysis of geospatial data
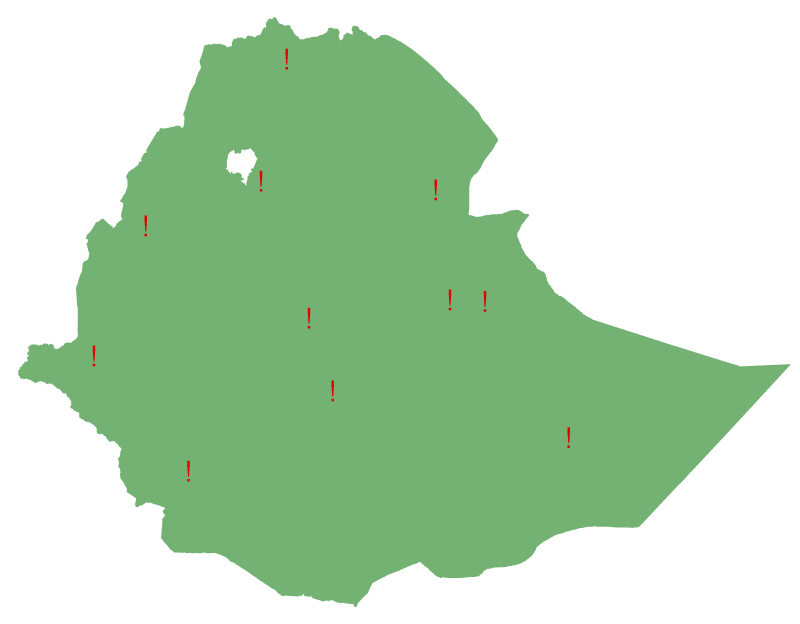
COVID 19’s spatial distribution in Ethiopia: COVID 19’s geospatial analysis includes Ethiopia’s nine regions and two administrative cities.
As seen in Figure 1, each region is represented by a point on the map with COVID-19 prevalence.
Analysis of spatial autocorrelation
We use Global Moran’s spatial autocorrelation measure to examine the COVID-19 pattern in Ethiopia [14] The “Moran’s I” statistic is spatial. that evaluates Autocorrelation in space by using a single number that ranges from -1 to +1 to represent the entire data set.
Moran’s I values are close to 1, 1, and 0, suggesting illness dispersion, clustering, and random distribution of disease, respectively. The null hypothesis (COVID-19 is randomly distributed) is rejected when Moran’s I is statistically significant (P< 0:05).
Incremental autocorrelation is a type of autocorrelation that occurs at various distances.
Z-scores for spatial autocorrelation were obtained at various distances. The intensity of spatial grouping and statistical significance is determined by Z-scores. The maximum Z-scores reflect the distances at which spatial clustering is most prominent [14].
Getis –OrdGi statistics: Hot spot analysis
With Gi Statistics for each region, Getis –OrdGi Statistics analyzes the variation of spatial autocorrelation across the regions. With P-value tests of significance, the Z-score is used to determine the statistical significance of clustering. A “hotspot” is indicated by a high Gi Statistics, whereas a “cold spot” is indicated by a low Gi Statistics.
Statistical analysis of a spatial scan
The Spatial Scan Statistical Analysis was performed using SaTScan software version 9.6 to identify locations with significantly high or low COVID 19. Using a discrete poison model, we did a purely spatial analysis and scanning for clusters with high or low rates.
Interpolation of space
Based on the tested population, the spatial interpolation analysis is utilized to forecast COVID-19 for an untested population.
To predict the untested population, we utilized ArcGIS 10.7 software and the usual Kriging spatial interpolation technique.
Result
COVID 19’s spatial distribution
COVID-19 was found to be very common in Addis Ababa (67.36 percent) and Oromia (13.85 percent) COVID-19 has a low incidence in Ethiopia’s Afar, Somalia, and Gambela areas, as seen in Table 1.
Report on spatial autocorrelation
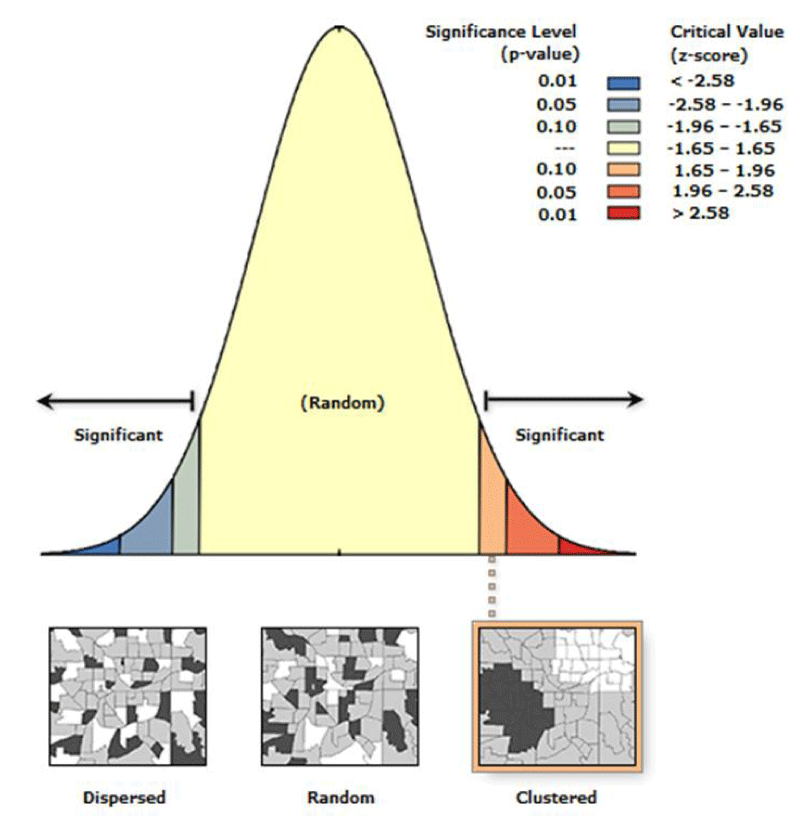
The z-score of 1.93996450728, as shown in Figure 2, indicates that there is less than a 10% possibility that this clustered pattern is the result of random chance.
Global Moran’s I 0.134297, Variance 0.014586 Expected index -0.100000, P= value: 0.05 Z-score: 1.939965.
Incremental Autocorrelation is a type of autocorrelation that occurs at various distances.
Moran’s I value was used to compute global spatial statistics to find COVID-19 spatial grouping.
At 32468.494 km distances, where spatial clustering is more prominent, a Z-score with statistical significance was achieved, as shown in Table 2. A total of ten distance bands were found using incremental spatial autocorrelation, with a starting distance of 30933700 meters. As shown in Table 2.
Getis –OrdGi statistics: Hot spot analysis
As illustrated in Figure 3, the red color indicates a higher clustering of high COVID-19 prevalence from March 13, 2020, to November 23, 2021, which was discovered in the districts of Dire Dawa, Harari, Oromia, and Addis Ababa.
Statistical analysis of a spatial scan
We have used the discrete Poisson model for purely spatial analysis.
We see that there were 313,804 total “cases” (COVID19), 11 Number of locations, Population, averaged over time, 83110000, Annual cases/100000, 376.8.
Eight Clusters were detected with purely spatial analysis and scanning for clusters with high or low rates using the discrete Poisson model.
The first cluster (Addis Ababa) is centered at 9.005401 north latitude and 38.763611 east longitude and is 0 km kilometers in diameter. It has a Gini cluster but does not overlap with other clusters.
The relative risk is 50.33 indicating that this area with an unusually high percentage of COVID 19. The P-value for the cluster is virtually zero (P-value <0.00000000000000001) – there is absolutely no way a result this extreme could occur by chance. Log-likelihood ratio= 489554.861364.
The second cluster (Somalia) is centered 6...661229 north latitude and 43.790845 east longitude and is 604.48 kilometers in diameter. It has no Gini cluster and overlaps with 5 and 7 clusters.
The relative risk is 0.25 indicate that this area with an unusually low percentage of COVID 19. The P-value for the cluster is virtually zero (P-value <0.00000000000000001) – there is absolutely no way a result this extreme could occur by chance. Log-likelihood ratio= 61260.573386.
The third cluster (Amhara) is centered at 11.663240 north latitude and 37.821903 east longitude and is 0 kilometers in diameter. It has a Gini cluster and no overlap with other clusters.
The relative risk is 0.14 indicate that this area with an unusually low percentage of COVID 19. The P-value for the cluster is virtually zero (P-value <0.00000000000000001) – there is absolutely no way a result this extreme could occur by chance. Log-likelihood ratio= 47020.207580.
The fourth cluster (SNNPRS) is centered at 6.033103 north latitude and 36.433828 east longitude and is 319.05 kilometers in diameter. It has a Gini cluster and no overlap with other clusters.
The relative risk is 0.32 indicate that this area with an unusually low percentage of COVID 19. The P-value for the cluster is virtually zero (P-value <0.00000000000000001) – there is absolutely no way a result this extreme could occur by chance. Log-likelihood ratio= 13875.237666.
The five clusters (Somalia) are centered at 6.661229 north latitude and 43.790845 east longitudes and are 0 kilometers in diameter. It has a Gini cluster and overlaps with 2 clusters.
The relative risk is 0.13 indicate that this area with an unusually low percentage of COVID 19. The P-value for the cluster is virtually zero (P-value <0.00000000000000001) – there is absolutely no way a result this extreme could occur by chance. Log-likelihood ratio= 12820.537622.
The sixth cluster (Tigray) is centered 14.032334 north latitude and 38.316573 east longitude and is 0 kilometers in diameter. It has a Gini cluster and no overlap with other clusters.
The relative risk is 0.36 indicate that this area with an unusually low percentage of COVID 19. The P-value for the cluster is virtually zero (P-value <0.00000000000000001) – there is absolutely no way a result this extreme could occur by chance. Log-likelihood ratio= 5192.000922.
The seven clusters (Afar) are centered at 11.485999 north latitude and 41.245999 east longitude and is262.69 kilometers in diameter. It has a Gini cluster and overlaps with 2 clusters.
The relative risk is 1.80 indicate that this area with an unusually high percentage of COVID 19. The P-value for the cluster is virtually zero (P-value <0.00000000000000001) – there is absolutely no way a result this extreme could occur by chance. Log-likelihood ratio= 2208.269809.
The eighth cluster (Benishangule Gumuz) is centered at 10.780289 north latitude and 35.565786 east longitude and is 0 kilometers in diameter. It has a Gini cluster and no overlap with other clusters.
The relative risk is 0.89 indicate that this area with an unusually low percentage of COVID 19. The P-value for the cluster is virtually zero (P-value < <0.00000000000000029) – there is absolutely no way a result this extreme could occur by chance. Log-likelihood ratio= 25.473135.
The output file of SaTscan software read by Google Earth software as shown in Figure 4.
COVID-19 clusters were found in the Afar and Addis Ababa regions.
Interpolation of space
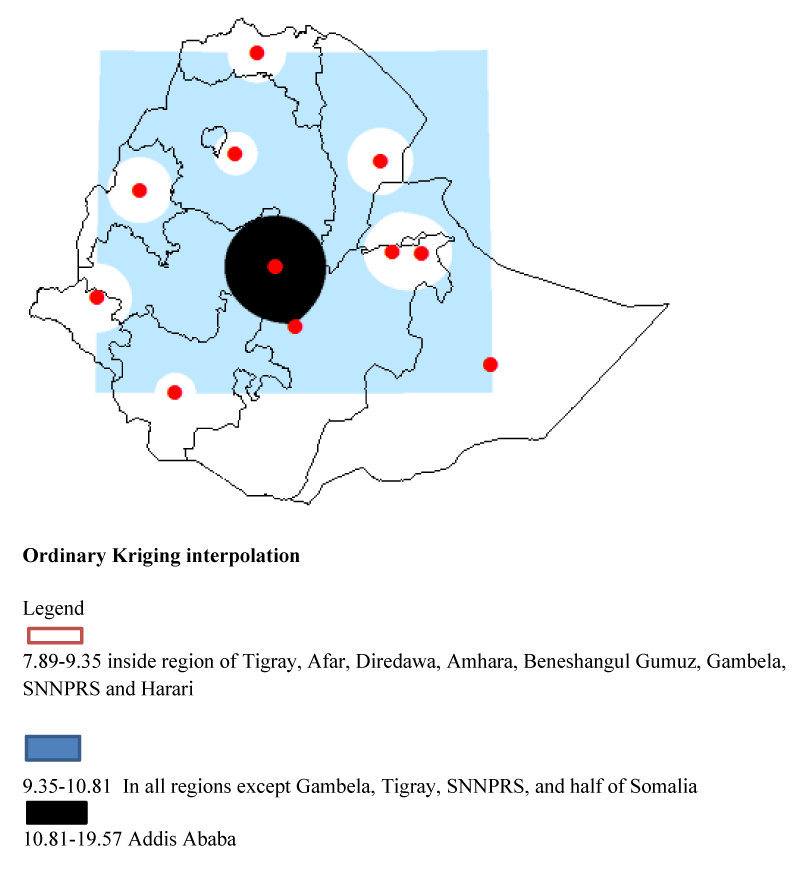
For the prediction of COVID19 prevalence in untested populations in different locations of Ethiopia, we employed standard Kriging interpolation. Based on geostatistical Kriging analysis, for all regions except Gambela, Tigray, half of Somalia, and SNNPRS the total predicted covid19 prevalence for untested populations is 9.35-10.81%, inside regions of Tigray, Afar, Dire Dawa, Amhara, Beneshangul Gumuz, Gambela, SNNPRS and Harari regions the predicted covid19 prevalence for untested populations is 7.89-9.35% and for Addis Ababa, the predicted covid19 prevalence for untested populations is highest which is 10.81-19.57% (Figure 5).
Discussion
COVID-19 was found in high concentrations in Addis Ababa (67.36 percent) and Oromia (13.85 percent). Many factors contributed to the high frequency of COVID-19 patients in Addis Ababa.
One, Addis Ababa is Ethiopia’s capital city, and it is a popular destination for international travelers.
As a result, the city is at a higher risk of contracting COVID-19 [15].
Second, Addis Ababa has a higher level of diagnostic and quarantine coverage than other Ethiopian regions, allowing for early detection of new illnesses in the metropolis [6].
Third, there was minimal understanding of COVID-19 transmission mode in Addis Ababa, with 48 percent [16] knowing it, which is higher than 95.1 percent in Southwest Ethiopia [17].
According to a prior study, poor levels of knowledge about COVID-19 and associated preventative strategies enhanced COVID-19 community transmission [18].
Fourth, preventive measures against COVID-19 were found to be less than 49 percent in Addis Ababa [16].
Other factors contributing to the higher prevalence of COVID-19 cases in Addis Ababa, Oromia, Diredawa, and some districts of Harari might include poor water supply and handwashing facilities, overcrowding, numerous social and religious rituals, and rising unemployment [19,20].
The number of cases in other locations will rise as testing and quarantine services are expanded in other areas.
According to recent research, identifying those who have been exposed to COVID-19 can significantly reduce the number of COVID-19 cases [21,22]. Testing and contact tracing initiatives in high-risk areas including Oromia, Afar, Addis Ababa, Diredawa, and Harari should be expanded.
Limitation
We used secondary data acquired between March 13, 2020 and November 23, 2021, and the results could change over time if more recent data were used and examined.
A manmade disaster that strikes the country could alter COVID-19 transmission rates in war zones.
Conclusion
The spatial distribution of COVID-19 cases in Ethiopia was not random.
Addis Ababa is home to moreover half of the COVID-19 cases.
Hot spot research revealed that Addis Ababa, Dire Dawa, Harari, and Oromia regions had a high number of COVID-19 patients.
COVID-19 clusters were found in the Afar and Addis Ababa regions, according to spatial scan statistics using a discrete poison model.
According to spatial Ordinary Kriging interpolation, the total predicted covid19 prevalence for untested populations in all regions except Gambela, half of Somalia, Tigray, and SNNPRS is 9.35-10.81 percent.
For the reduction of COVID-19 infections in Ethiopia, preventative and control activities should be extended to high-risk locations.
Declaration
Ethics approval and consent to participate: This research is based on secondary data from Ethiopia’s COVID 19, which is publically available at https://ethiopianhealthdata.org › COVID-19 Ethiopia Case Tracker Dashboard (9).
Availability of data and materials: The paper includes all data.
Contributions of the Authors: KTT was responsible for the original drafting of the manuscript’s conceptualization, analysis, supervision, and development.
Methodology, Discussion, and Data Analysis were all done by KTT, ETT, AGA, and MKT.
KTT, ETT, MKT, GA, BB, KG, AT, AAA, AZ, WSB, MR, BFW, and AGA assisted with data analysis, critically revised the work, and agreed to be held accountable.
We’d like to express our gratitude to Argaw Getachew Alemu, who assisted us in navigating the ArcGIS software application.
- Yang P, Wang X (2020) COVID-19: a new challenge for human beings. Cell Mol Immunol 17: 555-557. Link: https://go.nature.com/3tl2NHE
- Cucinotta D, Vanelli M (2020) WHO Declares COVID-19 a Pandemic. Acta Biomed 91: 157-160. Link: https://bit.ly/3C9entx
- World Health Organization (2020) Coronavirus disease 2019 (COVID-19): situation report, 51. World Health Organization. Link: https://bit.ly/3vrcmHP
- COVID-19 by country worldwide. European Center for Disease Control, 2020.
- Gilbert M, Pullano G, Pinotti F, Valdano E, Poletto C, et al. (2020) Preparedness and vulnerability of African countries against COVID-19. Lancet 395: 871-877. Link: https://bit.ly/3IvJq4Z
- Baye K (2020) COVID-19 prevention measures in Ethiopia: Current realities and prospects. Intl Food Policy Res Inst. Link: https://bit.ly/3Ma6uZw
- Ji Y (2020) Association between COVID-19 death and health-care resource availability. Lancet Glob Health 8: e480.
- Mehra MR, Desai SS, Kuy S, Henry TD, Patel AN (2020) Cardiovascular disease, drug therapy, and death in COVID-19. New Eng J Med 38: e102. Link: https://bit.ly/3stWuSU
- Priyanka, Choudhary OP, Singh I, Patra G (2020) Aerosol transmission of SARS-CoV-2: The unresolved paradox. Travel Med Infect Dis 37: 101869. Link: https://bit.ly/3vt53iT
- Priyanka, Choudhary OP, Singh I (2021) Protective immunity against COVID-19: Unravelling the evidences for humoral vs. cellular components. Travel Med Infect Dis 39: 101911. Link: https://bit.ly/3C3mZlB
- Choudhary OP, Priyanka, Singh I, Rodriguez-Morales AJ (2021) Second wave of COVID-19 in India: Dissection of the causes and lessons learnt. Travel Med Infect Dis 43: 102126. Link: https://bit.ly/3MaH0Lo
- COVID19 – Ethiopia - Ethiopian Health Data. COVID-19 Ethiopia Case Tracker Dashboard. Link: https://bit.ly/3K4nHl5
- Global Administrative Area (2012) GADM database of global administrative areas. Link: https://bit.ly/3ssPMNa
- Waldhör T (1996) Moran's Under Heteroscedasticity: The spatial autocorrelation coefficient. Stat Med 15: 887–892. Link: https://bit.ly/3IyKXHw
- Alene KA, Gelaw YA, Fetene DM, Koye DN, Melaku YA, et al. (2021) COVID-19 in Ethiopia: a geospatial analysis of vulnerability to infection, case severity and death. BMJ Open 11: e044606. Link: https://bit.ly/3plJWLB
- Defar A, Molla G, Abdella S, Tessema M, Ahmed M, et al. (2021) Knowledge, practice and associated factors towards the prevention of COVID-19 among high-risk groups. A cross-sectional study in Addis Ababa, Ethiopia. Plos One 16: e0248420. Link: https://bit.ly/35F2saz
- Kebede Y, Yitayih Y, Birhanu Z, Mekonen S, Ambelu A, et al. (2020) Knowledge, perceptions, and preventive practices towards COVID-19 early in the outbreak among Jimma university medical center visitors, Southwest Ethiopia. PLoS One 15: e0233744. Link: https://bit.ly/3IvMM8c
- Zhong BL, Luo W, Li HM, Zhang QQ, Liu XG, et al. (2020) Knowledge, attitudes, and practices towards COVID-19 among Chinese residents. Int J Biol Sci 16: 1745-1752. Link: https://bit.ly/3sEsAM9
- Carinci F (2020) Covid-19: preparedness, decentralization, and the hunt for patient zero. BMJ BMJ.m799. Link: https://bit.ly/3ssPAgT
- Trading in Economics. Unemployment Rate, 2019–2020, forecast, historical chart. Link: https://bit.ly/3vtKqDc
- Siraj A, Worku A, Berhane K, Aregawi M, Eshetu M, et al. (2020) Early estimates of COVID-19 infections in small, medium, and large population clusters. BMJ Glob Health 5: e003055. Link: https://bit.ly/3thdE5p
- Getaneh Y, Yizengaw A, Adane S, Zealiyas K, Abate Z, et al. (2020) Global Lessons and Potential Strategies in Combating COVID-19 Pandemic in Ethiopia: Systematic Review. Clin Oncol Res 3: 6-7. Link: https://bit.ly/35mD0a5
Article Alerts
Subscribe to our articles alerts and stay tuned.
 This work is licensed under a Creative Commons Attribution 4.0 International License.


 Save to Mendeley
