Global Journal of Ecology
Spatial distribution of heavy metal concentrations surrounding a cement factory and its effect on Astragalus gossypinus and wheat in Kurdistan Province, Iran
Bahram Gholinejad1*, Sardar Mehrju2, Isa Bandak3, Khaled Osati1, Farshid Ghorbani4 and Asghar Farajollahi5
2MSc, Graduate, Rangeland Management, Faculty of Natural Resources, University of Kurdistan, Sanandaj, Iran
3MSc, Graduate Student in Combat Desertification, Faculty of Natural Resources, University of Tehran, Karaj, Iran
4Associate professor, Department of Environment, Faculty of Natural Resources, University of Kurdistan, Sanandaj, Iran
5PhD, Graduate Student in Combat Desertification, Faculty of Natural Resources, Gorgan University of Agriculture and natural Resources, Gorgan, Iran
Cite this as
Gholinejad B, Mehrju S, Bandak I, Osati K, Ghorbani F, et al. (2021) Spatial distribution of heavy metal concentrations surrounding a cement factory and its effect on Astragalus gossypinus and wheat in Kurdistan Province, Iran. Glob J Ecol 6(1): 014-027. DOI: 10.17352/gje.000040The main objective of this study was to investigate the spatial variation of heavy metals concentrations released by a Kurdistan cement plant and determine the level of soil and plant contamination with lead, chromium and cadmium around the cement factory in Kurdistan province and adjacent rangeland areas. Soil and plant (Astragalus gossypinus and wheat) sampling was undertaken along eight compass directions; samples spaced 500 m apart at 4500 m intervals along each direction from a location centered on the factory. After chemical digestion of samples, the concentration of the elements was measured using atomic absorption spectroscopy. Accumulation status and spatial variation of metals assessed at different distances from the factory (source of pollution) through two soil depths (0-15 and 15-30 cm). Results showed that soil layer depth, compass directions and distance from the factory significantly affected the geo-accumulation of heavy metals in the soil. The bio-accumulation factor and translocation factor indicated that the lowest accumulation and transport rates of the pollutants in plant species are generally met, with both factors being below 1. The results also demonstrated that the highest amounts of Pb, Cr and Cd were in the surface soil (0-15 cm) at 60.86, 115.38 and 3.97 respectively, in the northerly direction. Spatial distribution of heavy metals was strongly influenced by the prevailing wind direction (from south to north). Heavy metal concentrations reported in this study are ascribed principally to the cement factory and its long years of operation and continual processing over nearly 25 years.
Introduction
Growth in urbanization and industrialization in Iran has led to economic progress and provided the opportunities for individuals to make a better and easier life. However, this growth has affected the environment negatively so that pollution in water, air and soil has been frequently reported over the last few decades. The contribution of heavy metals to environmental pollution from different processes including industrial, agricultural and mining has been the subject of much research in recent years [1]. Heavy metals such as lead, chromium, nickel, cadmium, copper and zinc are persistent and toxic when present in excessive amounts and have adverse effects on human activities and living organisms. Since heavy metals in the soil are not biodegradable, this makes them one of the most dangerous contaminants among environmental pollutants [2]. When soils act as a geochemical sink for anthropogenic heavy metals deposition, soils lose their productivity and ecological functions [3]. Metal-polluted soils expose humans and animals to health risks through their consumption of plants that have bio-accumulated contaminated metals from polluted soil [4].
Heavy metals released from industrial activities have contaminated soils in most part of the world. Also, crop production can be affected by high concentration of Lead (Pb), Chromium (Cr), Cadmium (Cd), Zinc (Zn), Copper (Cu), and Nickel (Ni) [5]. Cement production is an important source of heavy metals through emissions of particulate matter from various production processes [4]. Heavy metal pollution in soil around cement factories has been reported in a number of studies [4,6,7,8]. Reports show that soil samples in the vicinity of cement factories contain higher levels of exchangeable calcium, sodium, hydrogen, and magnesium, as well as soil organic matter, calcium oxide, sulfur oxide, Pb, Zn, and Cd compared to areas remote from these factories [9]. Along with distance, variables including the direction, soil depth, soil characteristics and biologic factors can change the concentration of heavy metals in industrialized areas [5,10,11].
The main impact of cement production on the environment is through the broadcasting of dusts and gases. Cement dust can be dispersed over a large area through wind and rainfall and then accumulate in living organisms, thereby affecting ecosystem function and services. The distribution and transfer of elements between soil and vegetation is a key issue in assessing the effect of metals in the environment [12]. Providing detailed information in terms of the mobilization, origin, extent, association, and biological availability of toxic metals at different soil depths is therefore crucial to understanding potential impacts. Heavy metals distribution and speciation were studied in soils around a mega cement factory in north-central Nigeria by Ogunkunle and Fatoba [4]. who showed that heavy metal enrichments in the soil were derived from cement production activities. A study by Egbe, et al. [9] demonstrated that the levels of Mn, Fe, Zn, Pb, Cu, and Cr were significantly higher in the samples closest to a factory compared to other locations. Similarly, El-Sherbiny, et al. [13] investigated potential ecological risk and soil contamination by heavy metals around a cement factory in western Saudi Arabia. Their results indicated that Pb has a significant role in environmental pollution in the region. In addition, they found that the potential effect of soil characteristics on the occurrence and dispersal of heavy metals in the study area is of major importance. Research by Solgi [5] on Pb and Cd around a cement factory in Iran found no spatial pattern for Pb but concluded that elevated Cd levels were attributable to factory emissions. This study was based on 24 surface soil samples at 400 m and 800 m from the factory.
The determination of metals present in soils and plants is important in monitoring environmental pollution. Although different materials such as tree rings, tree barks, lichens etc. have been used to detect deposition and assess distribution of heavy metals, soil and plant samples have been proved to be the most efficient and realistic way to detect, determine and monitor heavy metals distribution within the soil profile and their bioavailability at different depths of soil for plant growth [11].
The Kurdistan cement factory has the capacity to produce 1,029,051 tons of cement annually. This figure is likely to be associated with major emissions of heavy metals which could expose the environment and human beings to serious problems, so assessing and monitoring the distribution and amount of heavy metals is essential. The present study was conducted in 2019 in Bijar county (Kurdistan province, Iran) to investigate the spatial distribution of heavy metals concentration released from the Bijar cement factory and determine the level of soil contamination with Pb, Cr and Cd. The present study utilized contamination factors and pollution indices, and also investigated the bio-accumulation and translocation factors for two of the most common plant species growing throughout the area. In addition, this study incorporated detailed soil and plant sampling for eight geographic (compass) directions and a distance of up to 4 km from the factory for two soil depths.
Materials and methods
Study area
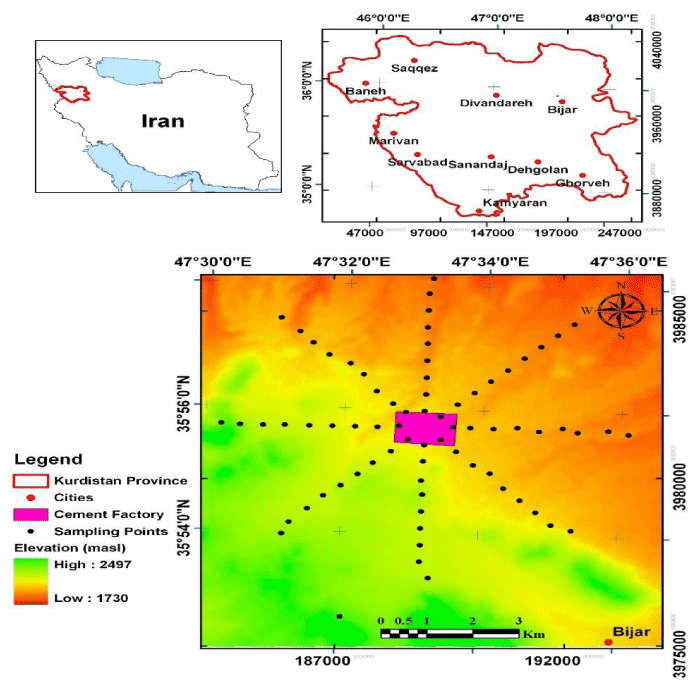
This research was conducted in 2018-19 in the area surrounding the Kurdistan Cement Factory which is located to the northwest of Bijar City (Kurdistan Province) and 5 km from the Bijar-Takab Road (Figure 1). The factory was established by the government of Iran in 1996 and was the largest industrial unit in the province. Portland pozzolan, special Portland pozzolan, and slag Portland cement are mined and produced throughout the year (Solgi, 2015). The surrounding area is given over to rainfed farmlands, which cover about 66% of the area, and rangelands which have been degraded by human activities including mining and over-grazing. The area under investigation is called Alvand Gholi (between latitude 35º 55’40.89” N and longitude 47º33’6.59” E) with a total land area of 6366 ha and a mean altitude of around 1980 m. Mean precipitation is about (419 mm/year). Minimum and maximum temperatures in the study area are –24˚C and 37˚C respectively. Under the Köppen Climate Classification, this area is classified as cold semi-arid [14]. The prevailing wind direction is from the South; average monthly wind speeds are strongest in June (93.2 m/s) and exceed 40 m/s for nine months of the year [15].
Field sampling
Samples were collected at 500 m intervals up to a distance of 4,500 m from the cement plant. Soil sampling was undertaken along each of the eight main geographical (compass) directions at two depths of 0-15 (surface) and 15-30 cm (sub-surface), with almost the same conditions for all sampling sites in terms of natural and spatial conditions. Two plant types were selected for sampling, namely Astragalus gossypinus and wheat, as representative species of the area and which covered the common and main land uses (farming and pastoralism). Plant sampling involved collecting from both below-ground (roots) and above-ground (stems, branches and leaves) parts of the nominated species. Taking into account the prevailing wind, a separate control site was located 7,760 m south of the cement plant, where 876 samples were taken: 432 soil samples, 210 wheat samples, 216 Astragalus gossypinus samples and 18 control samples.
Laboratory preparation
After washing the plant roots with distilled water in order to remove the attached fine sediment particles, specimens were dried at 75°C for 24 hours and then ground by powder grinding for later digestion. Soil samples were air dried and passed through a 2 mm sieve. Before chemical digestion of the soil and plant samples, pH, EC and soil texture were determined. The soil texture was evaluated through laser diffractometry and a pH-meter was used to measure the pH. The EC (electrical conductivity) was determined using an EC meter.
Soil analyses determined that samples were clay loams. The mean EC at the surface (0-15 cm) and sub-surface (15-30 cm) was 136.1 and 128.7 (dS/m) respectively. In the control samples, these figures were lower at 122.2 and 124.2 (dS/m) respectively. In relation to soil reaction, the measured pH at the surface and sub-surface was 8.6 and 9.7 respectively, with figures of pH 7.5 and 7.4 in the control samples. The range and mean of the measured EC and pH in soil samples at the surface and sub-surface and control are presented in Tables 1,2.
Chemical digestion of the samples
Following the laboratory preparation outlined, all samples were packed in appropriate packages and prepared to determine the concentration of the studied elements (Pb, Cr and Cd). The powdered samples of soil and plant material were treated similarly, using 1.5 g of dried (1050C) soil and 1.5 g of freeze-dried (48 hr) plant material. Samples were then digested in acid solution with a mixture of 15 ml of concentrated HCL and 5 ml of HNO3 according to the US-EPA method 3050. Soil samples were filtered and diluted to 25 ml with distilled water in 50 ml volumetric flasks. The concentrations of Pb, Cr and Cd were measured by means of a graphite furnace atomic absorption spectrometer (Phoenix-986 model, China). The concentration of Pb, Cr and Cd were extrapolated from the calibration graph prepared.
Calculating the degree of pollution
The degree of contamination in soil was determined through the Geo-accumulation index (Igeo) and the Pollution Index (PI). For the plant species, the degree of contamination was calculated using the Bio-accumulation Factor (BF) and the Translocation Factor (TF).
Geo-accumulation index (Igeo)
Igeo is used to assess the degree of anthropogenic or geogenic accumulation of the pollutant load through the comparison of current and pre-industrial levels. In this study, pre-industrial levels were represented by the control samples, and Igeo was expressed as follows:
Igeo = log2 ([HM (s)]/[1.5 x HM (b)])
where HM(s) is the measured concentration of heavy metals in the samples, HM (b) denotes the geochemical background value for the heavy metals, and the constant 1.5 allows the analysis of the natural fluctuations in the content of a given substance in the environment and detection of minor anthropogenic effects [16].
Igeo was calculated for each heavy metal and classified as follows (Table 3).
Pollution index (PI)
In the present study, PI was calculated based on the current concentrations of the evaluated heavy metals and their geochemical background by applying the following formula:
PI = Cn/Bn
Where Cn is the concentration of the analyzed element, and Bn is the geochemical background of the analyzed element. According to the results, PI<1 indicates low soil pollution with the heavy metal, 1≤PI<3 denotes average soil pollution, and PI>3 shows severe soil pollution. The classes in the pollution index are classified as follows (Table 4):
In fact, the two indicators Igeo and PI are complementary. Based on them, it is possible to make an accurate estimate of the pollution. In this research, both of them have been examined to obtain reliable and correct results. Igeo index with a correct estimate shows the ratio of pollution to before industrial activity and PI index shows the concentration of heavy metals in the soil to the background value of the same metal and indicates the amount of soil contamination with heavy elements.
Bio-accumulation factor
The Bio-accumulation Factor (BAF) was calculated by following equation given by Zhuang, et al. [17]:
BAF = P harvested tissue / P soil
Where P harvested tissue is concentration of the target ions in the plant harvested tissue (roots, stem, and leaves) and P soil is concentration of the same ions in soil.
Translocation factor
The Translocation Factor (TF) was calculated using equation (6) proposed by Ramana [18]:
TF = Pshoots / Proots
Statistical analysis
In order to compare the effects of different directions and different distances from the plant on the amount of heavy metal accumulation, a completely randomized factorial experiment was used. Spatial variations of the heavy metal concentrations were investigated along geographical (compass) directions from the cement plant (source of pollution) with the two factors of soil depth and geographical (compass) directions. Also, the concentrations of heavy metals in the plant samples (wheat and Astragalus gossypinus) were evaluated in relation to the two factors of plant tissue at two levels (root and shoot, or below- and above-ground) and geographical direction. Analysis of variance and significance of factors and their interactions were investigated. Statistical processing was conducted mainly by analysis of variance (after testing for homogeneity of variance and confirming a normal distribution). The Duncan t-test was used to compare the means and all data analyses were carried out using SPSS 23. The extent of metal pollution was calculated using the geo-accumulation index and contamination factor. Spatial mapping of heavy metal distribution was done using the Inverse Distance Weighted technique (IDW) in ArcGIS 10.
Results
Heavy metal accumulation in soils
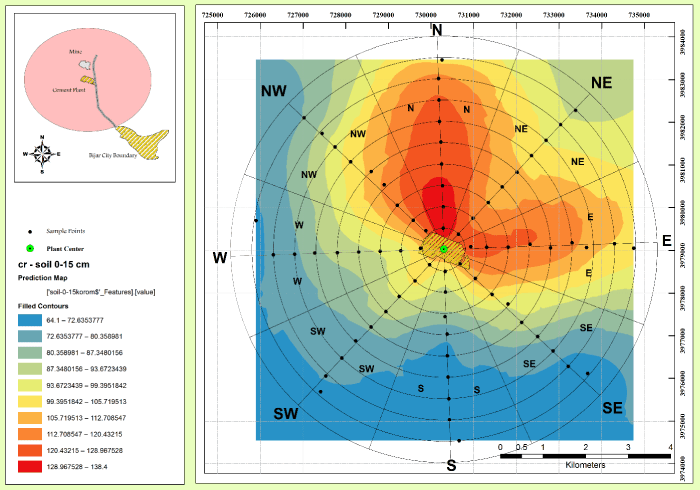
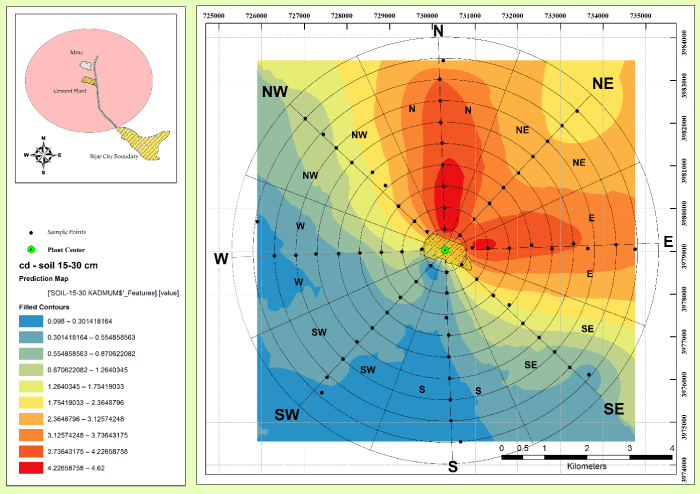
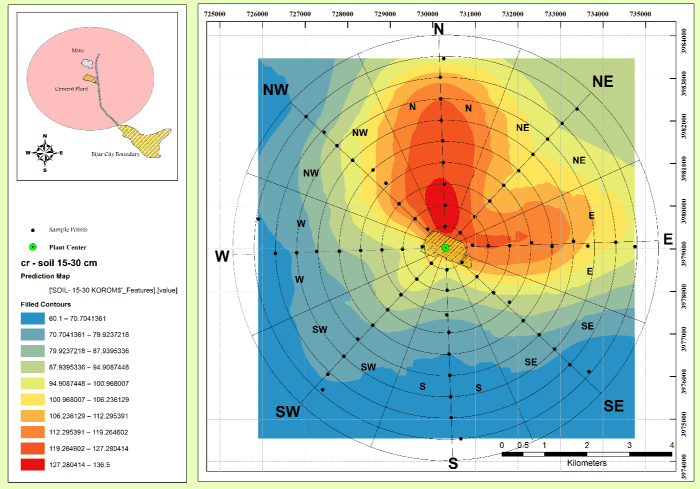
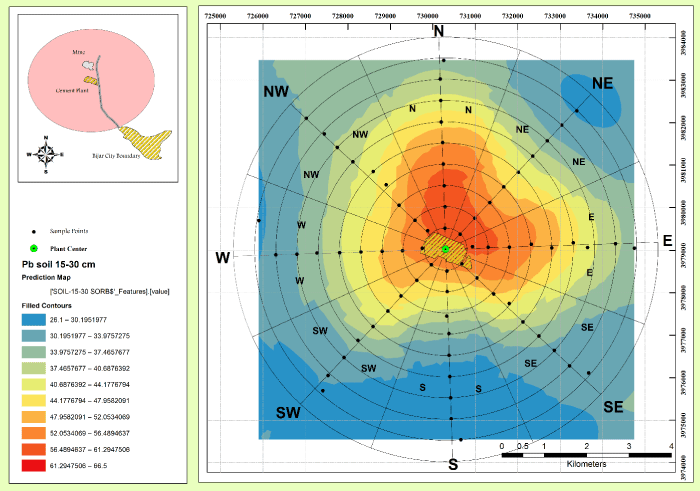
Figures 2-7 show concentrations of studied metals under the effects of soil depth and geographic directions. The range of variations and descriptive statistical analysis of the variation are given in Table 5. Geographic directions and depth affected the amount of heavy metal in soil samples and had a significant effect on Pb accumulation in soil samples (p=0.001). In relation to accumulation of Cr and Cd, only geographic directions had a significant effect. For all three studied elements, no significant interaction (Table 5) was apparent between soil depth and geographic (compass) direction.
Mean values for Pb, Cr and Cd were compared with those from the control site (Table 6). For Pb in surface soil (0-15 cm) there was a significant difference between the control site and the sampled geographic (compass) directions of north, northwest, northeast, east and southeast. At the sub-surface depth (15-30 cm) a significant difference was recorded between control and sampled sites in all geographic directions but south. Figures 2-7 show concentrations of studied heavy metals under the effects of soil depth and geographic directions. The highest heavy metal accumulation was recorded in the north, northeast, northwest and east directions, and the lowest amount of accumulation was observed in the west, south, southeast and southwest. In all geographic directions and including the control samples, surface soils had higher amounts of Pb accumulation than the sub-surface. The highest level of pollution was recorded for Cd in two sub-surface soils to the north and east of the Kurdistan factory. Unlike the results for Cd, the pollution with Pb and Cr at both soil depths and in all geographic directions is classified as moderately polluted (figures 2-7).
The difference in Cr and Cd accumulation between the control and sampled sites was significant in some directions at the two measured soil depths. However, the difference in the south, southwest and west was not significant (Table 6).
Concerning the Geo-acumulation index (Igeo), results showed the Pb and Cr values were lower than 1 in all geographic directions and both measured soil depths (Table 7), so geo-accumulation is classified as non-polluted or slightly polluted (Class 1). Pollution was marginally higher in the sub-surface (15-30 cm) than the surface soil (0-15 cm). The accumulation of Cd was less consistent: the Igeo index in the south, west and southwest at both depths was negative, thereby classifying these soils as non-polluted (Class 0) (Table 7). The geo-accumulation index was higher in the east and in the surface soil (0-15 cm), placing these samples in Class 2 (slightly polluted). In the sub-surface soil (15-30 cm), the Igeo index had higher values, giving a classification of slightly polluted to very polluted (Class 3). The surface soil in the north and the sub-surface in the southwest were also classified as slightly polluted (Class 2). Generally, the Igeo index was higher in the sub-surface than the surface soils.
Concerning the pollution index (PI), results showed that the Pb and Cr values at both soil depths and all geographic directions were between 1 and 1.76 and so were classified as moderately polluted (Table 8). Values were higher for Cd, with PI at both soil depths in the north and east being higher than 3. For this reason, these locations were classified within the high pollution group in the PI index. Cd values at the surface in the southwest, and in the sub-surface soils in the northeast and northwest, also had a PI exceeding 3 (i.e. high pollution).
Heavy metal accumulation in Astragalus gossypinus and wheat.
Accumulation values of the studied heavy metals in roots and shoots of Astragalus gossypinus are presented in Table 9. Results showed that both geographic direction and plant organs have a significant effect on the accumulation values of Pb and Cr. For Cd, plant organs were more important in affecting accumulation values than geographic (compass) direction.
As shown in Table 10, there was a significant difference in mean accumulation of Cd at the control site and Cd values from samples in the north, northeast and south. The greatest difference was between the control and the samples from the northerly direction.
In relation to wheat, results showed that both geographic direction and plant organs have a significant effect (1%) on the accumulation values of Pb, Cd and Cr. In Pb and Cr, plant organs and geographic direction had significant interaction; in Cd the interaction was between above-ground and below-ground organs (Table 11).
The results of Duncan’s multivariate test for comparing the mean values of Pb, Cr and Cd in roots and shoots of wheat and in different geographical directions showed that for roots, there was a significant difference between the mean values of Pb in the control and in all but three of the directions tested. For the majority of directions, the values of Pb were higher at sampled sites than at the control (Table 12). Also, in terms of Pb accumulation in below-ground organs, only the north and east directions were significantly higher than the control site. In the roots and shoots of wheat, Cr had a statistically significant difference from the control in all directions except to the west.
To the south, west and southwest of the factory, the mean values of Cr in wheat were higher in the control and the opposite was true in the other directions. The mean of Cd in the roots of plants from the control decreased significantly in north, east, northwest and northeast directions, and in above-ground plant organs was significantly lower than in north and southeast directions (Table 12).
The bio-accumulation and translocation index in Wheat and Astragalus gossypinus
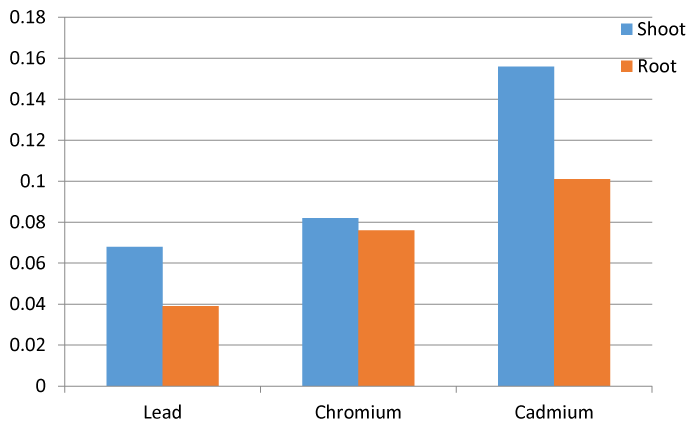
The bio-accumulation factor (BAF) for wheat resulted in a value exceeding 0.1 for both below-ground and above-ground parts of the plants only with respect to Cd (Figure 8). The values for Pb accumulation in the above-ground parts of plants were the lowest among the three studied metals at 0.039. The highest value was recorded for Cd in the below-ground organs of wheat, at 0.156.
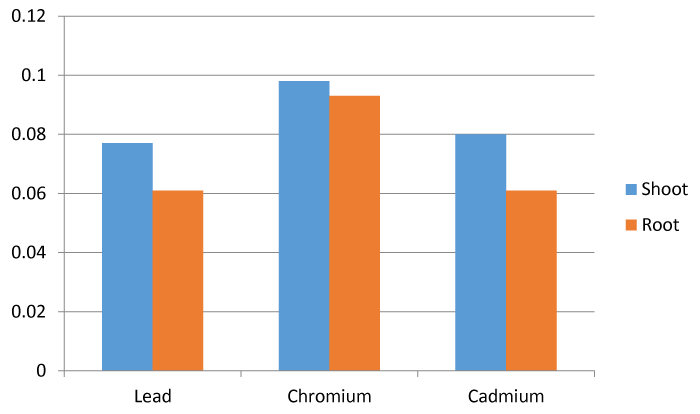
The bio-accumulation results for A. gossypinus showed that values in both below-ground and above-ground organs were lower than 0.1 for the three studied metals (Figure 9). The highest value of bio-accumulation was recorded for Cd in below-ground organs of A. gossypinus, at a value of 0.098. For both A. gossypinus and wheat the bio-accumulation factor was lower in below-ground than above-ground organs (Figures 8,9).
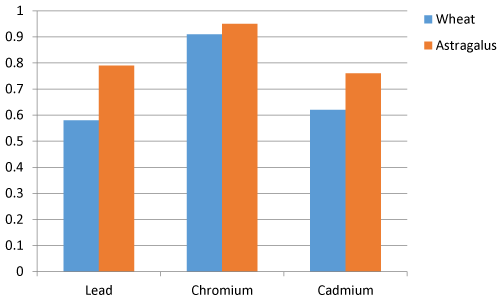
The translocation factor (TF) for Cr was higher than Pb and Cd in both A. gossypinus and wheat. However the translocation factor values for wheat were generally lower than for A. gossypinus in relation to each of the studied metals. The lowest and highest translocation factors were for Pb in wheat and Cr in A. gossypinus respectively (Figure 10).
Discussion
The amount of heavy metals in soils in the study area varied significantly depending on depth of the soil samples, distance from the factory and geographic (compass) direction. Soil reaction at the first depth (0-15 cm) ranged from pH 7.2 to 10.7 (Table 2), and pH values increased with increasing distance from the source of pollution (cement factory). In the sub-surface soil (15-30 cm) soil reaction and its variation were generally lower compared to the surface soil (0-15 cm). This pattern was also noted by Al-Khashman and Shawabkeh [19]. In contrast, soil reaction was on average much lower in the control samples, recording pH 7.5 and 7.4 at the surface (0-15 cm) and sub-surface (15-30 cm) depths respectively (Table 2). Soil pH is an important factor which affects the content of metals in bioavailable forms [5]. EC in the soil samples followed a similar pattern to pH with respect to depth change trends, although the distribution of EC variations over distance from the factory was irregular and increased with increasing distance away from the plant. Based on the results (Table 1), EC values were higher in surface soils and in the polluted samples. This pattern confirms previous reports that higher EC values are found near cement factories [5,9].
Heavy metal accumulation in soil will vary depending on factors such as soil reaction, organic matter, and gypsum and lime contents in the soil [11]. In the current study, the significantly higher contents of heavy metals in affected soil samples compared with the control was consistent with the findings of Bi, et al. [20] and Wu, et al. [21]. However, with the exception of a site near heavy vehicular traffic, Adekola, et al. [22] reported only a slight increase in surface accumulation of metals following analyses of 24 samples collected from 0, 500 and 1,000 m from a relatively new cement factory.
The highest amount of Pb accumulation around the Kurdistan cement factory occurred in the surface soils, a pattern which has also been found in Jordan [19]. Although both surface and sub-surface soils had high contamination to the north and east of the factory, soils to the northeast (surface) and northwest (sub-surface) were similarly affected (Table 6). In all geographic directions and including the control samples, surface soils had higher amounts of Pb accumulation than the sub-surface. High Pb content of surface soil which has been noted in other studies has been explained as the result of combined emissions from motor transport and deposition from a cement factory [13,23], especially where factories and major road links are co-located. In the present study, this difference in Pb accumulation in the surface compared to the sub-surface soils was significant in all geographic direction except the southwest (Table 6). With regards to Cr and Cd, the highest amount of accumulation at both depths was observed in the north, east and northeast. Although surface soils contained more Cr and Cd than sub-surface soils, this difference was not significant in any of the geographic directions (Table 6).
In some studies, higher concentrations of heavy metals in surface soils has been explained by limited mobility in soils having specific physical properties and alkaline reaction [19]. Other research has concluded that the human activity of cement production is the primary reason for nearby pollution by heavy metals [5, 24]. However, it has been claimed that significantly higher concentrations of heavy metals in the soil may not always be linked to cement factories [4]. In particular, Olade [25] attributed high levels of Cd in the soil around a cement factory to the parent rock which released Cd through weathering of ferralitic minerals [4,25].
The results of Igeo revealed that the greatest amount of pollution relative to the control site was recorded in the north, northeast and northwest. In addition, recorded pollution in the sub-surface was higher than for the surface soil. Pollution with Pb and Cr at both soil depths and in all geographic directions is placed within the class of non-polluted to slightly polluted (Figures 2-7). Results of the PI index shows that pollution with Pb and Cr is at the lower end of being classified as moderately polluted.
The highest level of pollution was recorded for Cd in two sub-surface soils to the north and east of the Kurdistan factory (Table 8). Unlike the results for Cd, the pollution with Pb and Cr at both soil depths and in all geographic directions is classified as moderately polluted (Figures 2-7). Similar pollution patterns were reported from more limited sampling conducted by Solgi [5], who found that soils around the Kurdistan cement factory had low contamination for Pb and moderate contamination by Cd. The current study showed that the pollution index decreased with increasing distance from the pollution center, an expected result which is in accordance with the findings of Al-Khashman and Shawabkeh [19].
The levels of soil pollution were not reflected in the accumulation of the three heavy metals in the plants tested in this study. As Figures 8,9 shows, the bio-accumulation factor for both wheat and Astragalus gossypinus is lower than 1 and for this reason neither is viewed as a hyper-accumulator plant. The amount of accumulation in above- and below-ground organs of the plants depends not only on the availability of nutrients in the soil and air, but also on the ability of the species to absorb and translocate any accumulation of heavy metals (Tables 9,11). Pb and Cr accumulation was higher in Astragalus gossypinus than in wheat, whereas wheat had more Cd in its organs (Figures 8,9). The higher amount of Cd in wheat may be partly attributed to the use of phosphatic fertilizer by farmers in rainfed farming. The translocation factor for each of the studied metals was higher in Astragalus gossypinus than in wheat (Figure 10).
Astragalus gossypinus is a perennial and shrub plant. In such plants, the biomass of the underground organs of plants grows more and with more cellular tissue volume, more biological storage is done in the roots. Therefore, bioaccumulation occurs in A.gossypinus at the root. In wheat, on the other hand, shoot biomass grows more than underground organisms, and bioaccumulation and accumulation of organic matter occurs more in stems and leaves. Comparing these two types of vegetative forms, it can be said that A. gossypinus is a good transmitter and accumulator for elements. This is due to the difference in the volume percentage of elements present in the soil related to the growth of A.gossypinus and wheat.
Conclusion
The highest heavy metal accumulation was recorded in the north, northeast, northwest and east directions, and the lowest amount of accumulation was observed in the west, south, southeast and southwest. This was found for both A. gossypinus and wheat (Tables 9,10). Along with increasing distance from the factory, the prevailing south-southwesterly wind direction is a dominant factor in influencing the pattern of heavy metal contamination in soil and plants around the Kurdistan cement factory. This conclusion is supported by evidence of decreasing contamination with increasing distance from the factory, the strong directional pattern of heavy metal accumulation (towards a north-northeasterly direction) and the absence of a patchy pattern of contamination which would suggest involvement of other (non-directional) variables. Heavy metal concentrations reported in this study are thus ascribed principally to the cement factory and its long years of operation and continual processing over nearly 25 years.
We thank Ms. Salavati for his effort in improving the images and also analyzing data. Also, we appreciate the University of Kurdistan which supported this research financially.
- Akoto O, Ephraim JH, Darko G (2008) Heavy metals pollution in surface soils in the vicinity of abundant railway servicing workshop in Kumasi, Ghana. Int J Environ Res 2: 359-364. Link: https://bit.ly/3qA5nqO
- Kabata-Pendias A (2010) Trace Elements in Soils and Plants. CRC Press, Boca Raton, FL 413. Link: https://bit.ly/3puuutD
- Bermudez GM, Moreno M, Invernizzi R, Plá R, Pignata ML (2010) Heavy metal pollution in topsoils near a cement plant: the role of organic matter and distance to the source to predict total and HCl-extracted heavy metal concentrations. Chemosphere 78: 375-381. Link: https://bit.ly/3k4zF2E
- Ogunkunle CO, Fatoba PO (2014) Contamination and spatial distribution of heavy metals in topsoil surrounding a mega cement factory. Atmospheric Pollution Research 5: 270-282. Link: https://bit.ly/3bnWPNc
- Solgi E (2015) An investigation on Cd and Pb concentrations of soils around the Kurdistan cement factory in Western Iran. Journal of Chemical Health Risks 5: 179-191. Link: https://bit.ly/2NFRqsV
- Ahiamadjie H, Adukpo OK, Tandoh JB, Gyampo O, Nyarku M, et al. (2011) Determination of the Elemental Contents in Soils Around Diamond Cement Factory, Aflao. Research Journal of Environmental and Earth Sciences 3: 46-50. Link: https://bit.ly/37vqrHA
- Chen TB, Zheng YM, Lei M, Huang ZC, Wu HT, et al. (2005) Assessment of heavy metal pollution in surface soils of urban parks in Beijing, China. Chemosphere 60: 542-551. Link: https://bit.ly/2NkBTPh
- Onder S, Dursun S, Gezgin S, Demirbas A (2007) Determination of Heavy Metal Pollution in Grass and Soil of City Centre Green Areas (Konya, Turkey). Polish Journal of Environmental Studies 16: 145-154. Link: https://bit.ly/3dt2xQG
- Egbe ER, Nsonwu-Anyanwu AC, Offor SJ, Opara Usoro CA, Etukudo MH (2019) Heavy metal content of the soil in the vicinity of the united cement factory in Southern Nigeria. Journal of Advances in Environmental Health Research 7: 122-130. Link: https://bit.ly/2NJaJBi
- Takáč P, Szabová T, Kozáková Ľ, Benková M (2009) Heavy metals and their bioavailability from soils in the long-term polluted Central Spiš region of SR. Plant, Soil Environment 55: 167-172. Link: https://bit.ly/37s0lFs
- Shaheen A, Iqbal J (2018) Spatial distribution and mobility assessment of carcinogenic heavy metals in soil profiles using geostatistics and random forest, boruta algorithm. Sustainability 10: 799. Link: https://bit.ly/2M2Ktl2
- Addo MA, Darko EO, Gordon C, Nyarko BJ, Gbadago JK (2012) Heavy metal concentrations in road deposited dust at Ketu-south district, Ghana. International Journal of Science and Technology 2: 28-39. Link: https://bit.ly/3pys5yf
- El-Sherbiny MM, Ismail AI, EL-Hefnawy ME (2019) A preliminary assessment of potential ecological risk and soil contamination by heavy metals around a cement factory, western Saudi Arabia. Open Chemistry 17: 671-684. Link: https://bit.ly/2Zud71B
- Iran Meteorological Organization. Weather forecast 2018. Link: https://bit.ly/3ubcA2I
- Arefi F, Moshtagh J, Moradi M (2014) The wind energy potential of Kurdistan, Iran. International Scholarly Research. Notices 2014: 323620. Link: https://bit.ly/2M4JdxX
- Muller G (1969) Index of geo-accumulation in sediments of Rhine River. Geochem J 2: 108-118. Link: https://bit.ly/3k3CtwJ
- Zhuang P, Yang QW, Wang HB, Shu WS (2007) Phytoextraction of heavy metals by eight plant species in the field. Water, Air Soil Pollution 184: 235-242. Link: https://bit.ly/3pAq84r
- Ramana S, Biswas AK, Singh AB, Ajay, Ahirwar NK, et al. (2015) Tolerance of ornamental succulent plant crown of thorns (Euphorbia milli) to chromium and its remediation. Int J Phytoremediation 17: 363-368. Link: https://bit.ly/3k3MUR0
- Al-Khashman OA, Shawabkeh RA (2006) Metals distribution in soils around the cement factory in southern Jordan. Environ Pollut 140: 387-394. Link: https://bit.ly/3avXpcI
- Bi X, Feng X, Yang Y, Qiu G, Li G, et al. (2006) Environmental contamination of heavy metals from zinc smelting areas in Hezhang County, western Guizhou, China. Environ Int 32: 883-890. Link: https://bit.ly/3s4JuAg
- Wu G, Kang H, Zhang X, Shao H, Chu L, et al. (2010) A critical review on the bio-removal of hazardous heavy metals from contaminated soils: issues, progress, eco-environmental concerns and opportunities. J Hazard Mater 174: 1-8. Link: https://bit.ly/3ubHrfr
- Adekola FA, Inyinbor AA, Raheem AA (2012) Heavy metals distribution and speciation in soils around a mega cement factory in North-central Nigeria. Ethiopian Journal Of Environmental Studies Management 5: 11-19. Link: https://bit.ly/3s8vkOx
- Hossain MA, Ali NM, Islam MS, Hossain HZ (2015) Spatial distribution and source apportionment of heavy metals in soils of Gebeng industrial city, Malaysia. Environmental Earth Sciences 73: 115-26. Link: https://bit.ly/2NhQlYc
- Mandal A, Voutchkov M (2011) Heavy metals in soils around the cement factory in Rockfort, Kingston, Jamaica. International Journal of Geosciences 2: 48-54. Link: https://bit.ly/3sb2ddg
Article Alerts
Subscribe to our articles alerts and stay tuned.
 This work is licensed under a Creative Commons Attribution 4.0 International License.



 Save to Mendeley
