Archives of Pulmonology and Respiratory Care
Utility Inspiratory Capacity by Simple Spirometry as an indirect Measure of Air Trapping
Alberto Herrejon*, Julio Palop, Susana Herrera and Alejando Betancurt
Cite this as
Herrejon A, Palop J, Herrera S, Betancurt A (2017) Utility Inspiratory Capacity by Simple Spirometry as an indirect Measure of Air Trapping. Arch Pulmonol Respir Care 3(1): 007-010. DOI: 10.17352/aprc.000016Objective: To evaluate the utility of inspiratory capacity (IC) measured by simple spirometry as an indirect measure of air trapping.
Method: Functional residual capacity (FRC) and IC were determined, respectively, by a body plethysmography and by spirometry. Air trapping was defined by a FRC higher than 120%. Spearman’s rho between IC and FRC is determined and the receiver operating characteristic (ROC curve) is calculated as predictive of air trapping for IC. The best cutoff of the overall test is calculated.
Results: 148 patients were included with a mean FEV1 60% (SD 20%). There was significant correlation between IC and FRC with a Spearman rho -0.673 (p <0.0001). The area under the ROC curve for IC and FRC was 0.803 (95% CI 0.709 to 0.897). The optimal cutoff for predicting air trapping was given for a forced IC less than 80% of its theoretical value, with a sensitivity of 82%, a specificity of 73%, a positive predictive value of 73% and a negative predictive value 82%.
Conclusion: Inspiratory capacity is useful in the assessment of air trapping and may determine a cut below 80%.
Introduction
The Spanish guide COPD (GesEPOC) [1], shall hyperinflation as a characteristic of emphysema phenotype, whereas international standards GOLD [2], air trapping considered an early phenomenon in the development of COPD. Air trapping, defined as increased residual volume (RV) with normal total lung capacity (TLC), always a shift towards higher point of respiratory rest (FRC) volumes and has important clinical consequences such as limiting the exercise, the intensity of dyspnea and the possible development of alveolar hypoventilation [3].
The determination of static volumes is not a routine measure in clinical practice because of the difficulty in implementation. However inspiratory capacity (IC) is easily performed by simple spirometry, so it has been postulated that the reduction would be an indirect measure of air trapping since any change that happens in the FRC promotes another and of opposite sign in IC, always remain unchanged TLC.
The measurement of the IC can be useful not only in static situation but also in the assessment of air trapping that occurs in patients with COPD during exercise, in which there is a progressive increase in the FRC with the consequent decrease in IC as a result of increased airflow limitation in relation to an increase in ventilatory demand.
The importance of initial and evolutionary IC evaluation of COPD during exercise and in the evaluation of bronchodilator test is increasingly evident. Of course, the IC cannot replace the FEV1, but it is a very useful piece of information in the overall assessment of COPD. The measure FEV1 and IC are not exclusive but complementary and especially in COPD with an FEV1 less than 50% or if pulmonary hypertension is suspected [4].
The main objective of this study is to check whether the measure IC, in patients with COPD, can assess the state of the FRC and thus predict the existence of air trapping, detecting at what level of deterioration of the IC already derives a FRC increased. The secondary objective is to determine the correlation of the values of IC from a slow vital capacity maneuver and identified with a forced vital capacity maneuver. All this would strengthen the clinical use of ICS in COPD, which would facilitate and generalize the approximate value of static volumes, without the need to perform a plethysmography or other more sophisticated methods.
Material and Methods
Prospective, observational study. Study COPD patients diagnosed as GesEPOC guide with a FEV1 / FVC postbroncodilatación (postBD) < 0.7 ratio. They were classified as mild degree of obstruction (FEV1 postBD ≥ 80%), moderate (≥ 50% and <80%), severe (≥ 30% and <50%) and very severe (<30%). Underwent spirometry according SEPAR recommendations [5], by means of a thermal flow meter Vmax Spectra 22 2003 Sensor Medics Corporation (Yerba Linda, California), with which the forced IC was determined. Static volumes were analyzed by body plethysmography (20 Instrument Vmax Encore 2005, Yerba Linda, California) with which the IC value in a slow maneuver was obtained. Three unforced inspiration maneuvers are performed from FRC to TLC, repeatable and acceptable, with minimal variations of values, having obtained a level of FRC stable in tidal volume.
Air trapping was considered whether the FRC was greater than 120% of its theoretical value, dismissing patients who had a TLC hyperinflation greater than 120% of its theoretical. Statistical evaluation: the results using SPSS-13 software were analyzed. Variables as mean and standard deviation or median with minimum and maximum values are described. The normality of the variables was determined with the Kolmogorov-Smirnov test. The slow and forced IC was compared using the Mann-Whitney and correlation was determined by the Spearman Rho and for the correlation between IC and FRC. To concordance between slow and labored IC test was performed Altman and Bland [6]. The predictive value of IC was determined to assess changes in FRC through the ROC curve, analyzing the area under the curve with a confidence interval of 95%. The best cutoff point was analyzed to assess the sensitivity and specificity of the test and the positive and negative predictive value.
Results
148 patients, 77% of them included men with a mean age of 64 years (SD 11 years) and a BMI of 27 kg / m2 (SD 5 kg / m2). Data on respiratory function tests are described in Table 1. There were 28 patients with mild obstruction (19%), 69 with moderate obstruction (47%), 42 had severe obstruction (28%) and 9 very severe obstruction (6 %).
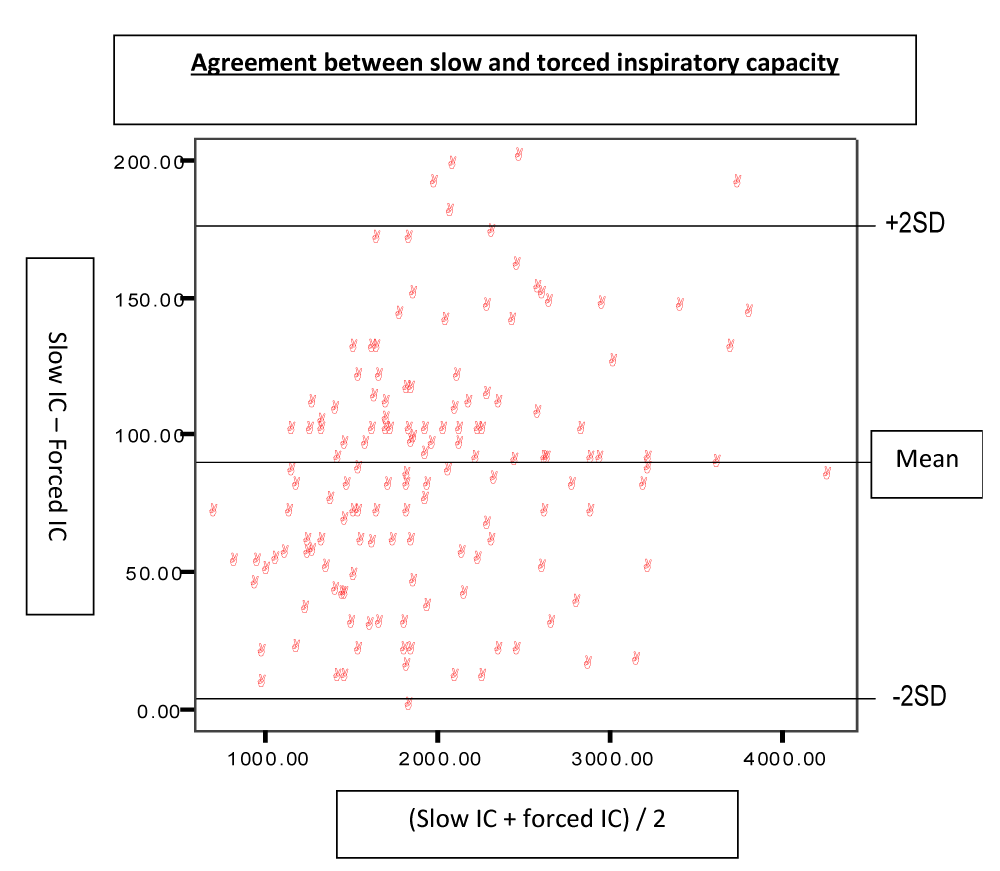
IC slow values were higher than IC forced in 65 ml, representing an average theoretical percentage of 4%. These differences were not statistically significant. There was very good correlation between the two with a Spearman rho of 0.992 (p <0.0001). To check if both determinations are similar to any level value concordance was determined according to method Altman and Bland graph shown in Figure 1. The mean difference was 84 ml with a SD of 44 ml, difference is considered clinically very relevant.
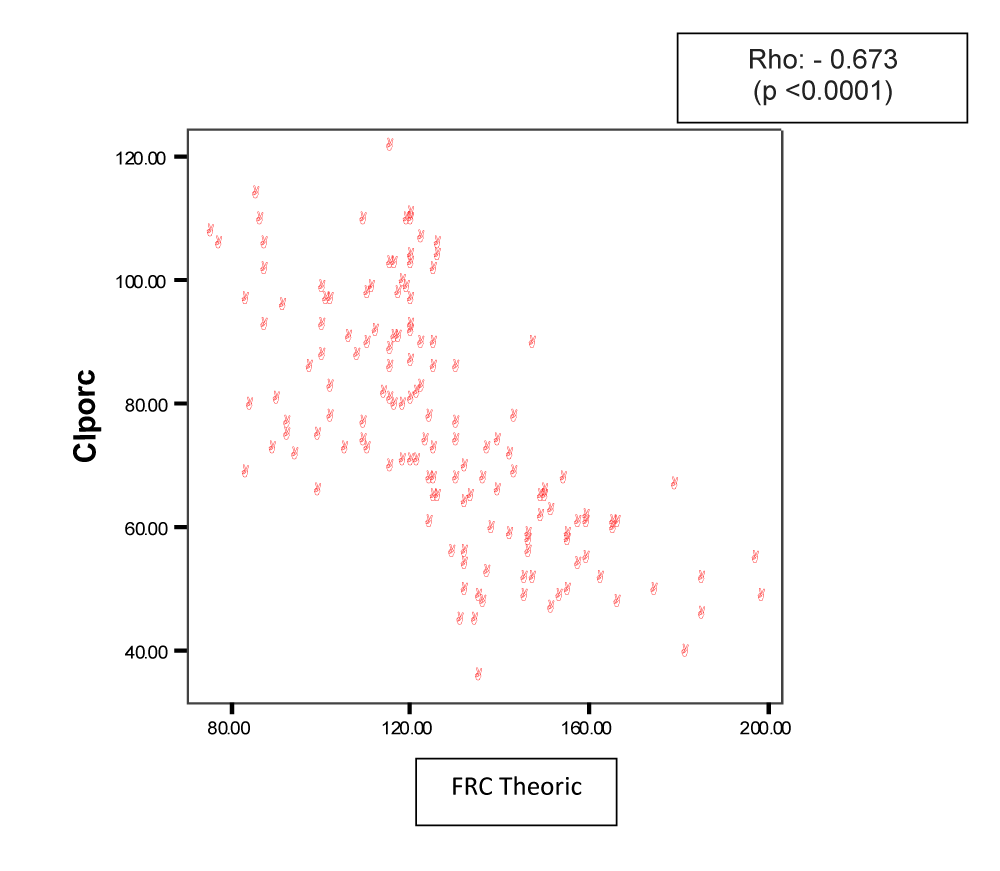
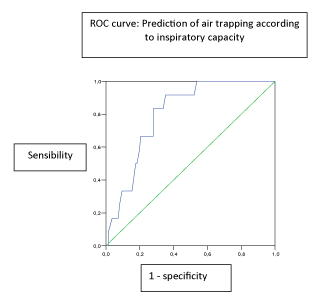
There was significant correlation between IC and FRC with a Spearman rho -0.673 (p <0.0001) Figure 2. The ROC curve for the prediction of a FRC <120% as levels forced IC shown in Figure 3. The area under the curve was 0.803 (95% CI 0.709 to 0.897). The optimal cutoff for predicting air trapping was given for a forced IC less than 80% of its theoretical value with a sensitivity of 82%, a specificity of 73%, a positive predictive value of 73% and a negative predictive value of 82 %. The value of the lower forced IC at 65% of its theoretical state has a specificity of 100% air trapping, even with a sensitivity of only 51%.
Discussion
In patients with COPD, in the absence of hyperinflation, you may be suspected the existence of air trapping by the value of the inspiratory capacity measured in a simple spirometry and can avoid the need for more complex studies. The IC value below 80% of its theoretical indicates with high probability the increase FRC and consequently the presence of air trapping. It has been proposed valuation by slow vital capacity and forced spirometry to deduce air trapping. So it has been found that in normal individuals, slow vital capacity (VC) is superior to the forced vital capacity (FVC), although differences small claims. However, in patients with obstructive respiratory disease the difference can be much higher, even above 1000 ml. The difference between VC and FVC correlates with the volume of gas intrathoracic and may reflect the existence of an expiratory collapse of the airway secondary to loss of elastic recoil caused by pulmonary emphysema.
The small existing difference between VC and FVC in healthy people broad proportion to the intensity of the obstruction in patients with obstructive pulmonary disease. Therefore, the FEV1 / FVC ratio underestimates the degree of obstruction regarding the FEV1/VC. In fact, in patients with severe obstruction, this difference can be up to 22%. Within the slow expiratory maneuver own VC is less than the inspiratory VC and this reduction is particularly evident in patients with moderate to severe obstruction. In a model predictive multiple regression hyperinflation, measured as the ratio of residual volume and total lung capacity (RV / TLC), the actual value of FEV1 and its interaction with the difference between VC and FVC were predictors of hyperinflation and explained the 52% of the variability of the same [7].
The interest in the study of IC in COPD has increased in recent years for various reasons. Has proven its close relationship with exertional dyspnea, having a significant correlation between the fall of the IC after testing the 6 minute walking (6MWT) and increased dyspnea measured by the Borg scale, suggesting the development of a dynamic lung hyperinflation, with the increase in lung volume at the end of expiration the best predictor of dyspnea [8].
Despite the close relationship between the fall of the IC and increased FRC, resulting in air trapping, this circumstance has been little studied in COPD. Previously it has been shown on one hand that the IC measured by spirometry and determined by plethysmography are practically identical in both absolute terms and as a percentage of theoric values [9], similar to that demonstrated by our study that the differences were clinically irrelevant. In our study we have shown the level of this association, determining a cutoff point IC below 65% in the coexistence of increased upper FRC 120% of its theoretical and a point of suspicion is demonstrated by below 80%, which is very likely the existence of air trapping, with acceptable sensitivity and specificity. We believe that the best cutoff point is 80%. All without a corresponding increase in the TLC above normal. When we suspect that there is hyperinflation measured as greater TLC to 120% of its theoretical value associated with air trapping, the ratio mirror between the IC and the FRC is lost so that spirometry not be enough and we would point to the performance of other examinations more complex to demonstrate the presence of hyperinflation.
A characteristic finding of the graph of the flow / volume curve in situations of air trapping is to check that the image of the expiratory part of the tidal volume remains above that shown by the expiratory limb of forced expiration, indicating us dynamic collapse of the airway. However, this situation is difficult to quantify and depends largely on the extent of the tidal volume so as not useful screening air trapping, although its existence makes us suspect.
IC / TLC ratio known as inspiratory fraction is a powerful independent predictor of mortality in COPD, with a value less than 25% the best cut. It has been found that patients with moderate to severe COPD and an IC / TLC ratio of less than 0.23 have a higher lung hyperinflation and reduced exercise capacity [10].
There are many therapeutic or diagnostic benefits of predicting the existence of air trapping in COPD because bronchodilator treatment can modify the air trapping and improved dyspnea or exercise tolerance. Air trapping predict exercise capacity decline in COPD [11], COPD hospitalisations [12], and survival in an emphysematous phenotype of chronic obstructive pulmonary disease [13].
It is concluded that the percentage of the theoretical inspiratory capacity measured by spirometry is useful in the assessment of air trapping and may determine an appropriate point of cutting suspicion. To assess hyperinflation associated spirometry should be complemented with other more sophisticated tests.
- Miravitlles M, GesEPOC (2012) Guide to Clinical Practice for the Diagnosis and Treatment of Patients with Chronic Obstructive Pulmonary Disease (COPD) - COPD Spanish Guide (GesEPOC). Arch Bronconeumol 48: 2-58.
- Vestbo J, Hurd SS, Agusti AG, Jones PW, Vogelmeier C, et al. (2013) Global Strategy for the Diagnosis, Management, and Prevention of Chronic Obstructive Pulmonary Disease. Am J Respir Crit Care Med 187: 347-365. Link: https://goo.gl/fjAdiR
- Garcia-Rio F (2005) Importance of air trapping in COPD. Arch Bronconeumol 41: 1-8.
- Casanova C, Celli B (2007) Should we consider inspiratory capacity? Arch Bronconeumol 43: 245-247. Link: https://goo.gl/qvQ5Yx
- Garcia-Rio F, M Street, Burgos F, Casan P, Field F, et al. (2013) Spirometry Bridge. Arch Bronconeumol 49: 388-401. Link: https://goo.gl/mogIIh
- Bland JM, Altman DG (1986) Statistical Methods for Assessing agreement Between two methods of clinical mesaurement. Lancet 8: 307-310. Link: https://goo.gl/sKq9GR
- Gonzalez E, J Palop, Herrejón A, Inchaurraga I, Blanquer R (2005) Difference Between The Slow Vital Capacity Forced Vital Capacity And: Predictor Of Hyperinflation In Patients With Airflow Obstruction. The Internet Journal of Pulmonary Medicine 4: 1-12.
- Marin JM, Carrizo SJ, Gascon M, Sánchez A, B Gallego, et al. (2001) Inspiratory Capacity, Dynamic Hyperinflation, Breathlessness, and Exercise Performance Turing the 6-Minute Walk Test-in Chronic Obstructive Pulmonary Disease. Am J Respir Crit Care Med 163: 1395-1399. Link: https://goo.gl/OKPilp
- Garcia J, Rodriguez JM, Ojeda E, Rodriguez P, Moran L, et al. (2012) hyperinflation in COPD. Relationship between inspiratory capacity (IC) measured in spirometry and ratios IC and IC / TLC and FRC / TLC determined plethysmography. Arch Bronconeumol 48: 103.
- Zhang Y, Sun X, Yang W, Tan X, Liu J (2013) Inspiratory Fraction is Correlated with Exercise Capacity of Patients with Moderate to Severe Stable Chronic Obstructive Pulmonary Disease. Respir Care 01927. Link: https://goo.gl/v3ps1L
- Ramon MA, Ferrer J, Gimeno-Santos E, Donaire-Gonzalez D, Rodriguez E, et al. (2016) Inspiratory capacity-to-total lung capacity ratio and dyspnoea predict exercise capacty decline in COPD. Respìrology 21: 476-482. Link: https://goo.gl/SfZdXQ
- Zaigham S, Wollmer P, Engstrom G (2015) Lung function, forced expiratory volume in 1 s decline and COPD hospitalisations over 44 years of follow-up. Eur Respir J 47: 742-750. Link: https://goo.gl/SwEHIU
- French A, Balfe D, Mirocha JM, Falk JA, Mosenifar Z (2015) The inspiratory capacity / total lung capacity ratio as a predictor of survival in an emphysematous phenotype of chronic obstructive pulmonary disease. Int J Chron Obstruct Pulmon Dis 10: 1305-1312. Link: https://goo.gl/QFtxcJ
Article Alerts
Subscribe to our articles alerts and stay tuned.
 This work is licensed under a Creative Commons Attribution 4.0 International License.


 Save to Mendeley
