Annals of Marine Science
Biomonitoring of aquatic habitat using Apodu Dam in Malete, Moro local government area of Kwara state Nigeria as a case study
Akanbi-Gada Mariam Abiola1*, Owoleke Veronica Amina2, Oluwatobi AS3 and Abdul-Majeed Oyejimi Oyeleke1
2Department of Plant Science and Biotechnology, Kogi State University, Ayingba, Nigeria
3Applied Biology and Environmental Science Unit, Department of Natural and Environmental Sciences, Faculty of Science, Crown-Hill University, Ilorin, Kwara State, Nigeria
Cite this as
Mariam Abiola AG, Amina OV, Oluwatobi AS, Oyejimi Oyeleke AM (2023) Biomonitoring of aquatic habitat using Apodu Dam in Malete, Moro local government area of Kwara state Nigeria as a case study. Ann Mar Sci 7(1): 006-013. DOI: 10.17352/ams.000031Copyright License
©2023 Mariam Abiola AG, et al. This is an open-access article distributed under the terms of the Creative Commons Attribution License, which permits unrestricted use, distribution, and reproduction in any medium, provided the original author and source are credited.Water bodies such as dams are an essential part of the ecosystems and the Apodu dam, a Local Government Area of Kwara State supplies water for the populace of Malete. The water is used for both domestic and agricultural purposes. Given the proposed rural development in the catchment area of the Apodu dam, it becomes imperative therefore to do extensive biomonitoring of the dam before the development begins so as to determine the likely source of pollution in the dam as well as determine the health of the dam. Ten samples of both water and plants were collected at different sampling points designated as A-J. The samples collected were digested and analyzed using standard techniques. Data generated from the research were subjected to T-test to determine whether there is a significant variation in the two sets of data. The parameters examined fall within the permissible level of standards set by the Federal Environmental Protection Agency (FEPA) and the World Health Organisation (WHO). Total hardness (TH) was 88.00-128.80 mg/l, pH 6.60-6.80, Total dissolved solids (TDSS) 242.00-420.00 mg/l, Electrical conductivity 102.32-103.39 µs cm, Biological Oxygen Demand (BOD) 3.47-3.53 mg/l, Chemical Oxygen Demand (COD) 104.00-168.00 mg/l and Dissolved oxygen (DO) 3.47- 3.53 mg/l. The lower concentration of DO is an indication of high water quality and this is advantageous for aquatic life as it suggests that there is less decomposition of foreign materials. In conclusion, high potential for an increasingly detrimental impact on the water quality resulting from increased anthropogenic activities especially if the proposed developments commence is imminent.
Introduction
Daily activities of man in their immediate and local surroundings are predisposing the environment to serious detrimental damages which have generated numerous concerns recently. This is a concern that is increasing in magnitude at both national and international levels. Numerous studies have been undertaken that document the degradative effects that humanity is having on the planet and its ecosystems [1]. It is therefore becoming increasingly evident that to preserve the natural environment, the impacts of anthropogenic activities must be curtailed and remediated [2].
There are two issues centered on water resources that are becoming an increasing global concern; the relative scarcity of water resources and the quality of water resources (Srebotnjak, Carr, de Sherbinin & Rickwood, 2011). These two concerns are the focal point of studies investigating future water sustainability. Sustainable development in terms of water involves not only ensuring that there is water sufficient for this generation, but that there are sufficient suitable water resources available for the environment and future generations to come [3].
Little information is available on the quality of water of Apodu dam despite its huge importance to the people of Malete. Some studies were conducted to determine the fish composition and diversity of the dam [4] with respect to water. Others include the occurrence and prevalence of parasites associated with Gnathonemus senegalensis in Apodu reservoir Malete Nigeria as documented by Oladipo, et al. 2019 [5]. To the best knowledge of the authors, this is one of the most recent types of research on Apodu dam to determine the water quality using World Health and Federal Environmental Protection standards with a view of documenting the safety or otherwise of the water even before the proposed development in the catchment area.
Furthermore, some researchers carried out the assessment of water quality in some dams and reservoirs and came up with interesting results. Koszelnik, et al. 2018 [6] opined that Ozanna, and Kaminonka, as well as Cierpsiz reservoirs of Polland, have selected physicochemical parameters safe for both domestic and drinking purposes. Nowa Wies reservoir on the other hand has values of examined physicochemical parameters above the permissible level of safe water. Others include; a water quality assessment of the Owena multipurpose dam, Southwestern part of Ondo State, Nigeria. It was observed that there was seasonal variation as well as spatial variation in the physicochemical parameters examined in the dam of Ondo State Nigeria [7]. In another research in the northern part of Kano State, Nigeria: it was observed during the assessment of the physicochemical quality of Challawa Gorge dam, Kano, and revealed that the parameters examined fall within the permissible level for domestic purposes, fishing, drinking as well as for irrigation purposes [8].
This study is aimed at determining the physical and chemical properties of the Apodu dam so as to ascertain the water quality level and hence to reliably inform the inhabitants of Malete and its environs about the safety or otherwise of the water from the Apodu dam. To achieve the aim of this research, the following objectives will be attained: the measurement of standard water quality parameters at Apodu dam; A quantitative comparison of samples obtained from the dam will be carried out to assess the extent of any water quality changes and the findings from the research will be utilized to inform suggestions for drainage management and water quality protection. The attainment of these objectives will allow a useful insight into the potential impacts on the water quality of Apodu dam in Malete. The achievement of this aim has the potential to contribute to the knowledge base regarding the impact of developments on the water quality of the Apodu dam.
Materials and methods
Study area
Apodu dam is a dam in Malete Moro Local Government of Kwara State. It lies in the coordinates of latitude 4֯ 27’41.2” E, 4֯ 27’35.4” E and 8֯ 45’25.7” N, 8֯ 45’28.6” N. The majority of the inhabitants of Malete are either farmers or fishermen. Malete community is the host of Kwara State University-Main Campus (KWASU).
Collection of plant and water samples
The collection of samples was carried out according to the method described by Ademoroti [9] with few modifications. Ten different samples were collected at different locations of Apodu dam in Malete of water and plant. The samples were collected at intervals of 10 meters interval. Water lily, which is a deep-rooted plant found attached to the substratum of the river was the representative plant sample collected and some found their way onto the river surface. Therefore, water samples were collected from/around the plant and labeled appropriately. Twenty (20) samples were collected altogether, 10 samples of water, and 10 samples of plants. The total sample points were approximately 10m apart from one another. A total number of 20 samples were analyzed.
Determination of physical and chemical characteristics of Apodu dam
Some of the characteristics determined in this study were: pH, Total Dissolved Solids (TDS), Total hardness, Electrical Conductivity, Dissolved Oxygen (DO), Chemical oxygen demand (COD), Biological/ Biochemical oxygen demand, Chloride ion, and Heavy metals.
Determination of total hardness (mg/l): The direct titration method was used in the determination of total hardness. In this process about 25ml of the water sample was buffered to pH 10 (5ml of ammoniac buffer) it was then titrated against 0.01m EDTA until the solution changed from purple to blue.
Equation of the reaction
Mg2 + NaY2- → Mg Y2- + 2Na+ (1)
Ca2 + Na2Y2- →Mg Y2- + 2Na+ (2)
The Titre value is tcm
1 mole of Ca2 = 1 mole of Na2Y2-
=40×0.0×10t mg/litre CaCO3
Calculation
Where TV= titer value.
A= molarity (mg CaCO3 equivalent to 1ml EDTA titrant)
Determination of Chemical Oxygen Demand (COD) (mg/l): The distilled water of 100 ml and 10 ml of 25% H2SO4 was added with exactly 20 ml of 0.01m KMnO4 into a 250 ml conical flask. There was a color change to purple and this was boiled in the water bath for 30 minutes. The solution was cooled before the addition of 10 ml of 10% Kl solution and a reddish wine color was obtained with the liberation of iodine. The solution was titrated against 0.05 m sodium thiosulphate using 2-3 drops of starch indicator. The result of the titer value obtained was represented as “A”. Water sample of 10ml plus 90 ml of distilled water was measured into a conical flask of 250 ml. An addition of 10 ml of 25% H2SO4, as well as 20ml of 0.01m KMnO4, was also added. This was heated for 30 minutes before cooling and 10 ml of Kl solution was added then there was the liberation of iodine this was further titrated against 0.058 m sodium thiosulphate using the starch indicator. The result of the titer value obtained was represented as “B”.
Calculation
Where A= Distilled water titre
B = Sample titre
A = Molarity.
Determination of Total Dissolved Solids (TDS) (mg/l): The TDS of the Apodu dam was measured by collecting a 250 ml water sample from the sampling locations. A Hanna Combo meter was immersed into the collected water sample and the TDS reading was recorded. This was repeated 5 times on each sampling date to allow an average to be obtained.
Determination of Dissolved Oxygen (DO) (mg/l): DO was determined by immersing an Extech Dissolved Oxygen and Temperature meter directly into the river and the measured temperature was recorded. This was repeated 5 times on each sampling date to allow an average to be obtained. DO is important as it is required by aquatic organisms for survival. Attributed to a greater presence of pollutants in the river from surface runoff. Thus, it can be seen that there is a high potential for urban environments to impact negatively the quality of a river’s water due to the introduction of pollutants from surface runoff.
Determination of pH: The pH of the Apodu dam was measured by collecting a 250 ml water sample from the sampling locations. A Hanna Combo meter was dipped into the collected water sample and the pH reading was recorded. This was repeated 5 times on each sample to allow an average to be obtained. The pH of the river is important as the flora and fauna of the dam will have an optimum pH range for survival and a pH range of tolerance.
Determination of electrical conductivity: The electrical conductivity for each water sample was measured using a digital conductivity bridge.
Determination of biological/biochemical oxygen demand (BOD) (mg/l): The procedure for BOD determination was by taking the readings of BOD for five days consecutively which was denoted as DO5 and deducting it from the initial dissolved oxygen for the first day denoted as DO i.e.
BOD in mg/l = DO – DO5 (5)
Determination of chloride Cl- percentage using mohr method: A water sample of 25 ml was measured into a conical flask and placed on a white surface. 1 ml of potassium chromate solution was added and a light-yellow solution was observed. It was then titrated against silver nitrate solution with constant stirring until the highest perceptible reddish coloration persists at the endpoint.
Equation of the reaction:
2Ag + CrO42- = Ag2Cro4 (6)
Calculation
Determination of nitrate (NO3): A water sample of 100 ml was pipetted into a beaker but constantly weighed and mercury (ii) chloride was added and stirred thoroughly. About 20 ml of the sample was taken and the sample was adjusted to between 11 and 115 with 50% NaOH. This solution was stirred for 5 minutes and then left to stand for another 5 minute so that the flocculated particles settled and then filtered. Evaporation and drying were done by pipetting exactly 2ml of the filtrated into a 50 ml evaporating dish and then 1 ml of 1% sodium salicylate solution was added and evaporated to dryness. The residue was dried in an oven at 105 oc for 30 minutes. The sample residue was removed from the oven, cooled, and then 20 ml of concentrated H2SO4 was added quickly and mixed but swirling occasionally to ensure the dissolution of all solids. When cold 15 ml of nitrate-free distilled water was added into the sample residue holding the pipette up against the dish wall to avoid spattering that can lead to loss of part of the residue. 15ml NaoH-KnaC4H4O6 was added to the solution and swirled. Yellow color developed immediately indicating the presence of nitrate. This solution was swirled again and cooled to room temperature for one hour. The blank was also prepared using distilled water and following all other procedures stated above. This blank was used to prepare the calibration curve. And absorbance was measured at 420 nm. The resulting NO3N was measured for the sample using the calibrated spectrophotometer at an absorbance of 420 nm. This process was followed for the remaining samples.
Determination of sulphate (SO42-): This was done using the gravimetric Method: 100ml of water sample was filtered and 1: 1 HCl was added in drops until acid litmus and drops were added in excess. The resulting solution was evaporated to 50 ml by boiling. Boiling BaCl2+7H2O solution was added to the sample gotten above until a precipitate was formed. The resulting solution was then digested in water until the precipitate has settled. The weight of the filter was taken as Yg. Then the digested sample was filtered. The residue was washed several times with water until the filtrate was chloride-free (using the AgNO3 test). The precipitate was dried in an oven at 60 oC – 80 oC. The weight of the precipitate and sample residue was gotten and labeled Xg. The weight of the precipitate alone is given by (Xg-Yg).
Calculation
411.5 = gravimetric factor
Collection of aquatic plant: Aquatic plants were collected from a different point of the dam with a glove, and a small knife and they were put into separate well-labeled sampling bottles. The plants collected were water lilies, duckweed, and water hyacinths. The leaves and stems of the plant collected were gently cut and taken to the laboratory for analysis.
Digestion of samples
Digestion of plant samples: The plant samples were washed thoroughly with distilled water. It was dried in an oven at a temperature of 80 oC and later pulverized to fine powder by using a stainless grinder. The ground plant samples were digested by the Aqua Regia method. One gram of each plant sample was weighed and put in a Kjeldahl flask then 30ml of concentrated nitric acid was added which was followed by 5ml concentrated HCL (hydrochloric Acid). The mixture was heated until the solution became clear. The mixture was cooled under a running tap the cooled solution was later filtered through Whatman no. 40 filtered paper and the filtrate was made up to 100ml by gradually adding distilled water and labeled appropriately. It was then taken to the laboratory for final analysis.
Determination of heavy metal content of water and plant samples: Heavy metal was analyzed from both water and samples using a water absorption spectrophotometer (AAS machine). This was done at the wavelength speed of 283.3nm/min for each of the replicates of water and plant samples. Quantification of magnesium, iron, lead, nickel, cadmium, and chromium, was done using the standard solution in the same acid matrix.
Qualitative phytochemical analysis of plant sample: The method of Banu and Cathrine, 2015 [10] was adopted. Samples of plants collected were air-dried for seven days to remove water content from the plant tissue. This was followed by grinding in a blender, about 5 grams of the sample was put in a beaker, and 50 mls of water was added and Shaked vigorously for 5-10 min and left for 24 h and the extract was filtered. The extract of 50 mg was dissolved in 5 ml of distilled water. A few drops of neutral 5% ferric chloride solution were added. A dark green color indicates the presence of a phenolic compound.
Determination of nitrates from plant sample: This was determined according to the method described by Zhao and Wang 2017 with slight modifications. About 0.1 g of the plant sample was freeze-weighed and ground into a powder with a frequency of 30 sec. 1 ml deionized water was added into the tubes and boiled f or100 oC for 30 min. The mixture was centrifuged at 15,871 x g for 10 min and about 0.2 ml supernatant was transferred into a new 12 ml tube and 0.1 deionized water was used as control. The addition of 0.4 ml salicylic and sulphuric acid was measured into each tube and the sample was mixed thoroughly and incubated for 20 min. An addition of 9.5 ml of 8% (w/v) sodium hydroxide solution was measured into each tube and allowed to cool down. OD was calculated from the value obtained. OD410 value of each sample was measured with the control for reference. Nitrate concentration (C) was calculated using.
C (µg/ml) = 140.86 x OD410 – 1.1831 (9)
Nitrate content was determined with Y = CV/W (10)
Where Y: Nitrate content µg/g
C Nitrate concentration calculated
V: Total volume of extracted sample (ml)
W: Weight of sample (g)
Data analysis: Data obtained from this study were analyzed using a t-test and the purpose of a t-test is to determine if there is a significant variation between two sets of data. In this instance, a t - test will determine if there is a significant difference between the water characteristics or results from plant samples.
Results
Total Hardness (TH) (mg/l)
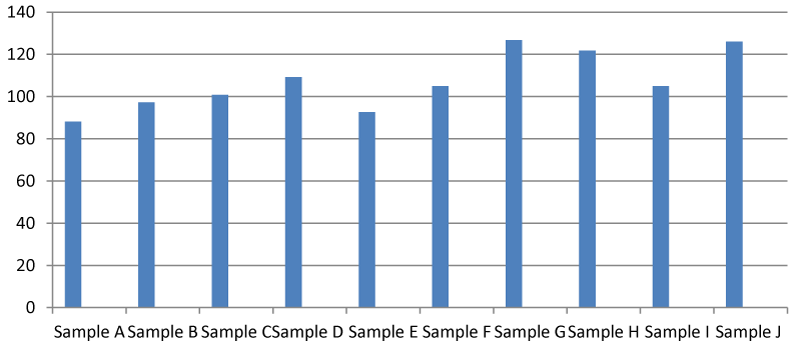
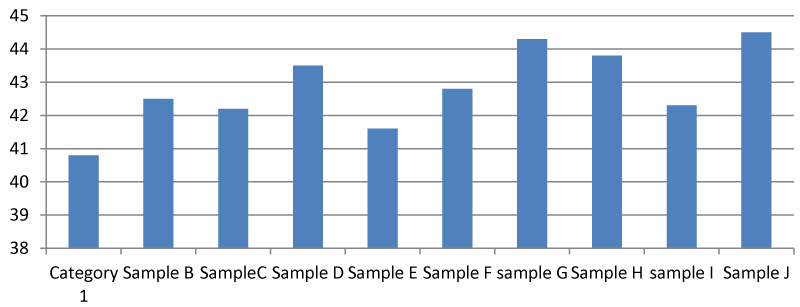
It was found that there was a significant difference between the total hardness at different points of the Apodu dam in Malete (Figure 1). The highest TH (420.00 mg/l) was recorded at sample location J while the lowest was at point A (88.00 mg/l). The observed result of total hardness is an indication of the activities going on at every sampling point of the dam. Based on this research, Apodu dam is highly hard because Lehr, et al. 1980 [11] set a standard of TH of 0-17.1 as slightly acidic, > 17.1-60 as slightly hard, 60-120 as moderately hard, 120-180 as hard and > 180 mg/l as very hard.
Result for pH
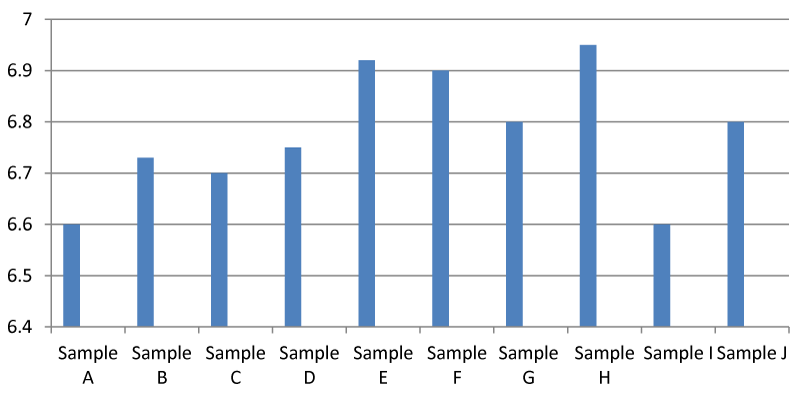
It was found that there was a significant difference between the pH of the samples in the Apodu dam. In general, the pH of sample H was higher than the other samples (Figure 2). Environmental Protection Agency guideline set 6.5-8.5 pH as safe and the observed pH in this research tends toward neutral which means it is balanced between acidic and alkaline. In addition, if pH is low, it is acidic and if it is above 7, it is alkaline.
Result for Chemical Oxygen Demand (COD) (mg/l)
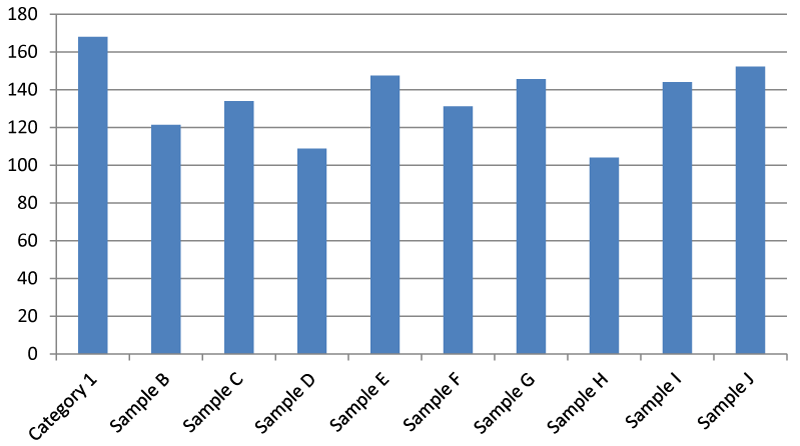
It was found that there was a significant difference between the Total dissolved oxygen of the Apodu dam. The total dissolved oxygen of sample G was higher than the other samples.
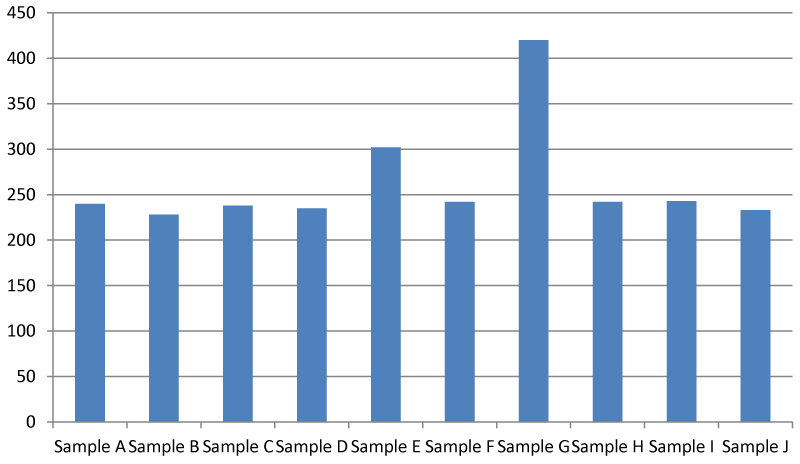
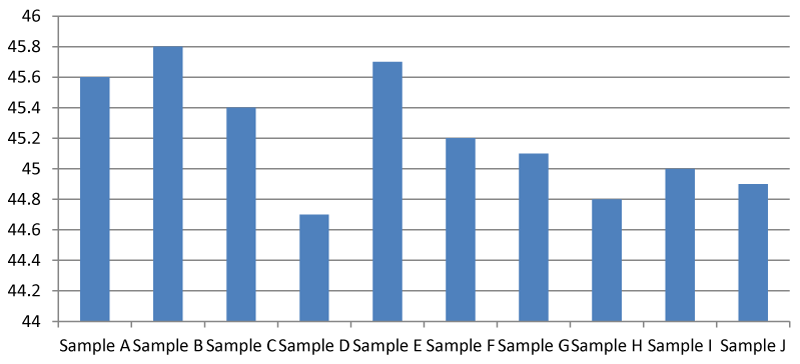
Data generated from this study shows that it is still within the safe range of 242.00-420.00 mg/l according to US Environmental Protection Agency. The recommended TDS is 500 mg/l. If it is higher than 1000 mg/l it becomes unsafe and at an extremely higher value of above 2000 mg/l, it becomes near impossible to properly employ a filtration mechanism to properly filter the contaminants in the water Figure 4.
Result for Electrical Conductivity (EC)
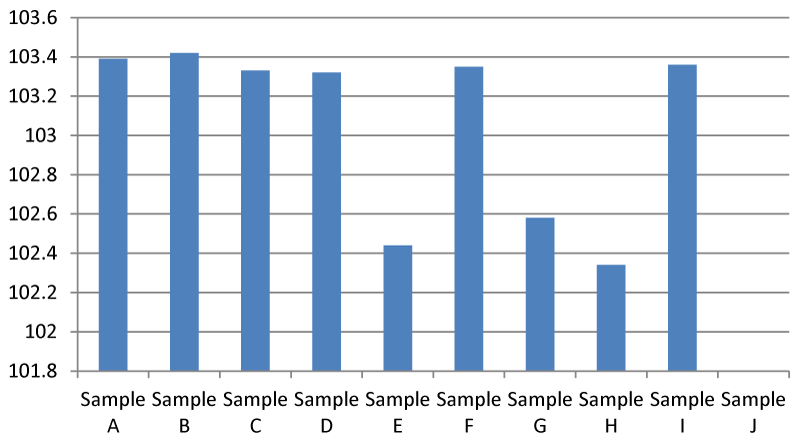
The electrical Conductivity of sample B was higher than the other samples (Figure 5). EC of 200-800 µs/cm is recommended by EPA and this conforms with this research. Any value above 2500 µs/ cm is considered unsafe. According to the Interpretation and Standard of the National Federation GroupWater Scheme in Ireland.
Result of Dissolved Oxygen (DO) (mg/l)
It was found that there was a significant difference between the Chemical oxygen demand of the Malete dam (Figure 6). The observed DO in this research is also a reflection of the activities going on in the dam. Some sampling points such as E, G and H had low DO compared to other sites.
Result for chloride ion (mg/l)
The chloride ion of sample B was higher than the other samples.
Result for biological/biochemical oxygen demand (mg/l)
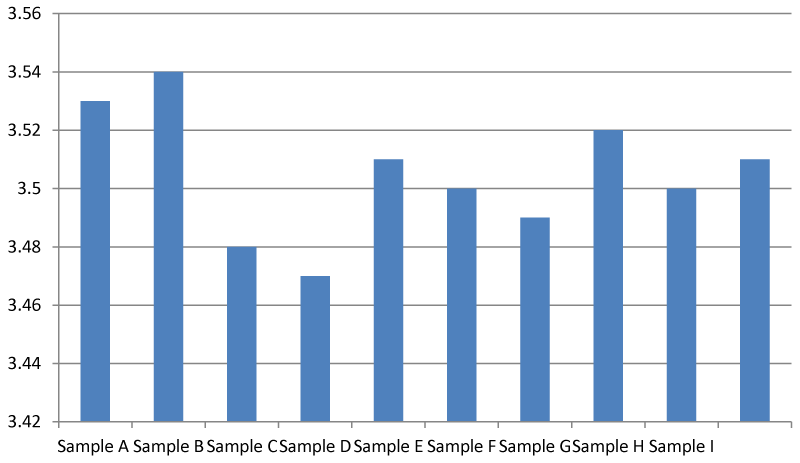
The biological oxygen demand of sample B was the highest out of all the samples. A BOD value of between 5-9 mg/l is considered safe and that is the range of values observed in this research Figure 7.
Result for nitrate ion (mg/l)
The Nitrate ion of sample G was higher than the other samples. The safe level of nitrates was recorded in this experiment as < 2 mg/l. A nitrate value of 10 mg/l is considered safe in drinking water according to US EPA Figure 8.
Result of Sulphate ion
The Sulphate ion of sample E was higher than the other samples (Figure 9). A similar trend of the varying result of sulphate ion was observed in this experiment
Results on determination of heavy metal
Heavy metal (zinc and iron of sample J) was detected, while Chromium was not detected at all in all the samples. The cadmium of samples A, D, G, H, and J was higher than the other samples Table 1.
Qualitative phytochemical analysis of samples A, C, and J was higher than the other samples. Greater details regarding the average, minimum, and maximum readings are given in Table 2.
Quantitative phytochemical analysis of plant samples
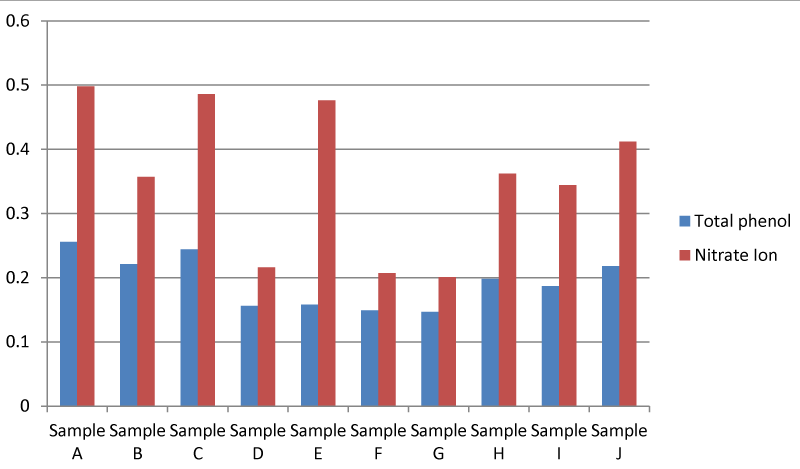
It was found that there was a significant difference between the quantitative Phyto-chemical analysis of the plant from Apodu dam. The Quantitative phytochemical analysis of the plant showed that the Total phenol in the plant sample collected at location A was higher than the other samples. It was also found that there was a significant difference between the nitrate ion in the Quantitative phytochemical analysis of the Apodu dam. Nitrate ion in plant sample A was higher than in the other samples (Figure 10).
Discussion
The findings of this study indicated that there was a significant difference in all the water characteristics which were monitored during this study. The total hardness in the water sample was within the range of 88.00-126.80 mg/l which means that the water is slightly hard because the hardness of water was set at a range of 120-170 mg/l by World Health Organisation Standard [12]. The presence of iron detected in the water sample could be an additional risk factor to the observed hardness of the water. Hardness in itself is not a problem because most times it occurs naturally. One disadvantage of the high incidence of water hardness is that it wastes soap and the water will not form a lather easily when used for washing purposes. Some authors are of the opinion that drinking hard water could actually be a good thing by its contribution to the dietary needs of an individual and hence the prevention of cardiovascular diseases [13].
The pH of Apodu dam ranged from 6.60-6.80 which means that the water is drinkable and can as well be used for other domestic purposes as posited by the World Health Organisation Standards for safe drinking water. In addition, the water can be fed to animals without detrimental effects. In addition, the pH of the water samples tends toward neutral (7.00) and it is believed that water with a pH of 7.00 is considered pure [14]. It is worthy of note that a pH of 6.60-6.80 seen in this study is slightly acidic (EPA, 2022) which is safe for drinking, and domestic purposes and safe for the inhabitants of the dam such as crabs and fish. This research contradicts that of Koszelnik et.al., 2018 [6] as reported for water in the Nowa Wies reservoir which had a pH level beyond the safety level.
Dissolve Oxygen (DO) was also examined in this research and this is an aspect of water analysis that deals with the composition of oxygen needed in water for the proper functioning or otherwise of the dam. The amount of DO recorded in this research is still within the permissible level set by WHO [15] and EPA. The DO recorded is in the range of 3.47-3.53 mg/l. The threshold level of 6.5-8.00 mg/l of DO should not be exceeded if the water is to be safe for drinking and other domestic purposes and this could also be detrimental to aquatic life because the organism will be prone to what is called a gas bubble disease [16]. This result disagrees with that of Irenosen, et al. 2012 [7] where a relatively high DO was recorded in the dam examined.
Chloride is required in minute quantity by cells for normal and natural metabolic processes in both plants and animals. So by extension, it should not exceed 250 mg/l in portable water meant for drinking and domestic purposes [17,18]. Chemical Oxygen Demand which is a measure of water quality is the quantity of dissolved oxygen that an aquatic environment such as a dam must have in order to oxidize or break down organic materials e,g bacteria. It is expected that the higher the COD the lesser will be the DO levels [19]. This scenario was observed in this research, COD (104.00-168.00) and DO (3.47-3.53) mg/l respectively.
This result contradicts that of Kaur and Verma, 2014 [20]. who worked on some physicochemical parameters of the river water of Ganga and Yamuna in Allahabad (India). The sampling site location was found to have higher concentrations of total dissolved solids (TDS), and a lower pH. The lower pH is a plus for the dam as the majority of aquatic organisms will prefer a neutral pH and thus the nearer the pH is to 7, the better the water quality [14]. Although the pH found at the sites is not exactly 7.00, it is likely to still be within the range of tolerance of the majority of aquatic species and therefore will not be significantly detrimental to the aquatic populations. The high total dissolved solids (TDS) concentrations at the Apodu dam are indicative of a greater influx of surface runoff containing pollutants. TDS can have an adverse impact on water quality as they restrict the penetration of light through the water column and can thus restrict the process of photosynthesis in aquatic plants, further contributing to a potential reduction in the DO concentration of the water [21].
Nitrate concentration was low and falls within the permissible level which means that the water does not receive a large amount of sewage or pollution and the results further agree with that of Irenosen, et al. 2012 [7] where a low incidence of nitrate was recorded. This is a good omen for the people of Malete signifying that the water is safe except in infants where it was said to cause a disease known as “blue baby syndrome”. In addition, low nitrate can increase the population of healthy fish (es) species. The National Agency for Food and Drugs Administration Council of Nigeria (NAFDAC) and Standard Organisation of Nigeria (SON) set limits of 0.002 mg/l for safe water.
The heavy metal detected from the samples includes iron, zinc, and cadmium which were detected in minute quantities while chromium was not detected at all. Even the cadmium detected is not beyond the safe threshold set by World Health Organisation for safe drinking water. Cadmium had a range of 0.001-0.002 and the threshold of 0.003 was put forth by WHO.
Conclusions and recommandations
Conclusion
It is evident from the findings of this study that the water quality of the Apodu dam is variable. It was found that the water characteristics which were measured at sampled sites indicated that the water in this location was of a relatively higher quality. It was found that Dissolve Oxygen (DO) was low at various sample sites. These findings also showed that there is also an incidence of high Total Dissolved Solids (TDS) and varied pH at the sampled sites. Although most of the physicochemical parameters are still within the permissible levels of recommendations by WHO, US EPA and NFG. It is thereby suggested that the implementation of a Sustainable rural Drainage strategy be put in place, in order to prevent further decreases in water quality of the Apodu dam due to rural surface runoff in addition to good water quality monitoring.
- Derraik JG, Slaney D. Anthropogenic environmental change, mosquito-borne diseases and human health in New Zealand. EcoHealth. 2007; 4(1): 72-81.
- Marland G, Pielke RA, Apps M, Avissar R, Betts RA, Davis KJ, Katzenberger J. The climatic impacts of land surface change and carbon management, and the implications for climate-change mitigation policy. Climate policy. 2003; 3(2): 149-157.
- Pahl-wosti C, Palmer M, Keith R. Enhancing water security for the benefit of humans and nature-the role of governance. Current Opinion in Environmental Sustainability. 2013; 5(6): 676-684.
- Oladipo SO, Mustapha MK, Anifowose AT. Fish composition and diversity assessment of Apodu Reservoir, Malete, Nigeria. International Journal of Fisheries and Aquatic Studies. 2018; 6(2):89-93.
- Oladipo SO, Sunday O, Ogunbiyi DC. Occurrence and Prevalence of Parasites associated with Gnathonemus senegalensis in Apodu reservoir, Malete, Nigeria. Journal of Biology. 2019; 4(1):14.
- Koszelnik P, Kaleta J, Bartoszek L. Assessment of water quality in dam reservoirs considering their aggressive properties. Web of Conferences. 2018; 45,000-1 35.
- Ironosen OG, Aiyesanmi AF, Akharaiyi FC. Water quality assessment of the Owena Multipurpose dam, Ondo State South Western Nigeria. Journal of Environmental Protection. 2012; 3: 14-25.
- Waziri M, Zakaria ZI, Audu AA. Assessment of the physicochemical quality of Challawa Gorge Dam Kano, Nigeria. Nigerian Journal of Chemical Research. 2015; 20:53-59.
- Ademoroti CMA. Standard methods for water and Effluents analysis, Ibadan; Foludex Press Ltd. 1996.
- Banu KS, Cathrine L. General Techniques involved in phytochemical analysis. International Journal of Advanced Research in Chemical Science (IJARS). 2015; 2(4):25-32.
- Lehr JH, Petty John WE, Gass TE. Domestic water treatment, New York. NY: McGraw-Hill Book Company. 1980.
- World Health Organisation. WHO 2018.
- Sengupta P. Potential health impacts of hard water. Int J Prev Med. 2013 Aug;4(8):866-75. PMID: 24049611; PMCID: PMC3775162.
- Baron JS, Poff NL, Angermeier PL, Dahm CN, Gleick PH, Hairston NG, Jackson RB, Johnston CA, Richter BD, Steinman AD. Meeting ecological and societal needs for freshwater. Ecological Applications. 2002; 12(5): 1247-1260.
- World Health Organisation. 1993. WHO technical report series NO 837.
- Kumar M, Puri A. A review of permissible limits of drinking water. Indian J Occup Environ Med. 2012 Jan;16(1):40-4. doi: 10.4103/0019-5278.99696. PMID: 23112507; PMCID: PMC3482709.
- U.S.E.P.A. Dissolved Oxygen and Biochemical Oxygen Demand. http://water.epa.gov/type/rei/monitoring/vms52,cfm
- World Health Organisation. WHO 2000.
- ISO. ISO6060: Water quality Determination of the Chemical Oxygen Demand. Geneva, Switzerland, International Organization of Standardization. 1989.
- Kaur D, Verma DD. Physical and microbiological study of river water of Ganga and Yamuna in Allahabad. Asian Journal of Science and Technology. 2014; 11(5): 669-673..
- Das R, Samal NR, Roy PK, Mitra D. Role of electrical conductivity as an indicator of pollution in shallow lakes. Asian Journal of Water, Environment and Pollution. 2006; 3(1): 143-146.
- Njoyim KI, Kenghi L, Tita MA, Aziwo EN. Hydrogeochemistry of surface and groundwater in Alatening village, North West region Cameroon. Applied Environmental Soil Science. 2020; 1-5. https://doi/10.1155/2020/8347095
- NFG. National Federation Group. Guide to Parameters in the European Communities. What’s in your water?. 2007.
- Hi P, Li L, Byleveld P, Leash A, Smith W. Assessment of Chemical quality of drinking water in regional New Wales, Australia. Modeling and Simulation Society. Australia and New Zealand. 2009; 4326-4332.
- (APHA). American Public Health Association, Washington DC, “Standard Methods for the examination of Water and Wastewater. 2005.

Article Alerts
Subscribe to our articles alerts and stay tuned.
 This work is licensed under a Creative Commons Attribution 4.0 International License.


 Save to Mendeley
