Annals of Environmental Science and Toxicology
Qualitative Evaluation of Surface Water Resources Using Iran Water Quality Index (IRWQSC) and National Sanitation Foundation Water Quality Index (Case Study: Kardeh Dam, Mashhad, Iran)
Mohammad Mahdi Shahsavar1, Mahdi Najafzadeh2, Mehran Akrami3, Zahra Kian4 and Mohammad Gheibi3*
2Department of Civil Engineering, University of Shiraz, Shiraz, Iran
3Department of Civil Engineering, Ferdowsi University of Mashhad, Iran
4Department of Chemical Engineering, Amirkabir University of Technology, Tehran, Iran
Cite this as
Shahsavar MM, Najafzadeh M, Akrami M, Kian Z, Gheibi M (2021) Qualitative Evaluation of Surface Water Resources Using Iran Water Quality Index (IRWQSC) and National Sanitation Foundation Water Quality Index (Case Study: Kardeh Dam, Mashhad, Iran). Ann Environ Sci Toxicol 5(1): 030-037. DOI: 10.17352/aest.000034The quality of water resources is one of the main subjects in ensuring public health. Therefore, monitoring water resources, especially surface waters, is one of the leading water operational management systems’ requirements. Since the quality of surface waters is affected by natural factors and pollutants from human activity, monitoring water resources’ quality leads to collecting and extracting valuable data, which needs a suitable method for interpretation and analysis. Therefore, this research assessing the annual quality of Kardeh Dam (One of the surface water sources of Mashhad) based on IRWQISC and NSFWQI qualitative index. The results showed that the Kardeh Dam quality index in spring, summer, autumn, and winter is 55.43, 49.25, 57.61, and 60.9, respectively, indicating relatively good, average, relatively good, and relatively good quality conditions, respectively. Also, according to NSFWQI analysis, the quality index was calculated for spring, summer, autumn, and winter, respectively equal to 86.4 (good), 81.28 (good), 84.48 (good), and 96.64 (excellent). Comparisons showed that IRWQISC was more rigorous than NSFWQI in judging the water quality of the Kardeh Dam. Comparisons indicate that the dam’s water quality judgment with the IRWQISC model is far more stringent than the NSFWQI model.
Introduction
Today, the water crisis is one of the major challenges in developed and especially developing countries [1]. Although water is one of the most abundant compounds in nature, only a small part of water resources, including surface and groundwater, can be exploited by humans [2-5]. FAO1 forecasts show; by 2025, about 1.9 billion people worldwide will face severe water shortages, and two-thirds of the world›s population will be under water stress [6]. In recent decades, population growth, urbanization, and industrial development have polluted water resources [7,8]. Decreased urban water quality leads to epidemics of many diseases and has many acute (short-term) and chronic (long-term) effects. Therefore, due to the urgent need to use available water resources, it is necessary to pay attention to their protection against pollution [9,10]. Protection and optimal use of water resources are among the principles of sustainable development in any country [11]. Therefore, it is important to study surface and groundwater quality to provide water with appropriate quality for various uses [12]. One efficient method without complex mathematical and statistical equations to determine water quality is water quality indicators presented on a numerical scale. In this method, the calculated number is categorized with a relative scale that indicates water quality from very bad to excellent [13-15]. IRWQISC2 quality index is one of the most widely used indigenous criteria for surface water quality zoning. Due to the simplicity and availability of the required quality characteristics, it is a very useful and efficient tool for researchers. This index is determined based on fecal coliform parameters, BOD5, COD, turbidity, total hardness, electrical conductivity, dissolved oxygen, nitrate, ammonium, phosphate, and pH.
Extensive research has been conducted in Iran and different countries to determine the quality of surface and groundwater using various indicators. various quality indicators such as 3NSFWQI [16], 4BCWQI [17], BMWP5 [18], 6HFBI [19], ASPT7 [20], EPT8 [21], and Shannon-Vince [22] are used in the world. Sarvai, et al. (2014) evaluated the water quality of the Tajan River based on Hilsenhoff biological parameters, Shannon-Wiener diversity, and environmental indicators. Most of the benthic invertebrates identified in this study belonged to 31 families, 12 orders, and 5 categories. The lowest and highest frequencies in all studied stations belonged to the family Psychodidae and Chironomidae, respectively [23]. Kurdi, et al. (2014), in a study, evaluated the quality of groundwater in the northwestern part of Kaboudar Ahang to measure hydrogeochemical parameters. To evaluate groundwater resources’ quality in this area, the parameters of electrical conductivity, calcium, chloride, magnesium, sodium, sulfate, bicarbonate, TDS, and SAR obtained from chemical analysis of groundwater were used. Analysis of 18 water samples’ chemical quality data from the distribution network of selected villages in the study area in two periods (November 1987 and August 1988) was performed using Schuler, Piper, Will Cox, Douro diagrams, and hydrogeochemical maps [24]. In another study by Vadiati, et al. (2016) evaluated groundwater quality for agriculture using a fuzzy inference model. In this study, the values of irrigation indices, including sodium uptake ratio, permeability index, total ratio, magnesium uptake ratio, residual sodium bicarbonate, sodium dissolution, and electrical conductivity, were measured as representative of all water-soluble salts. Using the fuzzy quality model, groundwater quality was divided into three categories: desirable, acceptable, and unacceptable [25]. In another study by Hao, et al. (2016) heavy metal pollution in rivers in Bangladesh was examined. In this study, the concentrations of heavy metals chromium, nickel, lead, arsenic, and cadmium in the river and its sediments were measured and studied [26]. Smithy, et al. (2016) studied the quality of surface water resources using multivariate statistical analysis. In this study, samples were taken from Yliki Lake over five years and analyzed to measure 16 physical and chemical parameters [27].
The present study intends to investigate the water quality of Kardeh Dam using IRWQISC and NSFWQI indices with the help of laboratory measurements and the calculation of quality parameters of Kardeh Dam. In addition to analyzing the quality conditions of Kardeh Dam in all four seasons of the year, the dam’s water quality was compared in terms of Iranian standards (IRWQISC) and the United States (NSFWQI).
Materials and methods
Site description
This study was carried out on the water of Kardeh Dam, located 40 km northeast of Mashhad (36°38’N, 59°40’E). Mashhad water treatment plant number one feeds from this dam and, after performing the necessary treatment, water is injected into the water supply network and provides to the subscribers (Figure 1). It is worth noting that the Kardeh dam is not supplied by urban or industrial treated wastewater. The mentioned dam is nearby the mountain and it fed by pure precipitated water flow.
IRWQISC quality index
For determining surface water quality according to IRWQISC and NSFWQI standards, fecal coliform parameters, BOD5, nitrate, dissolved oxygen, electrical conductivity, COD, ammonium, phosphate, turbidity, temperature, total solids, total hardness, and pH were measured according to standard methods in time intervals which were on the 15th of May, August, November, and February (the middle day of each season) in 2015 from the diversion section of Kardeh Dam. However, each of these parameters has different weights in IRWQISC, shown in Table 1. [28].
Weighing and mathematical analysis of water quality status of Kardeh Dam was performed based on the scoring-weighting indicators in the IRWQISC model according to Equation 1.
(1)
In the above relation, the parameters Wi, n, and Ii express the i-th parameter›s weight, the number of parameters, and the index value for the i-th parameter of the ranking curve, respectively. It should be noted that finally, the guide in Table 2. is used to describe the quality of the weights determined using the IRWQISC model.
NSFWQI quality index
The NSFWQI Index was introduced in 1970 by the American Institutes of Health to monitor water resources quality. This index has nine main parameters, including fecal coliforms, BOD5, nitrate, dissolved oxygen, electrical conductivity, water temperature, phosphate, turbidity, total solids (TS), and pH. In this standard, each of the mentioned factors has a unique degree of importance, summarized in Table 3 [16].
Then, the value of NSFWQI for each chapter was calculated according to Equation 2, and the related quality was evaluated based on the classification in Table 4.
(2)
In the above relation, the Qi and Wi parameters represent the equivalence value of the i-th parameter in the NSFWQI standard and the weight ratio of the i-th parameter, respectively.
Methods of measuring parameters
In this study, to determine BOD5 of Kardeh Dam water, a water sample was aerated in 300 ml BOD glass bottles at 20 ° C. Immediately dissolved oxygen in one of the glass containers measured, and Other containers were incubated for five days. Finally, Equation 3 was used to calculate the BOD5 value. In this regard, D1 is the initial dissolved oxygen, D2 is the final dissolved oxygen, and P is the ratio of sample volume to total combined volume [29].
(3)
On the other hand, a potent oxidizing agent (potassium dichromate) and DR39000 spectrophotometer system were used to measure the COD parameter [30]. Also, fecal coliforms were determined by the Multiple-tube fermentation (possible MPN method) [31]. In this study, the spectrophotometric method was used to measure nitrate, phosphate, and ammonia [32]. UV-Visible DR39000 spectrophotometer was used to measure nitrate, and Agilent8453 was used to determine phosphate. The pH was determined using the pH Meter Metrohm 827. The HM Digital device calculated the total hardness. The electrical conductivity was measured using the Conductometer WTW 3110, and the turbidity was determined by the Hach 2100N. Moreover, a DO meter device along with polarographic probe MA840 was used to determine DO.
Results and discussion
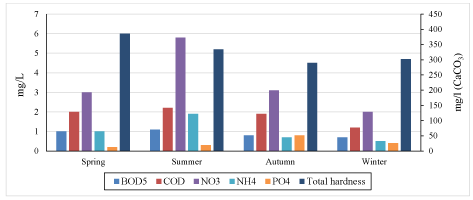
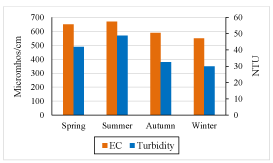
The experiments performed on Kardeh Dam’s water for spring, summer, autumn, and winter seasons are shown in Figures 2 to 6. The severity of BOD5, Nitrate, COD, and Ammonium contamination is highest in summer and lowest in winter (Table 5). The high levels of BOD5 and COD in summer can be attributed to increased microbial activity and organic load from natural organic compounds in summer [33]. It is also worth mentioning about nitrate and ammonium; In summer, the temperature and consequently microbial activity increase, and this leads to successive processes of ammonification (production of ammonium nitrogen from the protein of organic compounds) and nitrification (production of nitrate from the protein of organic compounds and ammonium) [34]. However, the intensity of Phosphate contamination reached its maximum concentration in autumn and has the lowest value in spring. On the other hand, the total hardness reaches its maximum in spring, while autumn has the minimum total hardness. Similarly, Figure 3 shows the amount of electrical conductivity and turbidity in the spring, summer, autumn, and winter seasons. It should be noted that the total solids in spring, summer, autumn, and winter are 364, 395, 357, and 316 mg / l, respectively. The results of measuring total solids indicate that the Kardeh Dam is not suitable for the presence of solids in all seasons, and this parameter reaches its maximum in summer. Simultaneous evaluation of total solids, electrical conductivity, and turbidity show that these three factors, due to microbial activity and changes such as thermal stratification, achieve the highest value in summer [35]. As it turns out, electrical conductivity and turbidity have maximum values in summer, and the minimum amount of electrical conductivity and turbidity occurs in winter.
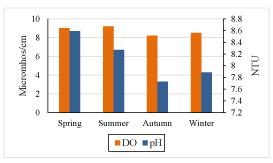
Based on Figure 4, it can be seen that DO and pH indices have maximum laboratory values in summer and spring, respectively, and minimum values in autumn.
Figure 5 shows the number of fecal coliforms in spring, summer, autumn, and winter. Summer with 1400 fecal coliforms per 100 ml has the highest number of coliforms, significantly different from the values obtained for other seasons. Also, the minimum number of fecal coliforms occurs in autumn (730 per 100 ml).
Khara, et al. (2011), in a study evaluating the water quality of Ashmak river in Guilan province, measured the mean values of electrical conductivity, total hardness, and fecal coliforms as 1114.95 µmho/cm, 412.25 mg/L, and 5363 units per 100 milliliters, respectively Meanwhile, the average values of total hardness and fecal coliform in Kardeh Dam, according to Table 6, are equal to 327.75 mg/L and 976.25 per 100 ml [36]. Shresta and Kazama (2007) also assessed the Fuji River›s water quality in Japan in a similar study. In this study, qualitative arameters were measured from 13 different points along the river from 1995 to 2002. In this study, the mean parameters of DO, BOD5, COD, NO3, NH4, and PO4 in the mentioned period were equal to 9.77, 1.69, 3.04, 1.17, 0.84, and 0.06 mg/l, respectively [37]., Meanwhile, the average values mentioned for the water of Kardeh Dam, according to Table 6, are equal to 8.75, 0.87, 1.89, 8.1, 3.59, 1.01, and 0.41 mm, respectively. In other studies, Simonov, et al. (2003) assessed the surface water quality of northern Greece over three years. In this study, the values of DO, BOD5, COD, NO3 and PO4 were 7.4, 11.4, 12.2, 0.38 and 0.22 mg /l, respectively [8].
Moreover, in the mentioned study, the average electrical conductivity was 421 µmho/cm, while it was 614.25 µmho/cm for Kardeh Dam water. In this part of the study, the water quality of Kardeh Dam is evaluated following the Iranian water quality standard for agricultural and recreational purposes. The values of the dam’s average quality parameters and the required water standards for agricultural and recreational purposes are given in Table 6. According to Table 6, the geometric average of the number of fecal coliforms in the dam is 946 MPN/100ml, which meets the standard requirements of the Environmental Protection Agency (geometric average less - equal to 1000 fecal coliforms per 100 ml). The average nitrate concentration was 3.59 mg/L, which is much lower than the virtual limit set by the Environmental Protection Agency for water for agricultural use. The average electrical conductivity and pH of Kardeh Dam water are 614.25 μmho/cm and 8.1 per year, respectively, which satisfy the standard conditions. On the other hand, according to regional water reports in Khorasan Razavi province, the concentrations of Aluminum, Arsenic, Beryllium, Cadmium, Cobalt, Chromium, Copper, Iron, Lithium, Manganese, Molybdenum, Nickel, Palladium, Selenium, Vanadium, Zinc, Fluorine and Boron are very small in Kardeh Dam and are within the permitted limits set by the Environmental Protection Organization for agricultural purposes. Also, the arithmetic means the number of intestinal nematodes per liter does not exceed the range of water quality standards and provides the allowable bacteriological limits of water for agricultural use; hence the water of Kardeh Dam can be exploited for agricultural purposes without the need for treatment. Due to dams’ tourism nature, these water resources are used for recreation by direct or indirect contact. Natural recreation is an activity in which the human body is in contact with water, and water is more likely to enter the body, primarily through swallowing. Indirect recreation is an activity in which part of the body is in contact with water, And the possibility of water entering the body is negligible. According to Table 6, the mean values of dissolved oxygen and pH are in the standard range for recreational use. On the other hand, the standard values of the geometric mean of fecal coliforms for direct and indirect recreation are 400 and 2000, respectively. Meanwhile, Kardeh Dam’s water with a geometric average of 946 coliforms per 100 ml is only within the permissible range for indirect recreation.
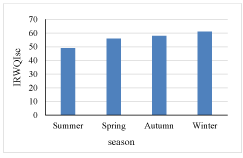
The weighting result of Iranian surface water quality indicators (IRWQISC) for Kardeh Dam in different seasons of the year is shown in (Figure 6). It is clear that the desirability of surface water quality of Kardeh Dam is the highest in winter. Water conditions in winter, autumn, and spring according to IRWQISC index with weight indices of 60.9, 57.61, and 55.43 (according to Table 2) has relatively good quality conditions. Meanwhile, the summer season with quality indicators of 49.25 evokes average quality conditions. Therefore, it can be considered that the level of desirability of surface water quality of Kardeh Dam has downward desirability in winter, autumn, spring, and summer, respectively.
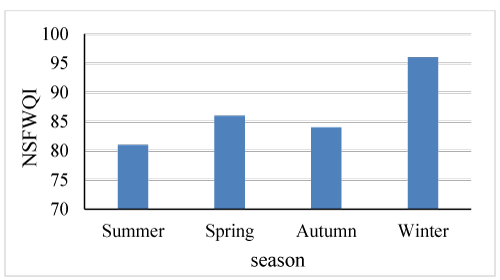
The results of NSFWQI surface water quality analysis of Kardeh Dam are shown in (Figure 7) Considering the above figure, it seems that in the NSFWQI method, the weight of surface water quality in winter, autumn, spring, and summer is estimated to be 96.64, 84.48, 86.4, and 81.28, respectively and creates excellent, good, good, and good quality conditions.
Studies have shown that the best quality conditions are achieved in winter and the worst in summer. However, according to this assessment method (NSFWQI), spring has the best surface water quality after winter, and all seasons are in good condition. According to the calculations and tests performed in the IRWQISC index, Kardeh dam was classified in relatively good conditions in all winters, autumns, and springs and moderate conditions in summer. But according to the NSFWQI index, winter was in excellent condition, and autumn, spring, and summer were in good condition. This comparison indicates that the IRWQISC standard has a more stringent result than the NSFWQI for assessing the efficiency of the dam. In a review study, Alavi Moghadam (2006) examined the quality standards of water resources in Japan. In this study, the quality classification standards of lakes and reservoirs in Japan were presented according to Table 7. [37].
Examining Table 7 and comparing the data of this study, it is clear that water samples of Kardeh Dam in winter, spring, and summer are classified in category B. This means that Kardeh Dam’s water can be used directly for raising grade 3 fish, grade 1 industrial water, and agricultural water. The analysis also showed that according to Japan›s quality standard, Kardeh Dam water is classified in category C in autumn due to the high amount of Suspended Solids (SS). This means that this water can be used as grade 2 industrial water. In this regard, Samadi (2015), during a study, measured physical and chemical parameters (pH, DO, TSI, TDS, NO3, PO4-3) and IRWQI water quality index to assess pollution and investigate the Spatio-temporal impact of land use on the Water Quality of Choghakhor wetland. According to IRWQI index, the water of Choghakhor wetland, in the first half of spring and autumn, due to increased agricultural activities, floods, and seasonal rainfall with moderate to relatively good conditions (60-51), had the worst water quality. The best water quality situation was related to the summer season and the first half of winter with a good condition (82-70) due to the reduction of agricultural activities, floods, and drainage due to seasonal rains [38]. In another study, Sadeghi, et al. (2015) determined the water quality status of the Zarrin Gol River in Golestan Province using the water quality index (NSFWQI) and surface water quality index of Iran (IRWQISC). In this study, the parameters of thermoplastic coliform, BOD, phosphate, turbidity, total hardness, pH, and total solids were measured. The results of this study were moderate (50-70) based on the NSFWQI index and in two categories of moderate (55-45) and relatively good (55.1-70) based on the IRWQISC index [39]. In another study, Javid, et al. (2015) investigated groundwater resources’ toxicity in Semnan province (41 wells) using the IRWQIGT index. In this study, chemical parameters including Arsenic, Phenol, Mercury, detergents, Cadmium, Lead, Chromium, Cyanide, Iron, Manganese, and petroleum hydrocarbons were studied. The results of this study showed the value of IRWQIGT index for groundwater in Semnan province between 96.54 to 98.2, and the water of the region was in the excellent range [40]. Comparison of IRWQISC and NSFWQI shows that in physical parameters, Electrical conductivity and turbidity have the most weights, respectively. While, in IRWQISC the water hardness is considered as an important criteria and in NSFWQI it is not true. About chemical parameters in IRWQISC and NSFWQI systems, BOD5 and Dissolved Oxygen are the most significant, correspondingly. Also, contrary to the NSFWQI method, ammonium values are considered in the IRWQISC computations. The biological section of IRWQISC and NSFWQI are similar with to gather. Finally, it is clear that the IRWQISC is stricter in comparison of NSFWQI, especially in chemical aspects.
Conclusion
The quality of surface water depends on environmental factors such as temperature conditions, the region’s climate, type of vegetation, soil type, etc. On the other hand, to treat water resources, it is necessary to carry out global monitoring at different time intervals to obtain coherent models of the qualitative behavior of different surface water resources. In this study, the water quality behavior of Kardeh Dam was investigated using IRWQISC and NSFWQI evaluation models. A sampling of dam water was done on the 15th of May, August, November, and February 2015. The results of quality tests showed that water quality conditions, according to IRWQISC standards in different seasons of winter, autumn, summer, and spring, have relatively good, relatively good, relatively good, and average quality conditions, respectively. IRWQISC quality weight index in winter, which is equal to 60.9, was estimated to be 5.39, 8.97, and 19.13 % more than weight indices of autumn, spring, and summer seasons, respectively. Moreover, NSFWQI index analyzes evoked excellent, good, good, and good quality conditions in winter, autumn, summer, and spring, respectively. In this model, the winter quality index was calculated as 12.58, 10.59, and 15.89% higher than the weight index of the samples related to autumn, spring, and summer, respectively. This difference in water quality›s desirability can indicate a difference in many factors such as temperature and ecosystem conditions in different months and seasons of the year.
- Uddin MG, Nash S, Olbert AI (2021) A review of water quality index models and their use for assessing surface water quality. Ecological Indicators 122: 107218. Link: https://bit.ly/3xFv9hf
- Ram A, Tiwari SK, Pandey HK, Chaurasia AK, Singh S, et al. (2021) Groundwater quality assessment using water quality index (WQI) under GIS framework. Applied Water Science 11: 1-20. Link: https://bit.ly/3eKaj7M
- Asadollah SBHS, Sharafati A, Motta D, Yaseen ZM (2021) River water quality index prediction and uncertainty analysis: A comparative study of machine learning models. Journal of Environmental Chemical Engineering 9: 104599. Link: https://bit.ly/2PNfewm
- Fadel A, Kanj M, Slim K (2021) Water Quality Index variations in a Mediterranean reservoir: a multivariate statistical analysis relating it to different variables over 8 years. Environmental Earth Sciences 80: 1-13. Link: https://bit.ly/3tfUWct
- Khan R, Saxena A, Shukla S, Sekar S, Goel P (2021) Effect of COVID-19 lockdown on the water quality index of River Gomti, India, with potential hazard of faecal-oral transmission. Environmental Science and Pollution Research 1-9. Link: https://bit.ly/3aWTNQW
- Adimalla N (2021) Application of the Entropy Weighted Water Quality Index (EWQI) and the Pollution Index of Groundwater (PIG) to Assess Groundwater Quality for Drinking Purposes: A Case Study in a Rural Area of Telangana State, India. Archives of Environmental Contamination and Toxicology 1-10. Link: https://bit.ly/3ufHc2O
- Alum OL, Okoye CO, Abugu HO (2021) Quality assessment of groundwater in an agricultural belt in eastern Nigeria using a Water Quality Index. African Journal of Aquatic Science 1-15. Link: https://bit.ly/3aXsLZn
- Chakraborty B, Roy S, Bera A, Adhikary PP, Bera B, et al. (2021) Geospatial Assessment of Groundwater Quality for Drinking through Water Quality Index and Human Health Risk Index in an Upland Area of Chota Nagpur Plateau of West Bengal, India. In Spatial Modeling and Assessment of Environmental Contaminants. Springer, Cham 327-358. Link: https://bit.ly/3aZHsez
- Dash S, Kalamdhad AS (2021) Hydrochemical dynamics of water quality for irrigation use and introducing a new water quality index incorporating multivariate statistics. Environmental Earth Sciences 80: 1-21. Link: https://bit.ly/2QH43px
- Nasirahmadi K, Yousefi Z, Tarassoli A (2012) Zoning of water quality on Haraz river bases on the national sanitation foundation water quality index. Journal of Mazandaran University of Medical Sciences 22: 64-71. Link: https://bit.ly/3aY47bc
- Ebadati N, Hooshmand Zadeh M (2014) Water quality evaluation of Dez River in the Dezful hydrometric station. Iranian Journal of Ecohydrology 1: 69-81. Link: https://bit.ly/2PHm5aq
- Mirmoshtaghi M, Amirnezhad R, Khaledian MR (2013) Survey of water quality in Sefidrood by NSFWQI and OWQI Index. Talab, 3: 23-34.
- dos Santos Simões F, Moreira AB, Bisinoti MC, Gimenez SMN, Yabe MJS (2008) Water quality index as a simple indicator of aquaculture effects on aquatic bodies. Ecological indicators 8: 476-484. Link: https://bit.ly/337jMAL
- Makhloogh A, Nasrollahzade H, Parafkande F, Fazli H, Mirzaie R, et al. (2017) Monitoring water quality and eutrophication phenomenon of Azad Dam using Iranian Water Quality Index and Carlson's Trophic State Index. ISFJ 26: 69-78. Link: https://bit.ly/3ebEiGt
- Sadeghi M, Bay A, Bay N, Soflaie N, Mehdinejad MH, et al. (2015) The effect of agriculture drainage on water quality of the Zaringol in Golestan province by the water quality index, Research in Environmental Health 1: 177-185 . Link: https://bit.ly/3vAqo6O
- Wills M, Irvine KN (1996) Application of the national sanitation foundation water quality index in Cazenovia Creek, NY, pilot watershed management project. Middle States Geographer 95-104. Link: https://bit.ly/3ePeDmb
- Rocchini R, Swain LG (1995) The British Columbia water quality index. Water Quality Branch, EP Department, BC, Ministry of Environment, Land and Park, Victoria, BC, Canada, 13.
- Hawkes HA (1998) Origin and development of the biological monitoring working party score system. Water Research 32: 964-968. Link: https://bit.ly/33nevFr
- Mandaville SM (2002) Benthic macroinvertebrates in freshwaters: Taxa tolerance values, metrics, and protocols. Nova Scotia: Soil & Water Conservation Society of Metro Halifax 128: 315. Link: Link: https://bit.ly/3xD412B
- Walley WJ, Fontama VN (1998) Neural network predictors of average score per taxon and number of families at unpolluted river sites in Great Britain. Water Research 32: 613-622. Link: https://bit.ly/3nFVEhS
- Bispo PDC, Oliveira LG, Bini LM, Sousa KGD (2006) Ephemeroptera, Plecoptera, and Trichoptera assemblages from riffles in mountain streams of Central Brazil: environmental factors influencing the distribution and abundance of immatures. Brazilian Journal of Biology 66: 611-622. Link: https://bit.ly/3ehYk2t
- Tanner A, Friderich P () Disputatio theologica de poenitentiae virtute et sacramento. Sartorius.
- Shokri Saravi M, Ahmadi M, Rahmani H, Kamrani E (2015) Water Quality Assessment Based on Hilsenhoff Biological, Diversity Shannon- Wiener Indices and Environmental Parameters in Tajan River, Fisheries Science and Technology 3: 43-55 . Link: https://bit.ly/3vFXeTE
- Kordi M, Fazlnia A, Pirkharrati H, Rafiei B, Vafaei H (2014) Groundwater quality assessment within the North West area Kaboodarahang to measure parameters of hydro-geochemistry. New Findings in Applied Geology 8: 24-46. Link: https://bit.ly/3xKikSG
- Vadiati M, Nakhaei M (2015) Groundwater Quality Evaluation of Tehran Province for Agricultural Uses by Fuzzy Inference Model. Link: https://bit.ly/3tcFA8F
- Hao X, Wang D, Wang P, Wang Y, Zhou D (2016) Evaluation of water quality in surface water and shallow groundwater: a case study of a rare earth mining area in southern Jiangxi Province, China. Environmental Monitoring and Assessment 188: 24. Link: https://bit.ly/3ebqNqo
- Smeti EM, Golfinopoulos SK (2016) Characterization of the quality of a surface water resource by multivariate statistical analysis. Analytical Letters 49: 1032-1039. Link: https://bit.ly/3gTuDGx
- Nayyeri H, Zandi S (2015) Water quality status of Tarwal river in Kurdestan province using IRWQIsc index and quality zoning based on IDW interpolation model, Buletin Teknologi Tanaman 12: 242-248 . Link: https://bit.ly/3eNT3yt
- American Public Health Association, American Water Works Association, Water Pollution Control Federation, & Water Environment Federation (1912). Standard methods for the examination of water and wastewater 2. American Public Health Association.
- Mamais D, Jenkins D, Prrr P (1993) A rapid physical-chemical method for the determination of readily biodegradable soluble COD in municipal wastewater. Water Research 27: 195-197. Link: https://bit.ly/3aXuEFr
- Dufour AP (1977) Escherichia coli: the fecal coliform. In Bacterial indicators/health hazards associated with water. ASTM International.
- Simonson JM, Pitzer KS (1986) Thermodynamics of multicomponent, miscible ionic systems: the system lithium nitrate-potassium nitrate-water. J Phys Chem 90: 3009-3013 . Link: https://bit.ly/3ed5lkP
- Bilby RE, Likens GE (1980) Importance of organic debris dams in the structure and function of stream ecosystems. Ecology 61: 1107-1113. Link: https://bit.ly/3nFz5dp
- Stanley EH, Doyle MW (2003) Trading off: the ecological effects of dam removal. Frontiers in Ecology and the Environment 1: 15-22. Link: https://bit.ly/2QOxA0o
- Koberg GE, Ford ME (1965) Elimination of thermal stratification in reservoirs and the resulting benefits. Link:https://bit.ly/3aWX5Ui
- Khara H, Mazloumi H, Nezami SA, Akbarzadeh A, Gholipour S, et al. (2011) Water quality of Oshmak river (Guilan province).
- Alavi Moghaddam SMR (2007) A review of water quality standards in Japan. Journal of Environmental Science ad Technology 8: 89-95 .
- Shrestha S, Kazama F (2007) Assessment of surface water quality using multivariate statistical techniques: A case study of the Fuji river basin, Japan. Environmental Modelling & Software 22: 464-475 . Link: https://bit.ly/339D6ND
- Samadi J (2016) Survey of Spatiotemporal Impact of Land Use on Water Quality in Chaghakhor Wetland Using IRWQI Index and Statistical Methods. Iran-Water Resources Research 11: 159-171. Link: https://bit.ly/3vHgAIn
Article Alerts
Subscribe to our articles alerts and stay tuned.
 This work is licensed under a Creative Commons Attribution 4.0 International License.



 Save to Mendeley
