Ann Cytol Pathol
Identifying the Relation between Fasting Blood Glucose and Glycosylated Haemoglobin Levels in Greek Diabetic Patients
Marilena Stamouli1*, Abraham Pouliakis2, Antonia Mourtzikou2, Anastasios Skliris1, Ioanna Panagiotou1, Evaggelia Marasidi1 and Emmanouil Mournianakis1
2Department of Cytopathology, National and Kapodistrian University of Athens, Athens, Greece
Cite this as
Stamouli M, Pouliakis A, Mourtzikou A, Skliris A, Panagiotou I, et al. (2016) Identifying the Relation between Fasting Blood Glucose and Glycosylated Haemoglobin Levels in Greek Diabetic Patients. Ann Cytol Pathol 1(1): 025-033. DOI: 10.17352/acp.000004Introduction: Diabetes Mellitus (DM) is associated with long-term damage, dysfunction, and failure of various body organs. Glycosylated haemoglobin (GHbA1c) is a significant biochemical marker in patients with DM which provides an estimation of long-term average glycaemia. The aim of this study was to evaluate the relation between fasting serum glucose (GLU) level and GHbA1c in DM patients and healthy controls, to evaluate the differences between male and female patients and to evaluate the correlation between estimated Average Glucose (eAG) and GLU.
Materials and Methods: The study included 800 DM patients (448 male, 352 female), and 200 (100 male, 100 female) healthy control patients. We used statistical modeling and analysis to evaluate the data.
Results: Via linear regression we found statistically significant linear relations between GLU and GHbA1c for female and male patients, male patients had higher mean level of GLU than female (+10.7mg/dL p<0.05), similarly for GHbA1c (+0.24% p<0.05). For healthy controls, neither linear relation nor gender difference was identified. Subsequently we calculated eAG on the basis of GLU level, we found a significant correlation (Corr.Coeff.=0.56) between GLU and eAG for DM patients and no correlation (Corr.Coeff.=0.026) for healthy controls. These finding were consistent when the analysis was repeated separately for both genders, however with no difference between men and women.
Conclusions: eAG and GLU values cannot be used in general population interchangeably. One strategy option could be the use of eAG levels together with GHbA1c values.
Introduction
Diabetes mellitus (DM) is a metabolic disorder which is characterized by a defect of normal glucose metabolism resulting in chronic hyper glycaemia and disturbances of carbohydrate, fat and protein metabolism [1]. DM constitutes a major public health problem requiring global attention because it is associated with long-term damage, dysfunction, and failure of various body organs, especially the eyes, kidneys, nerves, heart and blood vessels [2-4]. The prevalence of DM has been increasing steadily worldwide and is estimated to grow to 4.4% by 2030, while type 2 DM is accounting for the 95% of prevalence among patients with diabetes [2-5]. In Greece, there is a considerable increase of 1% in the prevalence of DM annually, attributed to decreasing levels of physical activity, increasing obesity rates, population ageing, lifestyle habits and unhealthy dietary behaviors [6,7]. Glycosylated haemoglobin (GHbA1c) was identified as an unusual haemoglobin in patients with diabetes many years ago and its significance in relation to diabetes was first appreciated by Rahbar et al. [8], GHbA1c is formed through the non-enzymatic binding of circulating glucose to hemoglobin, a process called glycation. The rate of formation of GHbA1c is directly proportional to the ambient glucose concentration. Since glycation occurs over the entire red blood cell life span, GHbA1c can be interpreted as an index of average blood glucose over the preceding two months [9,10]. GHbA1c measurement provides an objective and quantitative estimation of long-term average glycaemia and it is recommended for checking glycaemic control in people who might be a pre-diabetic stage, for documenting the degree of glycaemic control at initial assessment and for monitoring glycaemic control in diabetic patients, in order to reduce the risks associated with the development and progression of chronic DM complications [10-12]. GHbA1c measurement is also being used increasingly by quality assurance programs to assess the quality of diabetes care [13] and to identify diabetic from healthy population [14]. The International Expert Committee on the role of GHbA1c in DM recommended the use of a GHbA1c level of 6.5% or higher to diagnose type 2 DM [15,16]. Since GHbA1c results can vary considerably when measured by different laboratories or analytical methods, many studies and trials have been realized for the measurement and the standardization of the assay, in order to develop international harmonization and make the results reported from different laboratories comparable [16,17]. The relationship between the average blood glucose level and the GHbA1c level has been investigated in many studies. The ADAG Study Group concluded that GHbA1c could be reliably translated into estimated average glucose (eAG). For this purpose the group developed the following linear regression equation, which was derived from adults with type 1 and type 2 DM, as well as control subjects: eAG (in mg/dL) = 28.7 × A1C – 46.7 [18-20]. The major advantage of using eAG for chronic glycaemia is that it is expressed with the same measurement units as acute glycaemia, offering patients a better understanding of their GHbA1c results when they correlate them to their daily glucose measurements [21]. Even though the aforementioned equation was recommended by the American Diabetes Association, a significant debate continues, based mostly on concerns about the population studied by the ADAG study, on which the equation is based [22,23].
The aim of this study was a) to evaluate the relation between fasting serum glucose (GLU) level and GHbA1c both in diabetic patients and healthy controls, b) to evaluate the differences between diabetic patients and healthy controls, c) to evaluate the differences between male and female patients and d) to evaluate the correlation between eAG and GLU.
Materials and Methods
The population of this prospective study included 800 type 2 diabetic patients, 448 (56%) male and 352 (44%) female, aged between 32 and 70 years. Patients were recruited from the Internal Medicine Department, during a three year period of time. The diagnosis of DM was based on the American Diabetes Association criteria for type 2 DM (fasting plasma glucose level higher than 126 mg/dL and/or glucose level exceeding 200 mg/dL at 2 hours in the 75 g oral glucose tolerance test).
All patients were having minimum diabetic duration of one year and hemoglobin levels between 12 and 16 g/dL. Patients with conditions that affect the mean life of erythrocytes (such as haemolysis, blood loss and hemoglobinopathies) were not included in this study. The controls incorporated in the study were 200 age-matched blood donors, 100 male and 100 female, without any clinical history of diabetes and were considered healthy through routine laboratory analysis (Table 1).
The study was approved by the local Medical Ethics Committee and was conformant to the ethical guidelines of the Declaration of Helsinki. Venous blood samples were collected by venipuncture from all the subjects after 12 hours overnight fasting. Samples were analyzed on the day of collection for serum glucose and glycosylated hemoglobin. Levels of fasting glucose (GLU) and glycosylated hemoglobin (GHbA1c) were measured on the Olympus AU640 fully automated analyzer, using the commercial kits P.N. 1418-0013 and 1418-1057 by Medicon Hellas SA. Normal range established in Naval Hospital of Athens laboratory for GLU is 70 to 110 mg/dL and for GHbA1c is 4.4% to 6.2%. A strict quality control check by both internal and external controls was used for both tests.
Statistics
The statistical analysis was performed by SAS 9.3 for Windows (SAS Institute Inc. NC, USA) [24], as well as via Excel 2007 for Windows (Microsoft corporation) for data collection and preprocessing. In particular, we applied a linear regression model on four groups: male subjects with diabetes, female subjects with diabetes, male subjects without diabetes and female subjects without diabetes. Samples with outliers on scatter plot for data validity were excluded during data pre-processing. Differences between groups were evaluated by the Student’s t-test; the level of significance was set at p = 0.05 [25,26]. SAS 9.3 was used as well to calculate the power of the various statistical tests as well as the normality of the data.
Results
The statistical power of our sample when applying t-test, for sample size 352 for the female and 448 for the male patients was calculated for the mean GLU levels: 88% and for the mean GHbA1c 47%. Additionally the normality of the data was tested via the Shapiro-Wilk test, specifically for the female health controls it was W=0.903 (p<0.0001), for the male health controls W=0.824 (p<0.0001), while for the female patients: W=0.793 (p<0.0001) and for the male patients W=0.793 (p<0.0001). In this test for normality a value of W near to 1 indicates a perfect normal distribution and the related p-value the statistical significance.
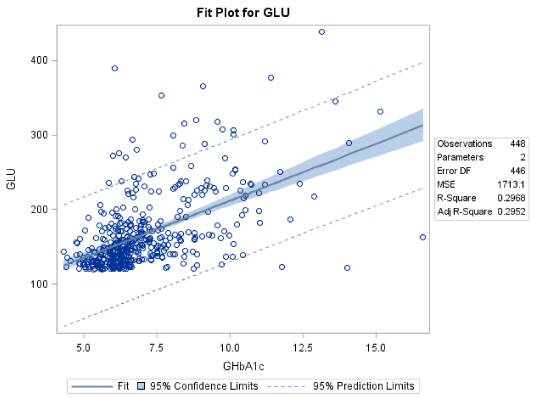
The mean level of fasting blood glucose for male patients was 166.8±49.3 mg/dL and the corresponding mean value for the GHbA1c was 7.05±1.77. Out of the 448 male patients, 201 had GHbA1c levels lower than 6.50%, while 134 had GHbA1c levels between 8.00 and 16.60%, reflecting their poor glycaemic control (Table 2).
The linear regression analysis suggests that there is a linear relation between GLU and GHbA1c. Moreover, the formula governing this relation is: GLU=59.05+15.29*GHbA1c (R2=29.68%). The F-statistic of the overall model is highly significant (F=188.20 p<0.0001), as well as the slope and intersection parameters (p<0.001 both for slope and intersection) (Figure 1).
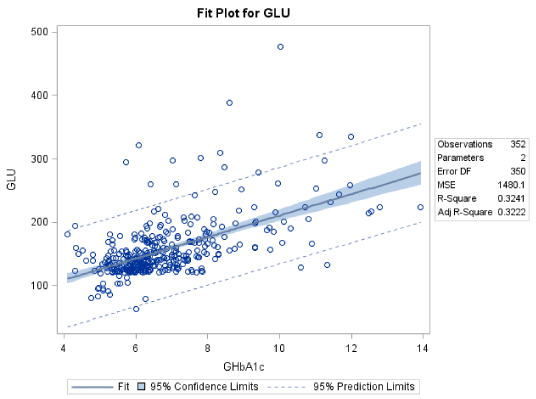
For the female patients the mean level of fasting blood glucose was 156.1±46.7 mg/dL and the corresponding mean value for the GHbA1c was 6.81±1.57. Out of the 352 female patients, 192 had GHbA1c levels lower than 6.50±1.54%, while 54 had GHbA1c levels between 8.00 and 13.40%, reflecting their poor glycaemic control (Table 2). The linear regression analysis suggests that there is a linear relation between GLU and GHbA1c. Moreover, the formula governing this relation is: GLU=40.74+16.95*GHbA1c (R2=32.41%). The F-statistic of the overall model is highly significant (F=167.83 p<0.0001), as well as the slope and intersection parameters (p<0.001 both for slope and intersection) (Figure 2).
Both equations (for male and female patients) have similar slope (15.29 and 16.95 respectively) meaning that equal increase in GHbA1c level reflects to similar increase in GLU level for both genders, however the intercept is different 59.05 for males and 40.74 for females, thus we expect that for male patients there is about 18.0 mg/dL higher GLU level than female patients for similar GHbA1c level.
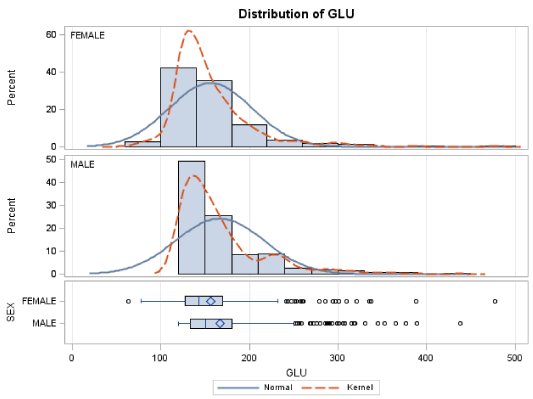
Actually for male patients the mean GLU level is expected to be 10.7 mg/dL higher and this difference is statistically significant (pooled t-test: t=-3.1 p=0.0019), these findings are summarized in Table 3 and Figure 3.
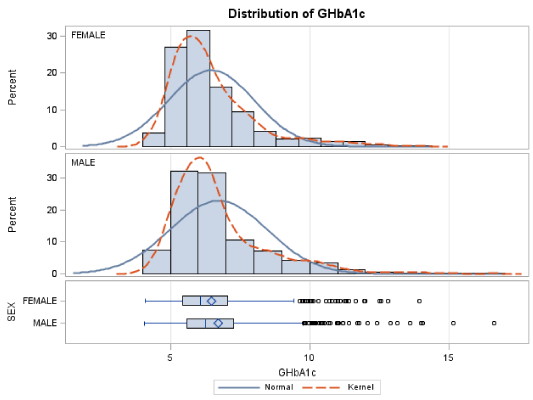
Moreover, we evaluated a statistically significant difference in mean GHbA1c values between the two genders (pooled t-test: t=-2.46 p= 0.0142). These findings are summarized in Table 4 and Figure 4.
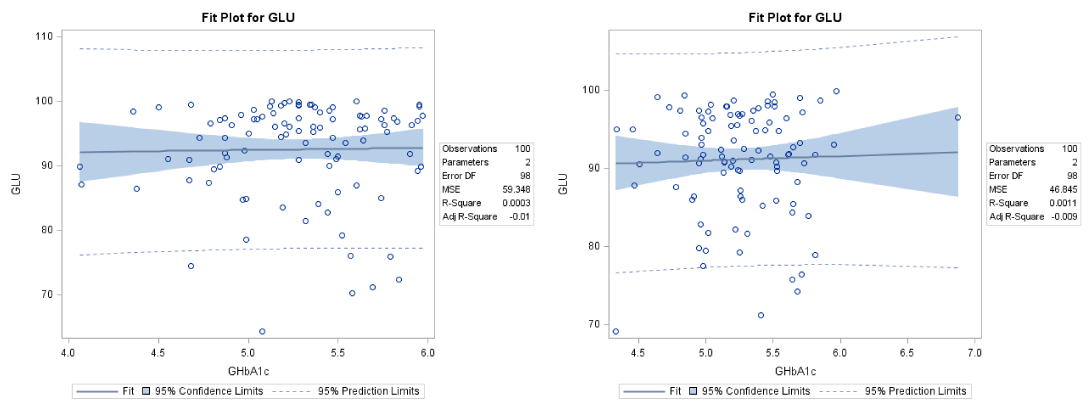
In healthy controls, the mean level of GLU for male subjects was 92.5±7.7 mg/dL and for female subjects 91.1±6.8 mg/dL. The corresponding mean values for the GHbA1c were 5.28±0.43% and 5.26±0.39% respectively. The linear regression analysis showed that there is no correlation between GLU and GHbA1c (R2 = 0.0003 and R2 = 0.0011 respectively). These findings are presented in Figure 5.
Subsequently we estimated the average glucose (eAG) via the formula eAG (in mg/dL) = 28.7 × A1C – 46.7 using the measured GHbA1c values. There was statistically significant difference of the eAG mean values between the two genders (pooled t-test: t= -2.00 p=0.0462). These findings are presented in Table 5.
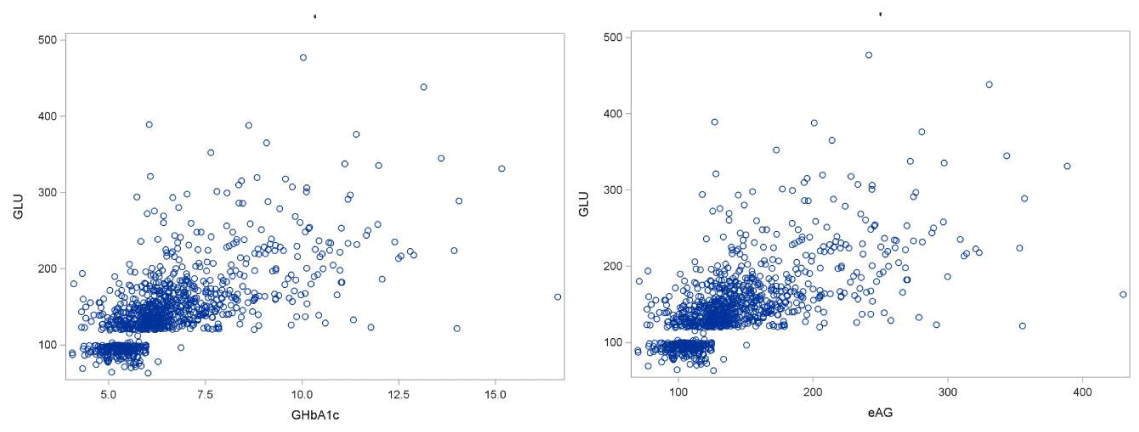
Comparisons between the eAG values (calculated via the aforementioned formula) and the measured GLU values. These comparisons were based on the Pearson correlation coefficient. First we compared GLU with GHbA1c and eAG irrelevant to gender and disease status. The scatter plots are presented in Figure 7. From the analysis results we conclude that there is a statistically significant (p<0.0001) strong correlation (Corr.Coef=0.64) between GLU and eAG. As it was expected the correlation between eAG and GHbA1c is perfect (p<0.0001, Corr.Coef =1.0) because GHbA1c and eAG were related via the aforementioned linear equation. There is a clear separation of the diabetics and non-diabetics as the scatter plots (Figure 6) present two distinct areas left lower part and upper right part.
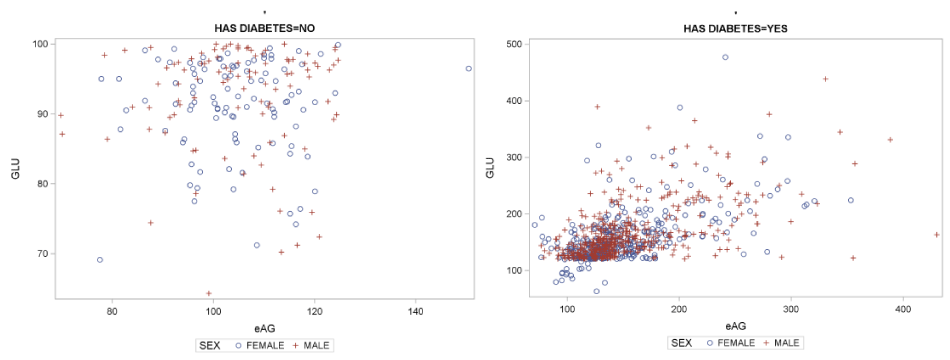
From the comparison between GLU and eAG in relation to the disease status irrelevant to gender we conclude that their correlation for healthy controls is very low and not statistically significant (Corr. Coeff.=0.026, p=0.71) while their correlation for the DM patients is very good and statistically significant (Corr. Coeff.=0.56 p<.0001). The scatter plots for GLU with eAG irrelevant to gender for the two groups (healthy controls and diabetic subjects) are presented in Figure 7.
From the comparison between GLU and eAG in relation gender and irrelevant to the disease status we conclude that there is no difference of the correlation between GLU and eAG between females and males (Corr. Coeff. = 0.66 and 0.63 respectively) and that in both cases this correlation is statistically significant (p<0.001). The scatter plots of GLU with eAG for the two genders with disease status indications are presented in Figure 8.
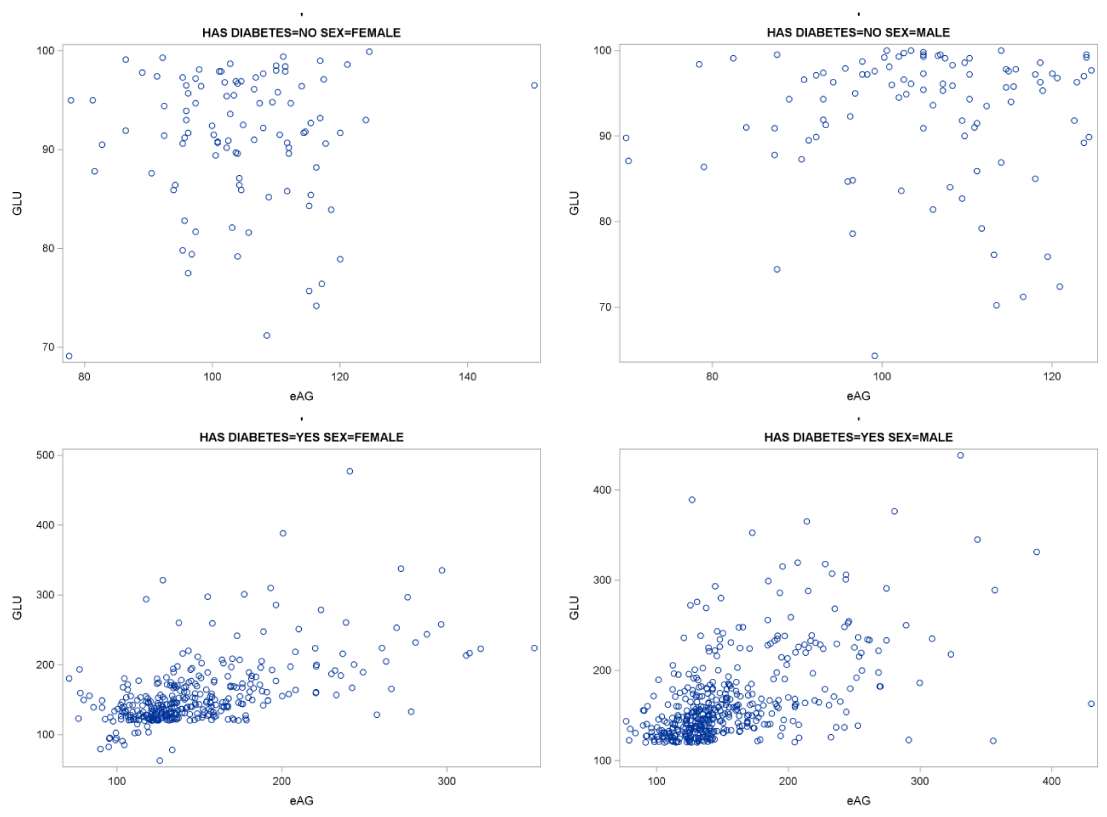
As a final step, we examined the correlation between GLU and eAG in relation both to gender and disease status. For this analysis we calculated the correlation coefficient for the GLU with eAG for four groups: healthy female controls, female DM patients, healthy male controls, DM male patients. The correlation coefficients along with the statistical significance value and scatter plots for the four groups appear in Table 6 and Figure 9.
From this analysis we conclude that the correlation of GLU and eAG both for female and male healthy controls is neither statistically significant nor important (Corr. Coeff.=0.03 and 0.02 respectively, p=0.74 and 0.86 respectively). Thus gender is not important for this correlation of GLU and eAG of healthy controls. The correlation of GLU and eAG both for female and male DM patients is statistically significant and important (Corr. Coeff.=0.57 and 0.54 respectively, p<0.0001 in both cases). As the two correlation coefficients do not differ statistically gender is not important for the correlation of GLU and eAG of diabetic patients, however as shown previously it was proved that GLU and eAG are correlated for the DM patients.
Study limitations
Within this study we studied various biochemical parameters related to D.M. and their relations. However it is not a population based study, moreover there was no random sampling, because we have used inclusion and exclusion criteria, hence generalization to large populations is not possible. Eventually, despite the rather small population, the results are valid due to their statistical p value.
Within this study we identified differences between the mean GLU levels of male and female patients; despite we have included subjects with DM duration more than a year, the disease duration, among other confounders, could be a factor that affects the results. These confounders could be a subject of a future study.
Another limitation is related to the short term fluctuations based of the measured levels of GLU and GHbA1c. Such fluctuations are dependent on the life style of the subjects as well as due to therapy; such fluctuations was not possible to be taken to account; as require 24x7 monitoring. However due to the large population and the concordance of the results with those of other studies, we suggest that the outcomes are representative.
As eAG is estimated via a linear relation from measured values of GHbA1c, the correlations of GLU with eAG are similar to these of GLU and GHbA1c.
Discussion
Diabetes mellitus is a chronic non communicable disease characterized by hyperglycaemia and associated with long-term complications. DM management requires an accurate evaluation of glycaemic control. The traditional blood glucose estimations give results that are influenced by biological variability, variability due to pre-analytical factors (such as blood collection method and blood storage conditions) and difficulty in ensuring fasting state before blood glucose measurement. GHbA1c measurements, expressed as a percentage of total blood hemoglobin concentration, have been widely used for more than 25 years [11,27]. GHbA1c measurements do not require a fasting state for sample collection, they present analytical variability of less than 2% and they provide information on glycaemic status over the past 2-3 months [11,21,27]. In the current study, GLU was correlated with GHbA1c in order to investigate the possible relationship between them in established diabetic patients in Greece. The possible influence of gender was also investigated. We found a linear relation between GLU and GHbA1c both in male and female patients. Moreover, the formulas governing this relation are: GLU=59.05+15.29*GHbA1c and 40.74+16.95*GHbA1c respectively. In both cases the relationship is highly significant. Male patients present higher GLU levels. Such differences have been also extensively reported by other authors and have been attributed to the impact of sex hormones in glucose homeostasis as well as to different attitudes and behaviors related to diabetes care [28-30].
We have also evaluated a statistically significant difference in mean GHbA1c values between the two genders. Moreover, in our study 198 male patients (44.2%) and 54 female patients (15.3 %) presented poor glycaemic control with GHbA1c values greater than 8.00 %. The difference between the two genders with regard to poor glycaemic control was found statistically significant (t= -2.46 p=0.0142<0.05). Poor glycaemic control over time has been linked to the development and progression of microvascular diabetes complications [6,11,21]. The literature is mixed on gender glycaemic control in type 2 diabetes. Some reports show gender equality in glycaemic control while others show differences between males and females [31-33]. Ethic differences are also observed [34,35] and may reflect differences in the need and in the use of health services. In our study differences in GLU and GHbA1c levels between male and female healthy controls were not observed.
The correlation between GLU and GHbA1c for the total of population with DM under study was fairly high (R=0.557, p<0.001), while for the healthy population it was R=0.027 (p>0.05). Other studies have also reported similar correlations [36,37]. Conversely, a study conducted on the Dutch population showed only a moderate correlation, while a study in Southern India showed very high such correlation [38,39]. In our study since this correlation coefficient is around 0.55 and R2 is about 0.3 (Figures 1,2) the eAG estimation alone by HbA1C, is unlikely to replace GLU measurements. The relationship between the fasting serum glucose level and the level of GHbA1c has been investigated in different studies, and many linear equations were developed for this purpose. In the present study we calculated the estimated average glucose (eAG) levels of our study group using Nathan’s regression equation, which has been recommended by the American Diabetes Association: eAG = (GHbA1c * 28.7) - 46.7. Moreover, we investigated the relationship between the calculated eAG values and the measured GLU values. The eAG levels were positively correlated with the GLU levels in DM patients (Corr. Coeff. =0.56) and this correlation is statistically significant (p<0.0001). Since GHbA1c and eAG were related via a linear equation their correlation is perfect (p<0.0001, Corr. Coeff.=1.0). On the other hand their correlation for healthy controls is very low and not statistically significant (Corr. Coeff.=0.026, p=0.70). The possible influence of gender in this relationship was also investigated. From the comparison between GLU and eAG in relation gender and irrelevant to the disease status we conclude that there is no difference of the correlation between GLU and eAG between females and males (Corr. Coeff. = 0.66, and 0.63 respectively) and that in both cases this correlation is statistically significant (p<0.001). Gender is not important for this correlation in healthy controls. Gender differences in eAG levels have also been observed by other authors [22,40]. For 279 samples (139 males and 140 females) the eAG levels were lower than the GLU levels, for 46 samples (22 males and 24 females) eAG and GLU levels were equal, whereas for 475 samples, (284 males and 191 females) the eAG levels were higher than the GLU levels. From these findings we conclude that the eAG and GLU values cannot be used interchangeably, because the eAG level is reflective of all plasma glucose levels over the previous two months [22,40-42]. Reporting eAG levels simplifies the interpretation of GHbA1c results. However, the idea of reporting an estimated result is not supported by the international clinical chemistry groups and the diabetes professional community, because calculations increase the uncertainty of test results. Moreover, the eAG calculation only provides an approximate estimation (90% of patient estimates fall within ±15% of the true average glucose) and additional studies of eAG in less-studied populations (ethnic minorities, pregnant females) are needed in order to implement it worldwide, using a more holistic and integrated management [43]. Thus, one of the current strategies is the use of eAG levels together with GHbA1c values [44-46].
Conclusions
We found a linear relation between GLU and GHbA1c both in male and female patients. The formulas governing this relation are: GLU=59.05+15.29*GHbA1c and 40.74+16.95*GHbA1c respectively. In both cases the relationship is highly significant. Male patients present higher GLU levels. We also observed a statistically significant difference in mean GHbA1c values between the two genders (198 male patients (44.2%) and 54 female patients (15.3 %) presented poor glycaemic control with GHbA1c values greater than 8.00 %). The difference between the two genders with regard to poor glycaemic control was found statistically significant. The correlation between GLU and GHbA1c for the total of population with DM under study was fairly high. The eAG calculation only provides an approximate estimation and additional studies of eAG in less-studied populations are needed in order to implement it worldwide. One of the current strategies is the use of eAG levels together with GHbA1c values.
- World Health Organization (1999) Definition. Diagnosis and Classification of Diabetes Mellitus and its Complications. Part 1: Diagnosis and Classification of Diabetes Mellitus. Geneva: World Health Organization 59 .
- Chen L, Magliano DJ, Zimmet PZ (2011) The worldwide epidemiology of type 2 diabetes mellitus--present and future perspectives. Nat Rev Endocrinol 8: 228-236 .
- Shaw JE, Sicree RA, Zimmet PZ (2010) Global estimates of the prevalence of diabetes for 2010 and 2030. Diabetes Res Clin Pract 87: 4-14 .
- Hu FB (2011) Globalization of diabetes: the role of diet, lifestyle, and genes. Diabetes 34: 1249-1257 .
- Sultanpur CM, Deepa K, Kumar SV (2010) Comprehensive review on HbA1c Diagnosis of diabetes mellitus. International Journal of Pharmaceutical Sciences Review and Research 3: 119-122 .
- Melidonis AM, Tournis SM, Kompoti MK, Lentzas IL, Roussou VR, et al. (2006) Increased prevalence of diabetes mellitus in a rural Greek population. Rural remote health 6: 534 .
- Panagiotakos DB, Pitsavos C, Chrysohoou C, Stefanadis C (2005) The epidemiology of Type 2 diabetes mellitus in Greek adults: the ATTICA study. Diabet Med 22:1581-1588 .
- Rahbar S, Blumenfeld O, Ranney HM (1969) Studies of an unusual hemoglobin in patients with diabetes mellitus. Biochem Biophys Res Commun 36: 838-843 .
- Kim HJ, Choi EY, Park EW, Cheong YS, Lee HY, et al. (2011) The Utility of HbA1c as a Diagnostic Criterion of Diabetes. Korean J Fam Med 32: 383-389 .
- American Diabetes Association, European Association for the Study of Diabetes, International Federation of Clinical Chemistry and Laboratory Medicine, International Diabetes Federation (2007) Consensus statement on the worldwide standardisation of the HbA1c measurement. Diabetologia 50: 2042-2043 .
- Kim KS, Kim SK, Lee YK, Park SW, Cho YW (2008) Diagnostic value of glycated haemoglobin HbA(1c) for the early detection of diabetes in high-risk subjects. Diabetic medicine. Diabet Med 25: 997-1000 .
- Kahn R, Fonseca V (2008) Translating the A1C Assay. Diabetes care 31: 1704-1707 .
- World Health Organization (2006) International Diabetes Federation (IDF). Definition and diagnosis of diabetes mellitus and intermediate hyperglycemia. report of a WHO/IDF. consultation 2006 .
- Stamouli M, Pouliakis A, Mourtzikou A, Skliris A, Panagiotou I, et al. (2014) Evaluation of the Lipid Profile in Type 2 Diabetes Mellitus Patients in Greece. Clin Lab 60: 1593-1600.
- (2009) International Expert Committee report on the role of the A1C assay in the diagnosis of diabetes. Diabetes care 32: 1327-1334 .
- Consensus Committee (2007) Consensus statement on the worldwide standardization of the hemoglobin A1C measurement: the American Diabetes Association, European Association for the Study of Diabetes, International Federation of Clinical Chemistry and Laboratory Medicine, and the International Diabetes Federation. Diabetes care 30: 2399-2400 .
- Randie R Little, Curt L Rohlfing (2009) HbA1c Standardization: Background, Progress and Current Issues. LabMedicine 40: 368-373 .
- Saudek CD, Herman WH, Sacks DB, Bergenstal RM, Edelman D, et al. (2008) A new look at screening and diagnosing diabetes mellitus. J Clin Endocrinol Metab 93: 2447-2453 .
- Sacks DB (2007) Correlation between hemoglobin A1c (HbA1c) and average blood glucose: can HbA1c be reported as estimated blood glucose concentration? J Diabetes Sci Technol 1: 801-803 .
- American Diabetes Association (2010) Standards of medical care in diabetes--2010. Diabetes care 33: S11-61 .
- Nathan DM, Kuenen J, Borg R, Zheng H, Schoenfeld D, et al. (2008) Translating the A1C assay into estimated average glucose values. Diabetes care 31: 1473-1478 .
- Hare MJ, Shaw JE, Zimmet PZ (2012) Current controversies in the use of haemoglobin A1c. J Intern Med 271: 227-236.
- Bell JR (2008) The New Glycohemoglobin Standard: Will Estimated Average Glucose Boost Patient Understanding? Clinical Laboratory News 34: 1-4.
- SAS Institute (2014) SAS Home Page.
- DiMaggio C (2013) SAS for epidemiologists: applications and methods. New York: Springer 258 .
- SAS Institute (2014) Proc TTest.
- Bennett CM, Guo M, Dharmage SC (2007) HbA(1c) as a screening tool for detection of Type 2 diabetes: a systematic review. Diabet Med 24: 333-343 .
- Raum E, Kramer HU, Ruter G, Rothenbacher D, Rosemann T, et al. (2012) Medication non-adherence and poor glycaemic control in patients with type 2 diabetes mellitus. Diabetes Res Clin Pract 97: 377-384 .
- Kramer HU, Raum E, Ruter G, Schottker B, Rothenbacher D, et al. (2012) Gender disparities in diabetes and coronary heart disease medication among patients with type 2 diabetes: results from the DIANA study. Cardiovasclar diabetology 1: 88 .
- Hilawe EH, Yatsuya H, Kawaguchi L, Aoyama A (2013) Differences by sex in the prevalence of diabetes mellitus, impaired fasting glycaemia and impaired glucose tolerance in sub-Saharan Africa: a systematic review and meta-analysis. Bull World Health Organ 91: 671-682D .
- Sasisekhar TVD, Shabana S, Sirisha Y, Bharga V (2013) Gender: Does it have role has a role in glycaemic control and diabetic distress in type 2 diabetes? IOSR Journal of Dental and Medical Sciences (IOSR-JDMS) 4: 48-51 .
- Barre DE, Mizier-Barre KA, Griscti O, Hafez K (2007) Gender: does it have role has a role in glycaemic control in Caucasians with wellcontrolled type 2 diabetes? Int J Diabetes & Metabolism 15: 76-80 .
- Abdelmoneim I, Al-Homrany MA (2002) Health education in the management of diabetes at the primary health care level: is there a gender difference? East Mediterr Health J 8: 18-23 .
- Kirk JK, D'Agostino RB Jr, Bell RA, Passmore LV, Bonds DE, et al. (2006) Disparities in HbA1c levels between African-American and non-Hispanic white adults with diabetes: a meta-analysis. Diabetes care 29: 2130-2136 .
- Kirk JK, Passmore LV, Bell RA, Narayan KM, D'Agostino RB, Jr, et al. (2008) Disparities in A1C levels between Hispanic and non-Hispanic white adults with diabetes: a meta-analysis. Diabetes care 31: 240-246 .
- Venugopal S, Kunju R, Al Harthy S, Al Zadjali N (2008) Hemoglobin A1c in Muscat, Oman - A 3 year study. Oman med J 23: 170-172 .
- Rasmussen-Torvik LJ, Li M, Kao WH, Couper D, Boerwinkle E, et al. (2011) Association of a fasting glucose genetic risk score with subclinical atherosclerosis: The Atherosclerosis Risk in Communities (ARIC) study. Diabetes 60: 331-335 .
- van 't Riet E, Alssema M, Rijkelijkhuizen JM, Kostense PJ, Nijpels G, et al. (2010) Relationship between A1C and glucose levels in the general Dutch population: the new Hoorn study. Diabetes care 33: 61-66 .
- Mohan V, Shanthirani CS, Deepa M, Deepa R, Unnikrishnan RI, et al. (2006) Mortality rates due to diabetes in a selected urban south Indian population--the Chennai Urban Population Study [CUPS--16]. J Assoc Physicians India 54: 113-117 .
- Raja Reddy P, Reethesh RP, Mahesh V (2013) The association between estimated average glucose levels and fasting plasma glucose levels in a rural tertiary care centre. Global Journal Of Medicine And Public Health 2: 1-5.
- Bozkaya G, Ozgu E, Karaca B (2010) The association between estimated average glucose levels and fasting plasma glucose levels. Clinics 65: 1077-1080 .
- Goldstein DE, Little RR, Lorenz RA, Malone JI, Nathan D, et al. (2004) Tests of glycemia in diabetes. Diabetes care 27: 1761-1773 .
- Jelinek HF, Yatsko A, Stranieri A, Venkatraman S (2014) Novel Data Mining Techniques for Incomplete Clinical Data in Diabetes Management. British Journal of Applied Science & Technology 4: 4591-4606.
- Hempe JM, Soros AA, Chalew SA (2010) Estimated average glucose and self-monitored mean blood glucose are discordant estimates of glycemic control. Diabetes care 33: 1449-1451 .
- Chalew SA, Hempe JM, McCarter R (2009) Clinically significant disagreement between mean blood glucose and estimated average glucose in two populations: implications for diabetes management. J Diabetes Sci Technol 3: 1128-1135 .
- Verma A, Muthukrishnan J, Harikumar KVS, Modi KD (2009) HbA1c and Average Blood glucose. Calicut Medical Journal 7: e3.
Article Alerts
Subscribe to our articles alerts and stay tuned.
 This work is licensed under a Creative Commons Attribution 4.0 International License.


 Save to Mendeley
