Archives of Community Medicine and Public Health
East-Central Europe-World’s Coronavirus Death Center
John S Craven*
Cite this as
Craven JS (2022) East-Central Europe-World’s Coronavirus Death Center. Arch Community Med Public Health 8(1): 035-040. DOI: 10.17352/2455-5479.000171Copyright License
© 2022 Craven JS. This is an open-access article distributed under the terms of the Creative Commons Attribution License, which permits unrestricted use, distribution, and reproduction in any medium, provided the original author and source are credited.A review of the Countries with the highest coronavirus death rates in the world was made on February 11, 2022. The world’s average death rate that day was 746. It was not surprising to see the countries with the largest number of deaths having death rates 300- 400% of the world’s average. What was alarming was that the ten countries with the world’s highest death rates had death rates 400-800% of the world’s average and most of them were located in East-Central Europe. This paper focuses on understanding the implications of this.
Introduction
This paper is a follow-up to the evaluation conducted from April 2020 through December 2021 on the “World’s Coronavirus Death Regions and Why” (Craven, 2021). The full evaluation, which consisted of nine PowerPoint presentations is stored on a website https://worldscoronavirusdeathregionswhy.wordpress.com created November 2021. 1The Abstract/Summary for the evaluation is included as Appendix A in this paper and provides an understanding of the boundaries and limitations of this evaluation [1-9].
On February 12, 2022, the Worldometer Coronavirus reported that the six countries with the most coronavirus deaths were (1) USA, (2) Brazil, (3) India, (4) Russia, (5) Mexico, and (6) Peru. The Worldometer Coronavirus that day also reported that six countries with the world’s highest death rates per one million population were (1) Peru, (2) Bulgaria, (3) Bosnia & Herzegovina, (4) Hungary, (5) Montenegro, and (6) North Macedonia with death rates descending from 6169 to 4169. Five of these countries are located in East-Central Europe. Ponder this fact. What are the implications of this data?
1Website Link: https://worldscoronavirusdeathregionswhy.wordpress.comDiscussion
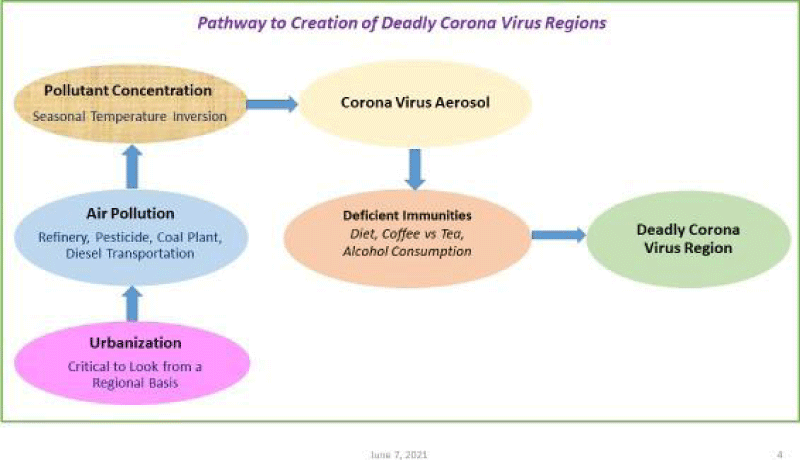
Craven’s initial evaluation (Craven, 2021) identified that the world had five significant coronavirus death regions, which accounted for 89% of the world’s coronavirus deaths. They included the four regions of European Diaspora (Eastern and Western Europe and North and South America) plus the region of the Middle East/Southwest Asia (ME/SW Asia). The data is provided in Table 1. This evaluation further supported the hypothesis that a “Pathway to Creation of Deadly Coronavirus Regions” existed. This Pathway is shown in Figure 1.
The critical factors affecting coronavirus deaths identified in the initial evaluation (Craven, 2020) were massive emissions of pollution from a variety of well-known sources (refineries, coal-powered generation, diesel transportation land and sea, pesticides spraying, consumption, runoff) in congested regions of the population under meteorological weather conditions of temperature inversions. The hypothesized conclusion from this data-based observation in May 2020 was that the primary mode of coronavirus transmission had to be via virus aerosols attaching to the surfaces of fine pollutants.
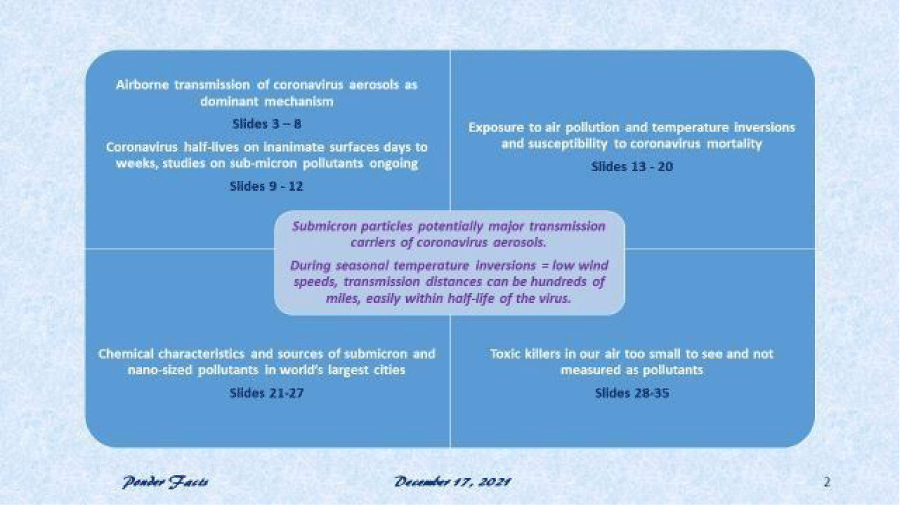
Global Air Quality Indices are based on PM2.5 and PM10 pollution particulates measured on a mass basis, not particle number or surface area. It took an additional year to grasp the importance of this distinction and its impact on the transmission of coronavirus aerosols over long distances. Studies in 2021 [10-18], Figure 2 provided critical input on the existence of sub-micron pollution particulates at such size that they are capable of traveling substantial distances allowing for extensive personnel contact. At these fine sizes, the pollutant/virus aerosols are capable of not only entering the lungs but also of entering further into the stomachs and bloodstreams, which is important as this affects the body’s natural immunities. Under temperature inversion conditions, with low wind speeds and minimal vertical mixing, these pollutant/virus aerosols are capable of traveling up to hundreds of miles, well within the half-life of coronavirus aerosols on pollutant particulate surfaces [2,11-18], Figure 3. The study in Italy’s northern region of Bergamo, Brescia, and Milano in the winter-spring of 2020 is an especially pertinent reference [13] as it provides an understanding of the interaction of fine and ultrafine pollutant particulates on the virology and immunology of people exposed to Covid-19.
The initial evaluation (Craven, 2021, [8,9] further determined that 85% of all the world’s coronavirus deaths occurred in countries directly abutting the world’s Seas and Oceans. Tables 2,3 (Craven, 2021) summarize the findings. This is important as it indicates that the range of coronavirus transmission from the Seas is easily hundreds of miles.
It is beyond the scope of this paper, but the fact that the majority, if not all, of the coronavirus deaths, are in lands abutting water, is a challenge to the WHO/CDC view that dry air is a prerequisite to transmission of coronavirus. A similar challenge can be made to conventional wisdom on the transmission that India, Brazil, Indonesia, South Africa, and the southern USA all have humid, subtropical climates with relatively warm temperatures and account for least ½ of the world’s coronavirus deaths.
On February 11 and 12, 2022 a review of the countries with the highest death rates, as reported on the Worldometer Coronavirus, was made as to the world during early February was again experiencing 12,000 coronavirus deaths per day. The expectation was that some isolated islands or territories with low populations and the countries with the most deaths would dominate the countries with the highest death rates. Review and confirmation of the top half dozen countries with the most deaths were also performed.
Tables 4-6 summarize the data reported by the Worldometer Coronavirus.
Table 4 shows that the six countries with the highest number of coronavirus deaths were the USA, Brazil, India, Russia, Mexico, Peru. These six countries accounted for 50.6% of the world’s total coronavirus deaths. Other than Peru their death rates were all between 2000 and 3000. Worldometer data is consistent with all other systems tracking coronavirus data like the NY Times and Johns Hopkins University, although the data in these systems do not precisely match.
Table 5 shows the eighteen countries with the highest death rates per million population on February 11, 2022. Cutoff selected arbitrarily was the USA as it was the country with the world’s largest number of deaths. Note the Worldometer Coronavirus keeps track of 223 countries and territories and the USA was the 18th highest. Six of these countries had death rates above 4000 (> 540% of world average) and 13 countries had death rates above 3000 (> 400% of world average). Thirteen of the eighteen countries are highlighted in red type and all of these countries are located in East-Central Europe.
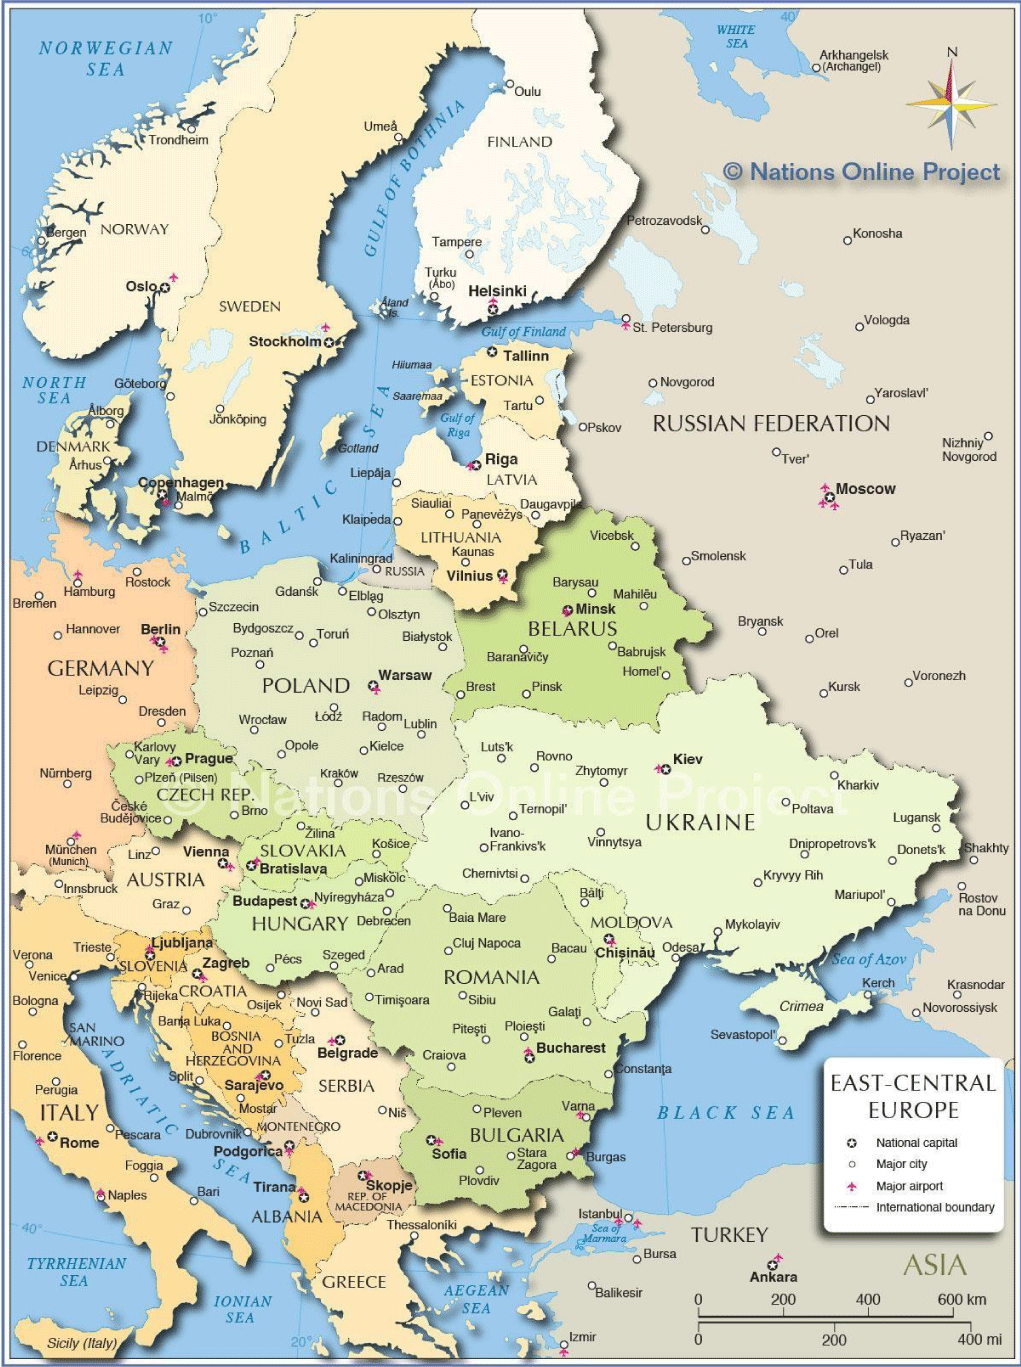
A map of East-Central Europe is shown in Figure 4. It shows 24 East-Central European countries.
Table 6 shows the death rate data for all 24 East-Central European Countries. They descend from 4986 in Bulgaria to 2320 in Russia the world’s 32nd highest death rate country. Twenty East-Central European countries are included from Bulgaria to Russia.
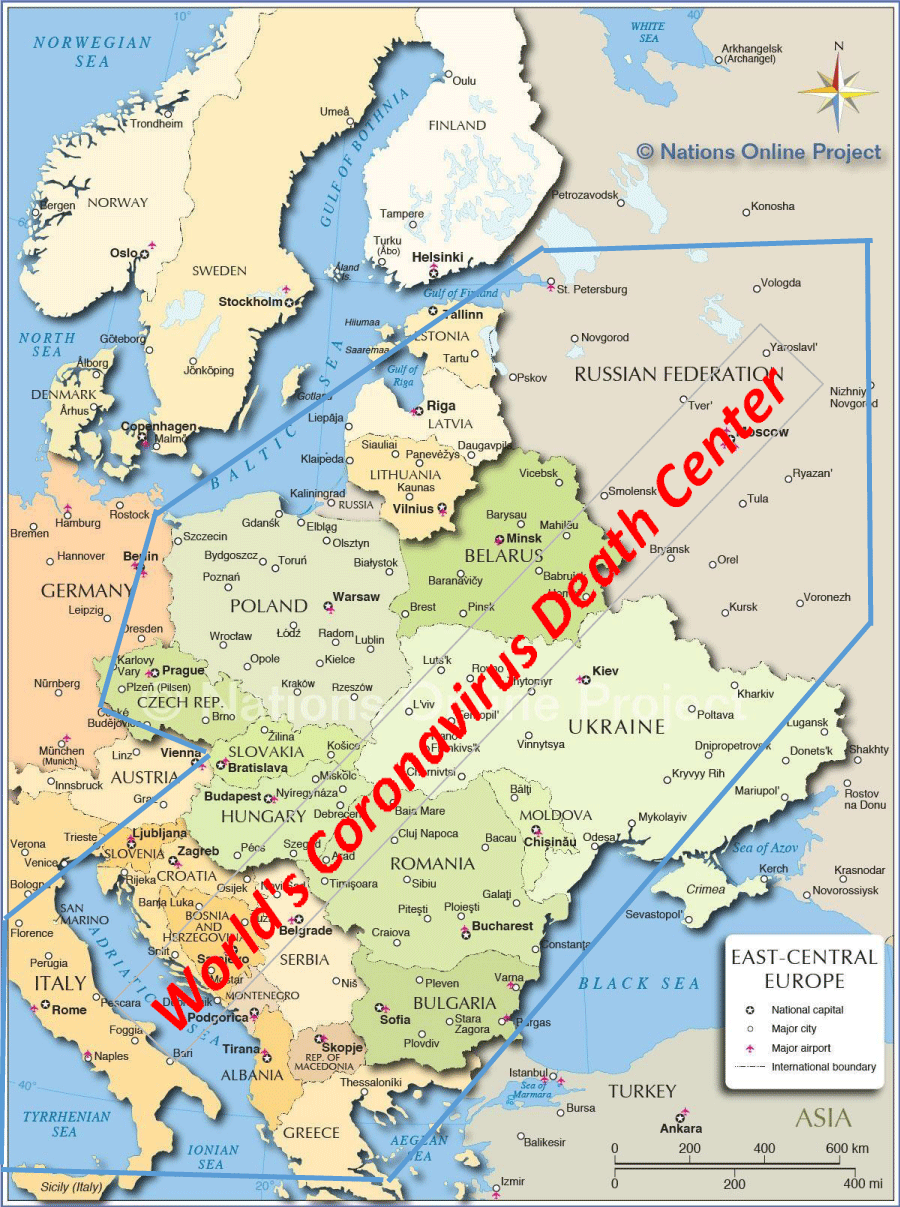
Figure 3 was constructed from the map of East-Central Europe with the boundary line drawn for the countries with death rates of Russia or higher. All 24 countries are located within the boundary line. An obvious observation from Figure 3 is that this bounded area is the historic European area of the USSR plus Italy and Greece.
The death rates in this region of the world are alarmingly high. Why has this area demonstrated extreme susceptibility to coronavirus deaths? Comparison of these observations to Craven’s initial evaluation [1-9] was done. Two aspects were searched for associated with this area – a geography/topography and information about the pollution history of this area.
Figures 3,4 show this area is surrounded by seven Seas with the distances from the Baltic Sea to the Adriatic Sea and Moscow to the Mediterranean Sea under 2,000 miles.
The search for the historic pollution of this area led to detailed analysis [19] of the origination and management of this area under the direction of the leadership of the USSR implementing the thinkings of Stalin. The full encyclopedia document is included in this report as Appendix B.
Conclusion
This paper has identified East-Central Europe as the World’s Coronavirus Death Center. Comparison of the results of this analysis to Craven’s earlier evaluation (Craven, 2021) demonstrates the validity of that evaluation. Pollution is complicit in all coronavirus deaths. Extreme pollution leads to extreme virus death rates.
- Craven JS (2021) World’s Coronavirus Death Regions & Why, Part 1 – recognition that world regions independently experienced coronavirus deaths in identifiable patterns, principally impacted by major pollution sources and exasperated by seasonal temperature inversions. Link: https://bit.ly/3tvSvED
- Craven JS (2021) World’s Coronavirus Death Regions & Why, Part 2 – Considered differences of Western World vs Eastern World do to wide difference in deaths. Link: https://bit.ly/3tvSvED
- Craven JS (2021) World’s Coronavirus Death Regions & Why, Part 3 – Recognized that majority of deaths were occurring in humid sub-tropical climates. Link: https://bit.ly/3tvSvED
- Craven JS (2021) World’s Coronavirus Death Regions & Why, Part 4 – With abrupt increase in South American deaths, focused on role of pesticides on creating deaths. Link: https://bit.ly/3tvSvED
- Craven JS (2021) World’s Coronavirus Death Regions & Why, Part 5 – Evaluated whether other world regions were similar in characteristics as their deaths increased to those in Parts 1 through 4. Link: https://bit.ly/3CglKzA
- Craven JS (2021) World’s Coronavirus Death Regions & Why, Part 6 – Realized that coronavirus deaths regions were being controlled by the world’s jet streams. Link: https://bit.ly/3sGkEK6
- Craven JS (2021) World’s Coronavirus Death Regions & Why, Part 7 – Updated world coronavirus death statistics for the predominant deadly regions. Link: https://bit.ly/3CbTpdu
- Craven JS (2021) World’s Coronavirus Death Regions & Why, Part 8 – Realized that world’s largest brackish Seas, encompassing major pollution sources, accounted for 55% of world’s coronavirus deaths. Link: https://bit.ly/3HCAqtH
- Craven JS (2021) World’s Coronavirus Death Regions & Why, Part 9 – Extended evaluation to world’s brackish Oceans to findings for brackish Seas, accounting for 85% of world’s coronavirus deaths. Link: https://bit.ly/3vT3yef
- Craven JS (2021) World’s Coronavirus Death Regions & Why, Part 11, Influence of sub- micron and nano-sized pollutant particles on the transmission of coronavirus over long distances. Link: https://bit.ly/34aGwDU
- Wang CC, Prather KA, Sznitman J, Jimenez JL, Lakdawala SS, et al. (2021) Airborne Transmission of Respiratory Viruses. Science 373: eabd9149. Link: https://bit.ly/3HFoSWH
- Ren SY, Wang WB, Hao YG, Zhang HR, Wang ZC, et al. (2020) Stability and infectivity of coronaviruses in inanimate environments, Author information Article notes Copyright and License information Disclaimer. World J Clin Cases 8: 1391-1399. Link: https://bit.ly/34aGDiO
- Comunian S, Dongo D, Milani C, Palestini P (2020) Air Pollution and COVID-19: The Role of Particulate Matter in the Spread and Increase of COVID-19’s Morbidity and Mortality. Int J Environ Res Public Health 17: 4487. Link: https://bit.ly/35mGlpW
- Khorsandi B, Farzad K, Tahriri H, Maknoon R (2021) Association between short-term exposure to air pollution and COVID-19 hospital admission/mortality during warm seasons. Environ Monit Assess 193: 426. Link: https://bit.ly/35Nen6e
- Keikhosravi G, Fadavi SF (2021) Impact of the inversion and air pollution on the number of patients with Covid-19 in the metropolitan city of Tehran. Urban Clim 37: 100867. Link: https://bit.ly/3vIs2Xv
- Lang J, Li S, Cheng S, Zhou Y, Chen D, et al. (2018) Chemical Characteristics and Sources of Submicron Particles in a City with Heavy Pollution in China. Atmosphere 9: 388. Link: https://bit.ly/35HQiOl
- Pollution from nanomaterials, Wikipedia, Part of a series of articles on the Impact of nanotechnology Health and safety, Nanotechnologies »Level3» Question 5 Nanotechnologies home Source document: SCENIHR (2006), Summary & Details: GreenFacts (2007) About...Nanotechnologies.
- Smedley T (2019) The toxic killers in our air too small to see. Link: https://bbc.in/3pDdrIR
- Cunningham MA, French HF (1991) Restoring the Eastern European and Soviet Environments. In State of the World 1991. New York: Norton, 1991; Eastern European Pollution, Encyclopedia.com. Link: https://bit.ly/3KgtKmG
Article Alerts
Subscribe to our articles alerts and stay tuned.
 This work is licensed under a Creative Commons Attribution 4.0 International License.


 Save to Mendeley
