Archives of Community Medicine and Public Health
The potential for Big Data in Type 2 diabetes
Hyer SL1*, Chang J2, Chuah LL3, Manzoor R4 and Philip N5
2John Chang, Consultant Paediatrician, Croydon Health Services NHS Trust, UK
3Ling Ling Chuah, Consultant in Endocrinology & Metabolic Medicine, Faculty of Science, Engineering & Computing, Kingston University, London, UK
4Razaak Manzoor, Post-doctoral researcher in Big data, Kingston University, London, UK
5Nadia Philip, Associate Professor, Kingston University, London, UK
Cite this as
Hyer SL, Chang J, Chuah LL, Manzoor R Philip N (2019) The potential for Big Data in Type 2 diabetes. Arch Community Med Public Health 5(1): 039-042. DOI: 10.17352/2455-5479.000051Type 2 diabetes is a chronic condition associated with long term complications and premature death. It is a leading cause of non-traumatic amputations, renal failure and blindness. With advances in information technology, diabetes patient data are increasingly collated digitally, however, there is no unified minimal dataset agreed nationally or internationally for data collection. A huge amount of data including patient data, pathology reports, and prescription information is generated by health providers and this information collectively is known as “Big Data.” The Aegle project, A European Union Horizon 2020 funded study, looks at the issue of gathering Big Data, with the aim of harnessing it to help develop personalised therapy to patients with the aim of improving health and optimise outcomes. In this paper, we highlight the potential of the Aegle Project to harness Big Data with real data examples. At the clinical decision support user interface, we show examples where predictive analysis helps stratify patients into risk categories for complications and for therapeutic responses. At the research-oriented user interface, we show how the implementation of this integrated data system has already revealed novel associations that could form the basis for future clinical studies.
Introduction
A consortium of clinicians, computer scientists, and academic institutional partners secured funding within the EU Horizon 2020 Framework programme of the European Union, for the Aegle Project [1]. The expressed aim was to determine if utilisation of Big Data across the web was possible and if so, whether the data gathered could enhance patient care in a variety of clinical situations. The three conditions chosen were (i) Chronic Lymphatic Leukaemia, (ii) Intensive Care Unit data profiles, and (iii) Type 2 diabetes mellitus (T2DM). This paper focuses on the potential of Big Data analysis and visualisation for type 2 diabetes.
Methods
The diabetes teams managing T2DM in South England (Croydon, Epsom and St Helier), and Northern Ireland agreed to participate in this project. Based on their clinical services, an initial search of their diabetes database availability was established before formal application to the ethics and data custodians were made to secure the data. Early agreement for data release for Croydon and Epsom and St Helier was resolved within the first year. Data using the DiamondR platform, a comprehensive diabetes management system [2], was not secured until the third year. Once agreements were in place, the data was extracted from the relevant databases, anonymised and merged for Big Data analysis.
It was evident early in the project that despite all the centres managing type 2 diabetes patients, none of the databases were identical in structure or format. The Croydon database spanned over ten years and had the simplest database design, but migration of data proved incomplete resulting in a reduction in the number of expected clinical data for analysis. The software at Epsom and St Helier used for diabetes data collection (ProwellnessR database), a commercial diabetes database [3], was built on a complex structure and data release had to be purchased from the company. Extracted data was arranged in separate data fields that needed reconfiguring before it was possible to combine with Croydon data. Accessing the data from the DiamondR database also proved difficult and the extracted data needed to be restructured before uploading onto a web server for analysis.
Results
Data on 16,936 patients (8.45 GB) was extracted from the DiamondR database. This was combined with data from 3886 patients (46.47 MB) from Croydon and 17,968 patients (14.69 MB) from the Prowellness data files, giving a total data pool from 38,790 patients. Pre-processing of the extracted data was undertaken on site to ensure all data was anonymised, and configured to enable transmission across the web allowing data to be uploaded onto the web server. Big data analytics were employed to enable end-users to analyse the data.
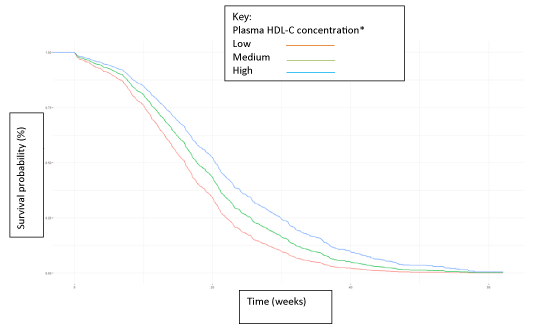
A predictive analysis was then performed, modelling for significant future events such as death, renal or visual impairment, amputations or cardiovascular events such as heart attacks or strokes. An example of predictive analysis in relation to survival and plasma high density lipoprotein (HDL) concentration is shown in figure 1. The probability of survival is shown to separate early, based on the mean HDL concentration. Similar analyses were performed for a variety of clinical and laboratory variables including blood pressure, body mass index (BMI), and HbA1c, a measure of glycaemic control [4]. Inputting individual patient data will help stratify patients into low or high risk for survival. Future analyses may help identify novel predictors of future complications. This, in turn, would allow a more cost-efficient health care approach with more resources allocated to those at highest risk.
Other visual displays were generated which allows separation of patients into specified clusters based on clinical and laboratory variables. Recently there has been much interest in subtypes of diabetes following a landmark paper from Scandinavia and the analytics employed here could be used to verify the sub-stratification suggested by the Scandinavian investigators [5]. Future clinical trials based on the identified subtypes could help tailor and target particular treatments to those patients who would benefit most.
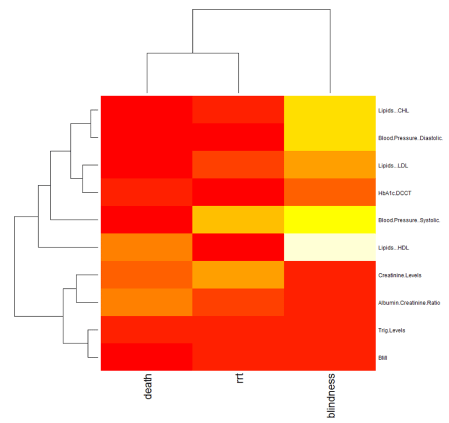
Big data can also be conveniently displayed as a heat map where colours and their intensity can provide a rapid visual summary of the strength of associations between variables. An example of a heat map generated from our Big data is shown in figure 2. Interestingly, this reveals a novel association between body mass index (BMI) and blindness, an association that would need further investigation.
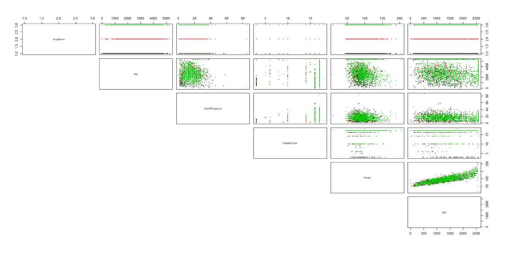
Analysis results from Big data can also be graphically displayed as scatter plots looking for associations between a variety of variables. An example of this is shown below in relation to drug usage from extracted data contained within the DiamondR data files (Figure 3). Here the use of first, second and third line therapies are plotted against selected variables (age, date of diagnosis, diabetes type, weight and body mass index). Cluster analysis demonstrates those variables associating most strongly with particular therapies. This has the potential to predict those patients who are likely to fail on first line treatments and to target treatments to defined patient groups.
Discussion
One of the key issues noted early in this project was how often data was not shared between health providers rendering the ability to harness the full power of Big Data analysis to be limited. Attempts were made to broaden the base from which data could be extracted by approaching surrounding health care organisations including hospitals, general practices and health authorities. Some organisations did not have dedicated diabetes databases, others used commercial databases and were unwilling to share information. Thus the results presented here are limited to the collaborating centres mentioned above.
Despite these limitations, we have been able to establish predictive modelling of outcomes, with adjustable set ups, that has great potential to help reduce life time risk for the individual patient. Likewise clustering of pharmacological agents, in line with health style choices, has the potential to identify the most effective treatment to be provided in line with the concept of personalised medicine. The wide confidence limits of the Big Data analysis to predict certain future events results directly from the limited data available, and could be overcome with robust diabetic data sharing so that all patient information is held in one repository in a cloud based application with agreed minimal dataset collection. Such cloud enabled frameworks that integrate Big Data are already being utilised to predict major new adverse health conditions (health shocks) [6]. Greater patient and professional engagement are needed if we are to realise the potential of Big data in health care management [7].
It is clear that Big data analytics have the potential to improve patient care from drug analysis to risk stratification to prediction of future events. A pertinent question to be addressed is how much data is needed to make valid conclusions that could be generalizable to the wider population. For clinical teams, analytics on over 35,000 patients would be considered Big data, given the diversity and variability of the data captured [8]. However, in terms of the amount of data processed, this report is based on less than 10 gigabytes of data and Big data analytics commonly deals with terabytes or even petabytes of data as exists at national or international level rather than in institutions. However, Big data techniques applied to smaller amounts of data shared between healthcare organisations can provide novel and valuable information which can serve as hypothesis generating for future studies [9]. Randomised controlled clinical trials will still be required to test the validity of the modelling and the impact of any proposed therapeutic interventions. By addressing modifiable variables, health outcomes can be optimised.
Data sharing across healthcare providers has also the benefit of encouraging partnership within these institutions for patient benefits. Sharing results of analyses between participating centres resulted in them becoming more motivated to ensure high quality information is collected. Data sharing will need to adhere strictly to general data protection regulation (GDPR) policies.
Internationally, there is variable interest in Big data analytics in the management of diabetes. On the one hand, the Scandinavian countries have a national diabetes register and have achieved consensus on a uniform data set to be collected. By contrast, there was little interest shown in patient support group or individual healthcare provider within UK to share their diabetes data. Recently New Zealand has called for a virtual National Diabetes Register. Elsewhere, such as in the Middle East, commercial diabetes databases are used but so far, no effort has been made to combine these data into a single data repository for Big data analysis. In the future, individual patients may be asked directly for permission to share their data for the benefit of future generations with the condition. The Aegle platform has already demonstrated the ability to upload anonymised data across the web, and for relevant authorities to allow analysis of these data.
Conclusion
Healthcare organisations generate a mass of information on patients with diabetes but much of this is unstructured and rarely shared across traditional boundaries of community and hospital healthcare providers. By extracting data from several disparate sources, the Aegle project has demonstrated the feasibility of integrating and analysing data on large numbers of patients in different settings from England and Northern Ireland. The real data examples show how the results can be displayed in an easily understandable way and reveal the great potential of this methodology to improve patient care.
We acknowledge the generous grant from Horizon 2020 Framework programme of the European Union to fund the Aegle Project under Grant Agreement number 644906. We gratefully acknowledge the administrative help of Aline Cook.
- Aegle- Pioneering healthcare future. Link: http://bit.ly/2LFB5Bk
- Diamond: A comprehensive diabetes management system for better patient care. Link: http://bit.ly/2Xs3v8Z
- Prowellness: Chronic diseases management systems. Link: http://bit.ly/2xzThUB
- Kovatchev BP (2017) Metrics for glycaemic control - from HbA1c to continuous glucose monitoring. Nat Rev Endocrinol 13: 425-436. Link: http://bit.ly/2Nz8uAh
- Ahlqvist E, Storm P, Käräjämäki A, Martinell M, Dorkhan M, et al. (2018) Novel subgroups of adult-onset diabetes and their association with outcomes: a data driven cluster analysis of six variables. Lancet Diabetes Endocrinol 6: 361-369. Link: http://bit.ly/2L59Q3O
- Shahid M, Rahat I, Faiyaz D (2016) Cloud enabled data analytics and visualization framework for health-shocks prediction. Future Generation Computer Systems 65: 169-181. Link: http://bit.ly/2LyRWWu
- Lawrence NR, Bradley SH (2018) Big data and the NHS – we have the technology but we need patient and professional engagement. Future Healthcare Journal 53: 229-230. Link: http://bit.ly/2S2w5rM
- De Mauro A, Greco M, Grimaldi M (2015) What is Big Data? A Consensual Definition and a Review of Key Research Topics. AIP Conference Proceedings 1644: 97-104. Link: http://bit.ly/2LC8FrX
- Lee CH, Yoon HJ (2017) Medical Big data: promises and challenges. Kidney Res Clin Pract 36: 3-11. Link: http://bit.ly/2NKP5N0
Article Alerts
Subscribe to our articles alerts and stay tuned.
 This work is licensed under a Creative Commons Attribution 4.0 International License.


 Save to Mendeley
